Copyright
©The Author(s) 2022.
World J Gastroenterol. Jul 7, 2022; 28(25): 2981-2993
Published online Jul 7, 2022. doi: 10.3748/wjg.v28.i25.2981
Published online Jul 7, 2022. doi: 10.3748/wjg.v28.i25.2981
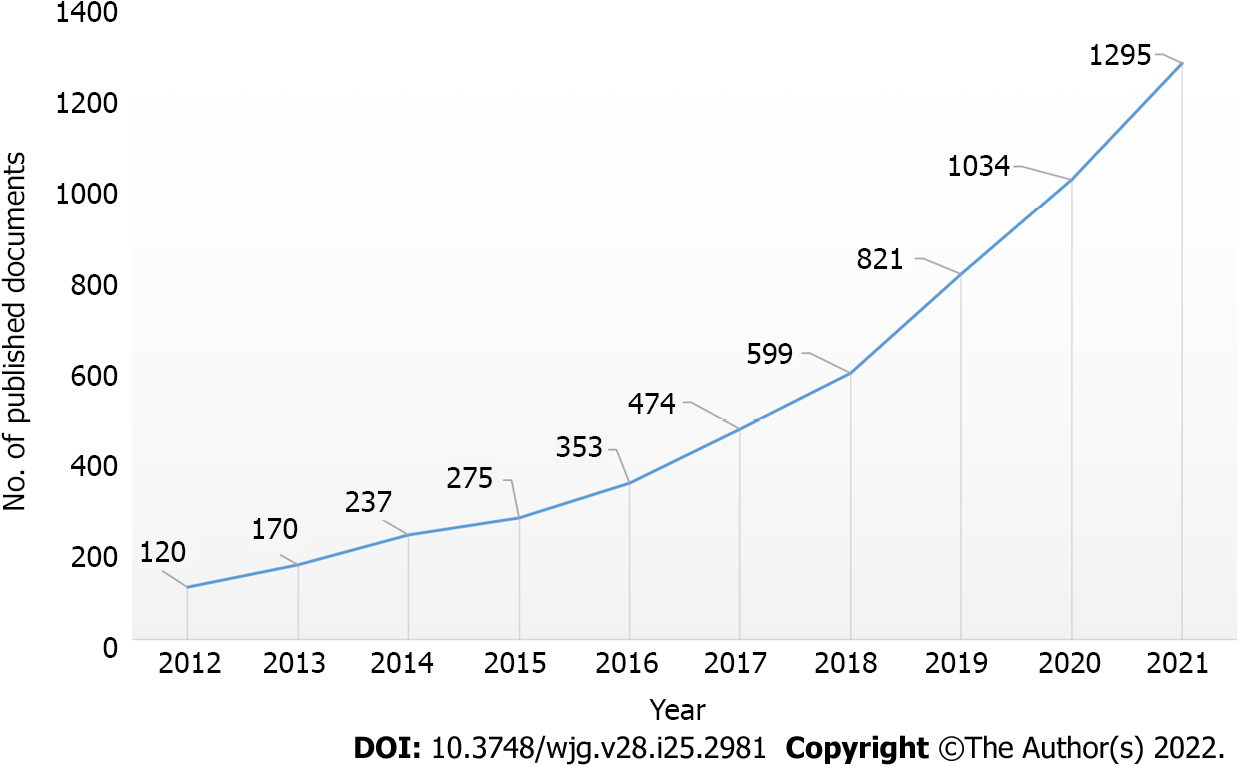
Figure 1 Growth trends of publications on the nutrition and the gut microbiota from 2012 to 2021.
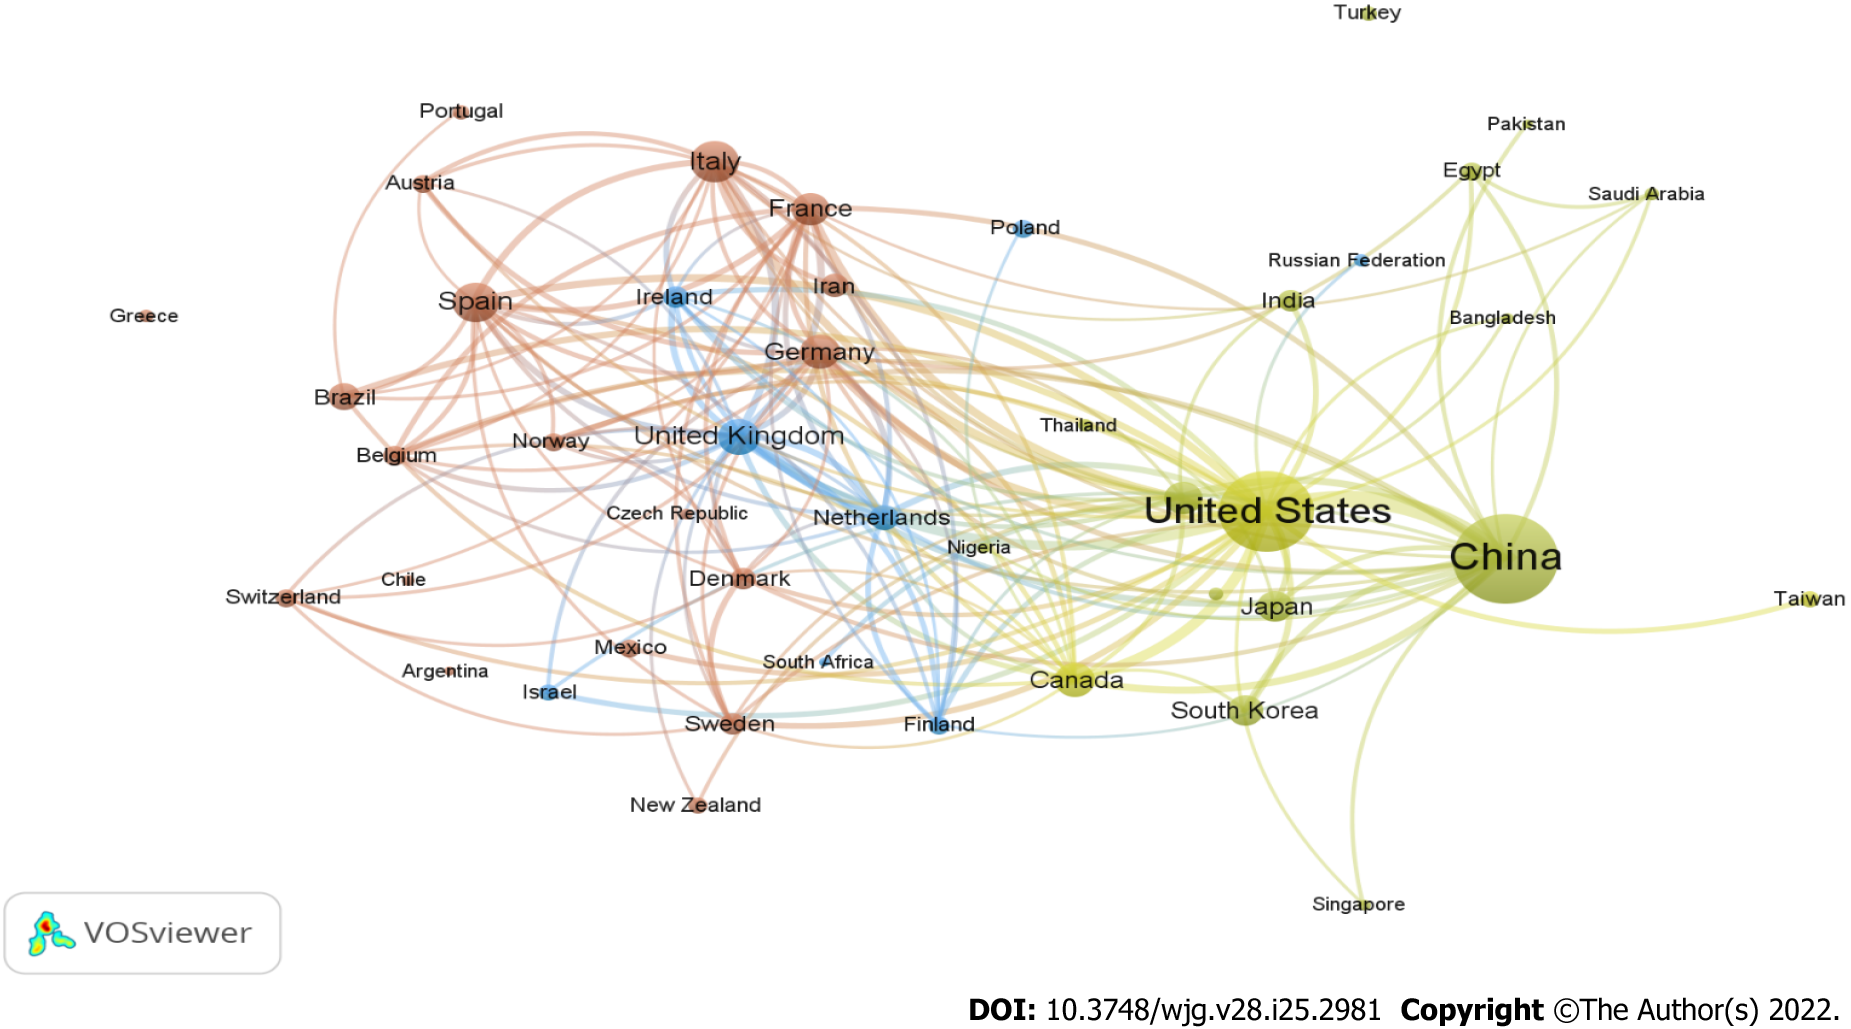
Figure 2 A network visualization map depicting international collaboration in nutrition and gut microbiota research during 2012-2021.
This visualized map of collaborations was created after each country had at least 20 publications. Of 154 countries active in this field, 44 countries meet this threshold. The node's size indicates the number of publications for that country.
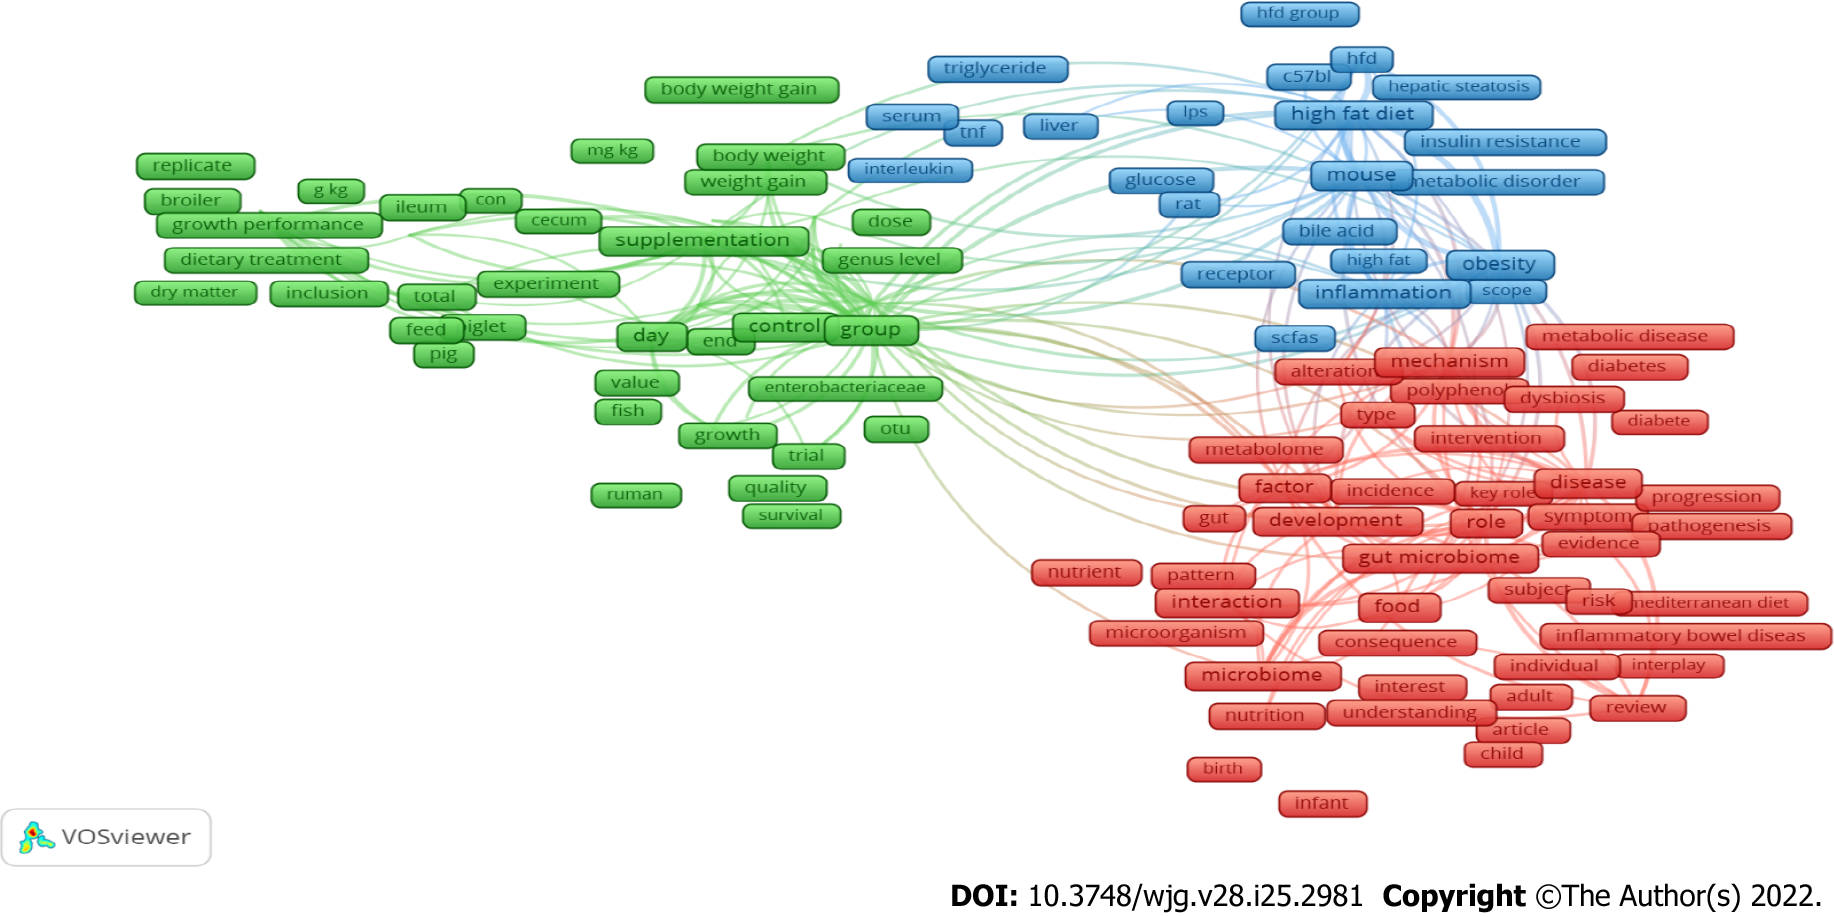
Figure 3 Network visualization map of terms in the title/abstract fields of publications relevant to nutrition and gut microbiota research from 2012 to 2021.
When the minimum-term occurrences were put 100 times, this graphical map of terms was created. Of the 85327 terms in this field, 293 achieve this threshold, which were grouped into three clusters and colored differently. The size of the frame shows the number of publications that contain that term.
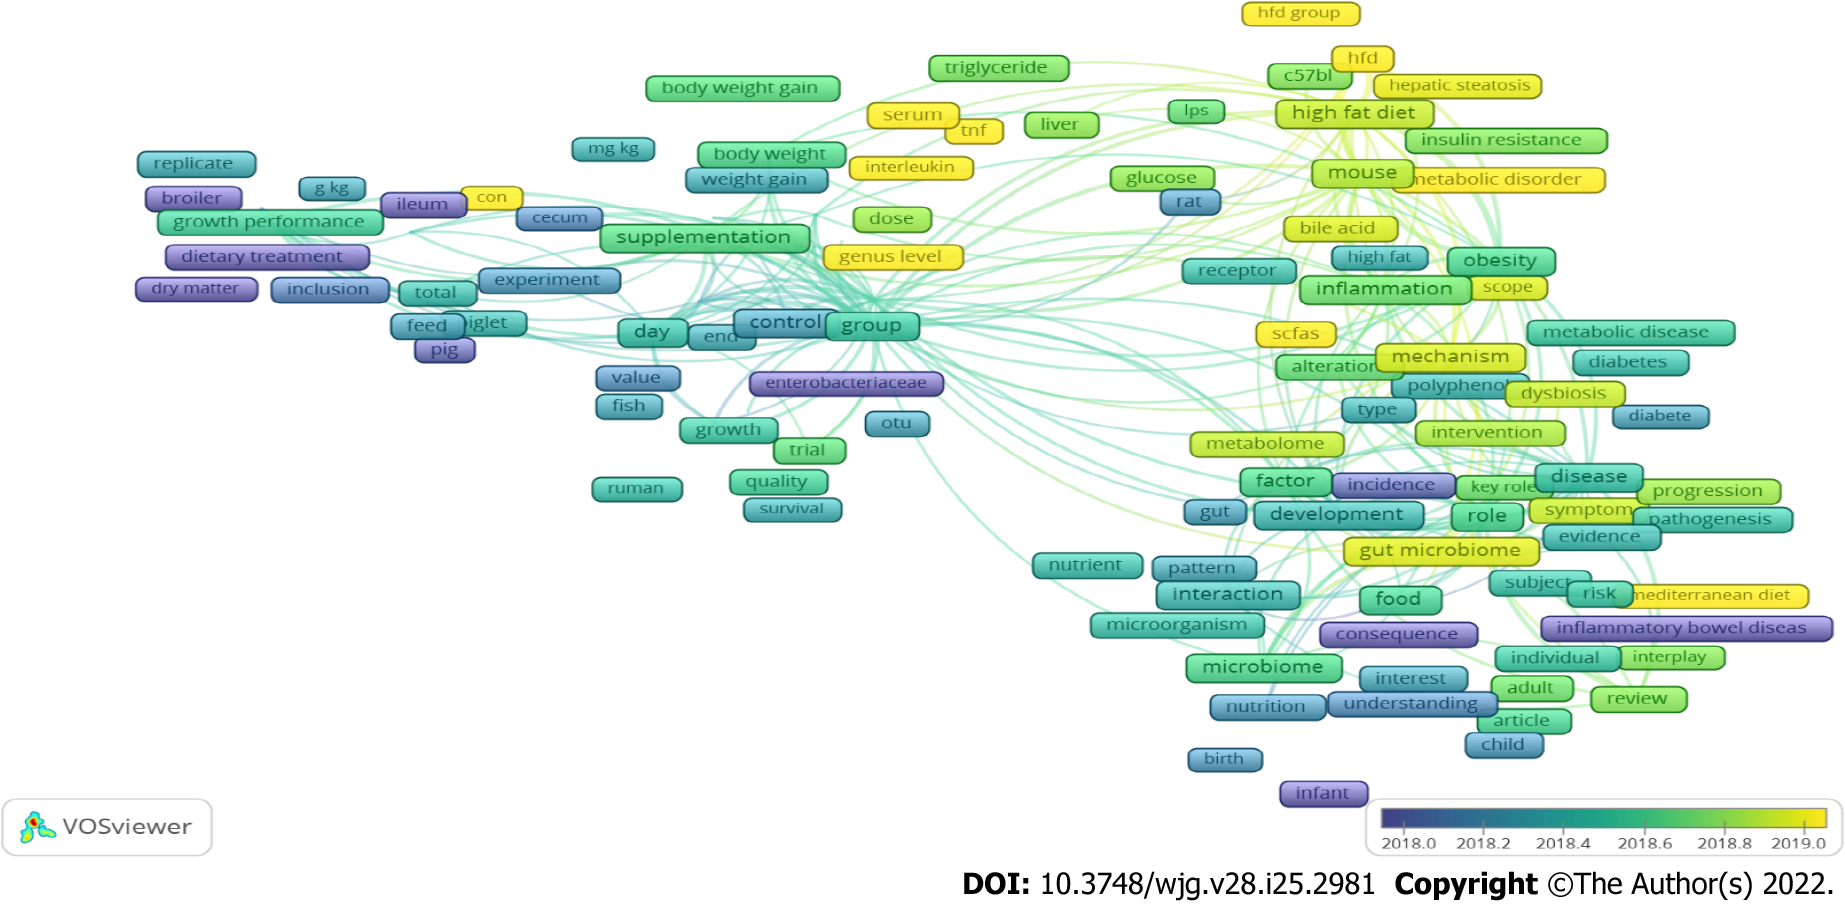
Figure 4 Network visualization map of terms in the title/abstract and their frequency of appearance of keywords is distributed according to the mean frequency of appearance.
Blue-colored and green-colored terms first showed, and then yellow terms appeared later.
- Citation: Zyoud SH, Shakhshir M, Abushanab AS, Al-Jabi SW, Koni A, Shahwan M, Jairoun AA, Abu Taha A. Mapping the global research landscape on nutrition and the gut microbiota: Visualization and bibliometric analysis. World J Gastroenterol 2022; 28(25): 2981-2993
- URL: https://www.wjgnet.com/1007-9327/full/v28/i25/2981.htm
- DOI: https://dx.doi.org/10.3748/wjg.v28.i25.2981


