Copyright
©The Author(s) 2022.
World J Gastroenterol. Jul 7, 2022; 28(25): 2937-2954
Published online Jul 7, 2022. doi: 10.3748/wjg.v28.i25.2937
Published online Jul 7, 2022. doi: 10.3748/wjg.v28.i25.2937
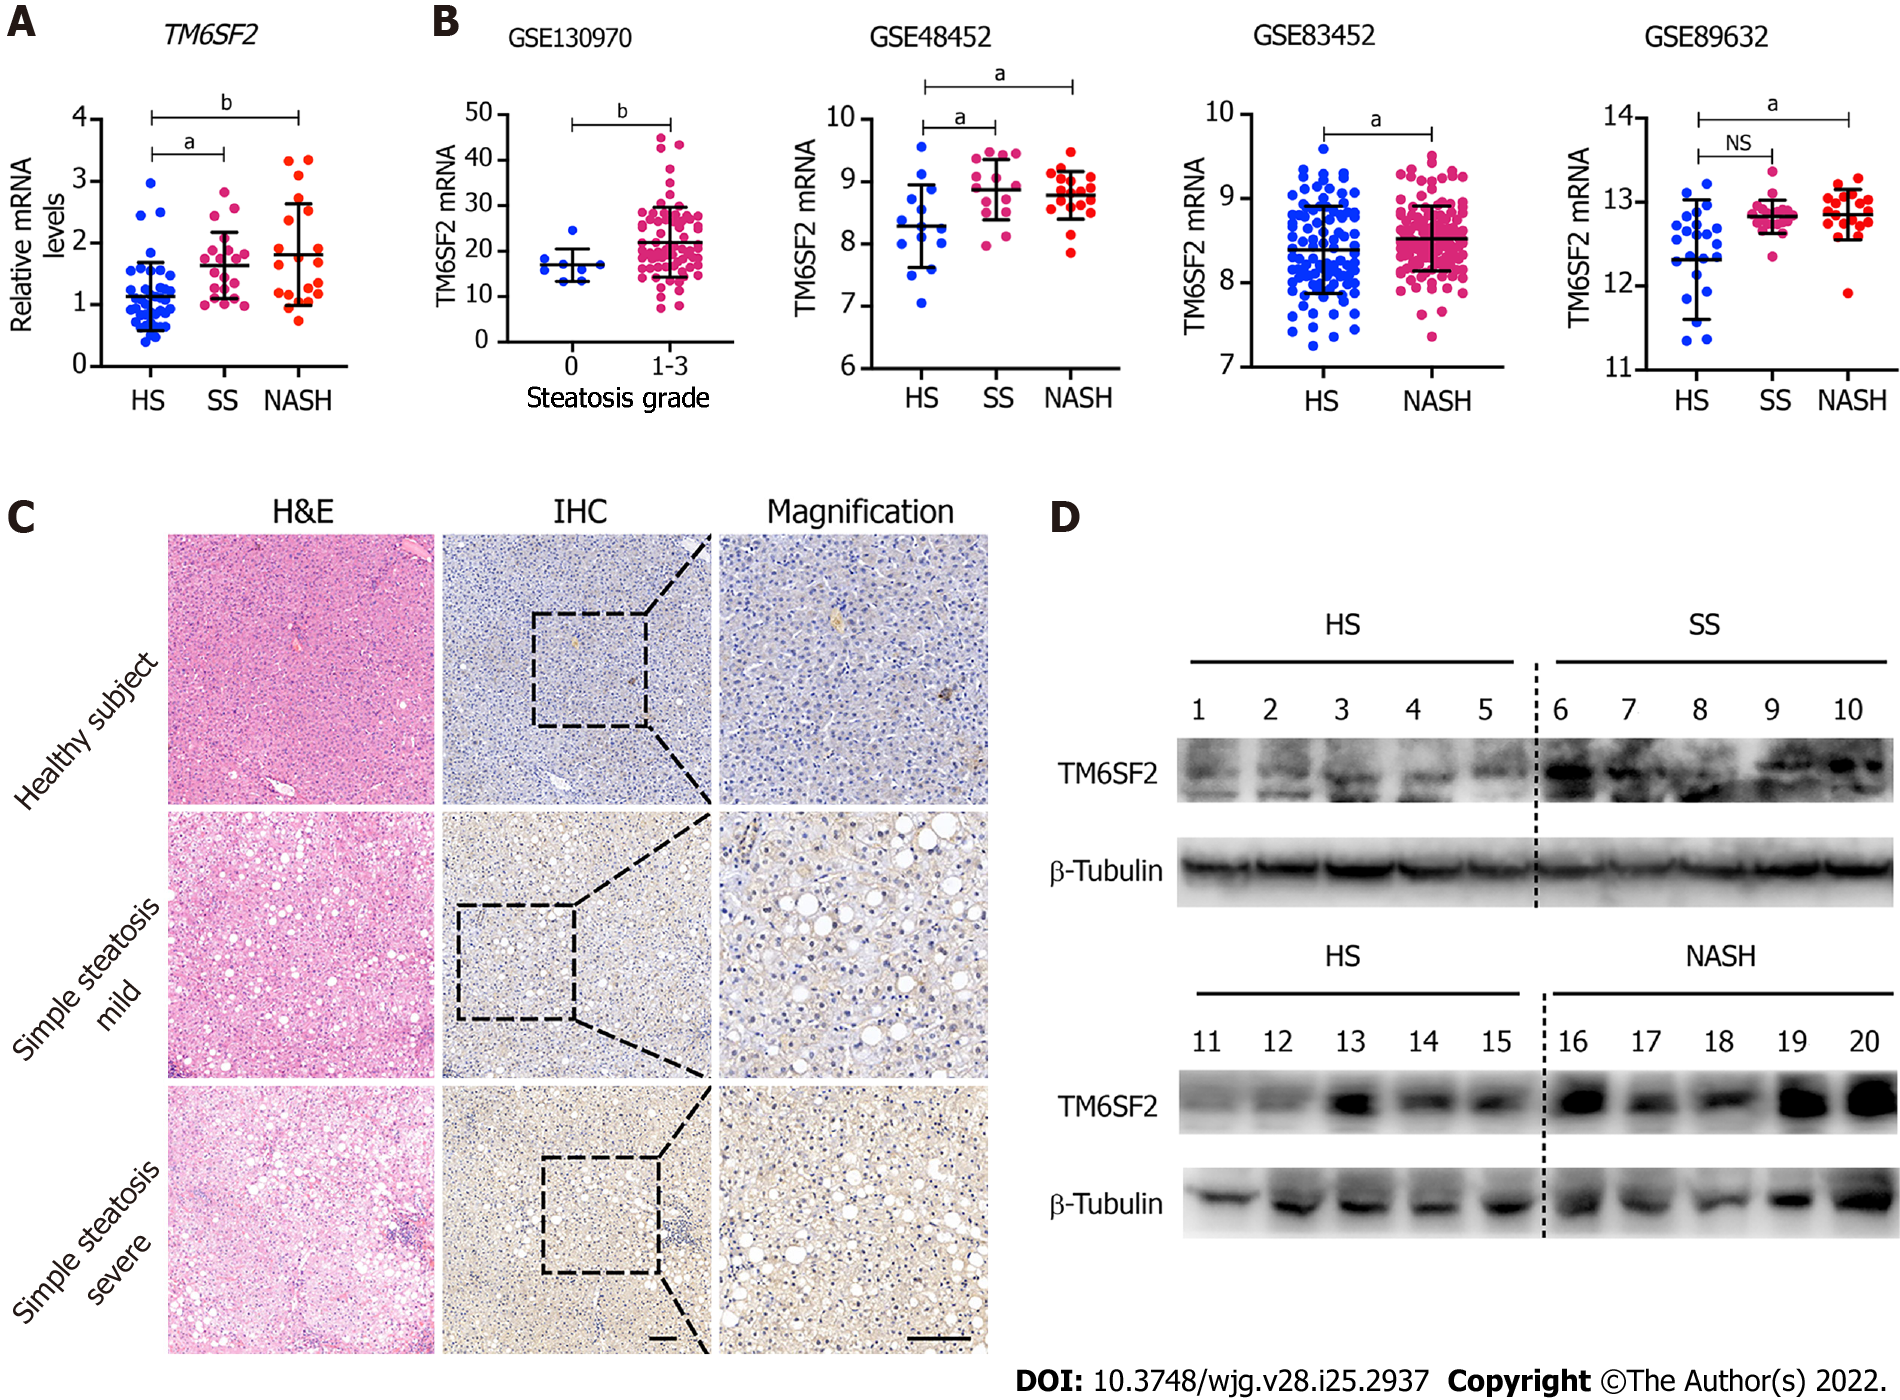
Figure 1 Hepatic TM6SF2 expression is upregulated in nonalcoholic fatty liver disease patients.
A: Hepatic mRNA levels of TM6SF2 in liver specimens, including healthy subjects (HS, n = 40) and patients with simple steatosis (SS, n = 20) or nonalcoholic steatohepatitis (NASH, n = 20); B: Hepatic mRNA levels of TM6SF2 in individuals with or without nonalcoholic fatty liver disease (NAFLD) from four expression microarray series retracted from Gene Expression Omnibus database; C: Immunohistochemical staining with TM6SF2 was performed on individuals with or without NAFLD. Representative images of normal liver tissues vs tissues of SS were shown. Scale bars: 50 μm; D: Immunoblot analysis of TM6SF2 expression in liver specimens. HS (n = 10), SS (n = 5) and NASH (n = 5). aP < 0.05; bP < 0.01, NS: Not significant; HS: Healthy subjects; SS: Simple steatosis; NASH: Nonalcoholic steatohepatitis; IHC: Immunohistochemistry; H&E: Hematoxylin and eosin.
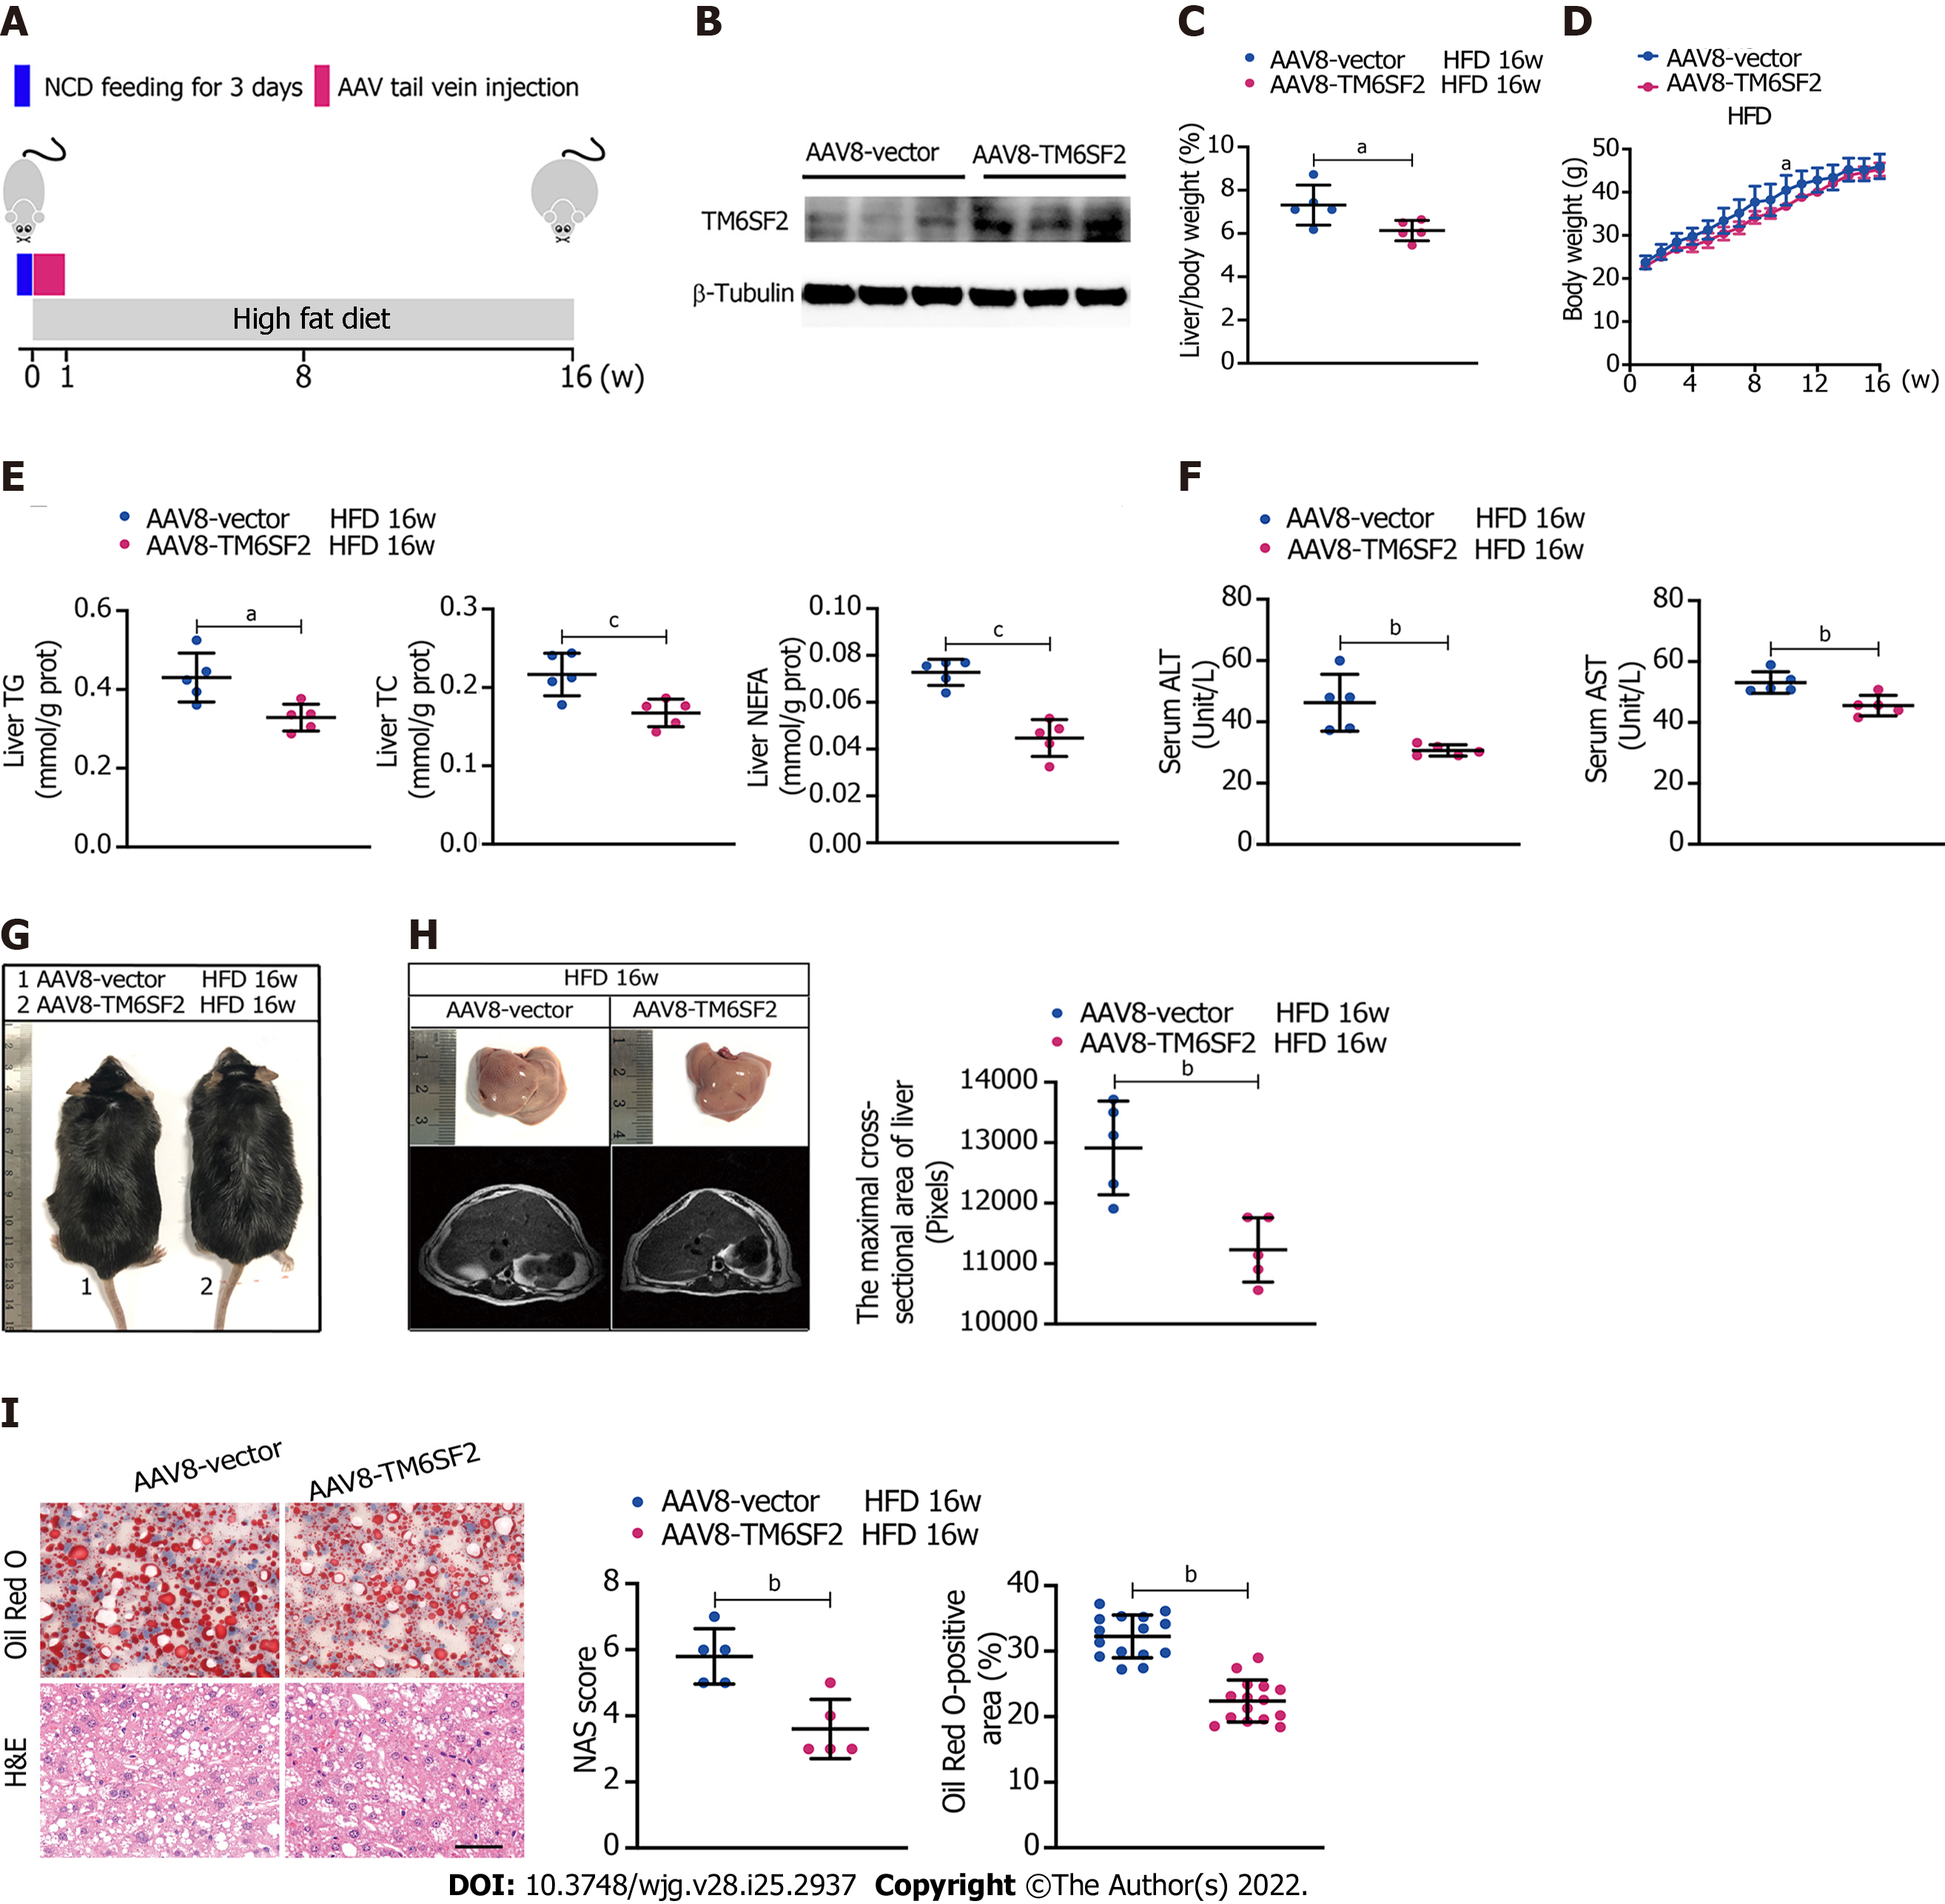
Figure 2 Overexpression of TM6SF2 improves hepatic lipid accumulation in high-fat diet-induced mice models.
A: Schematic representation of animal experiments. Mice were injected with AAV8-vector or AAV8-TM6SF2 virus via the tail vein and fed a high-fat diet for 16 wk (n = 5 mice per group); B: The efficiency of TM6SF2 overexpression in liver were shown; C-F: The liver/body weight ratio (C), the body weight (D), hepatic lipid content (E), and serum levels of alanine aminotransferase and aspartate transaminase (F) were shown; G: Representative images of gross morphology; H: Left, representative photos of fatty livers (top) and livers subjected to magnetic resonance imaging scanning (bottom) were shown. Right, the maximal cross-sectional area of livers is quantified by the number of pixels; I: Left, representative images of hematoxylin and eosin-staining (left) and Oil Red O-staining (right) of liver sections. Right, the nonalcoholic fatty liver disease activity score (left) and quantification of lipid (right, 8 fields of each mouse were examined) were performed. aP < 0.05; bP < 0.01; cP < 0.001. H&E: Hematoxylin and eosin; NCD: Normal chow diet; HFD: High-fat diet; NAS: Nonalcoholic fatty liver disease activity score.
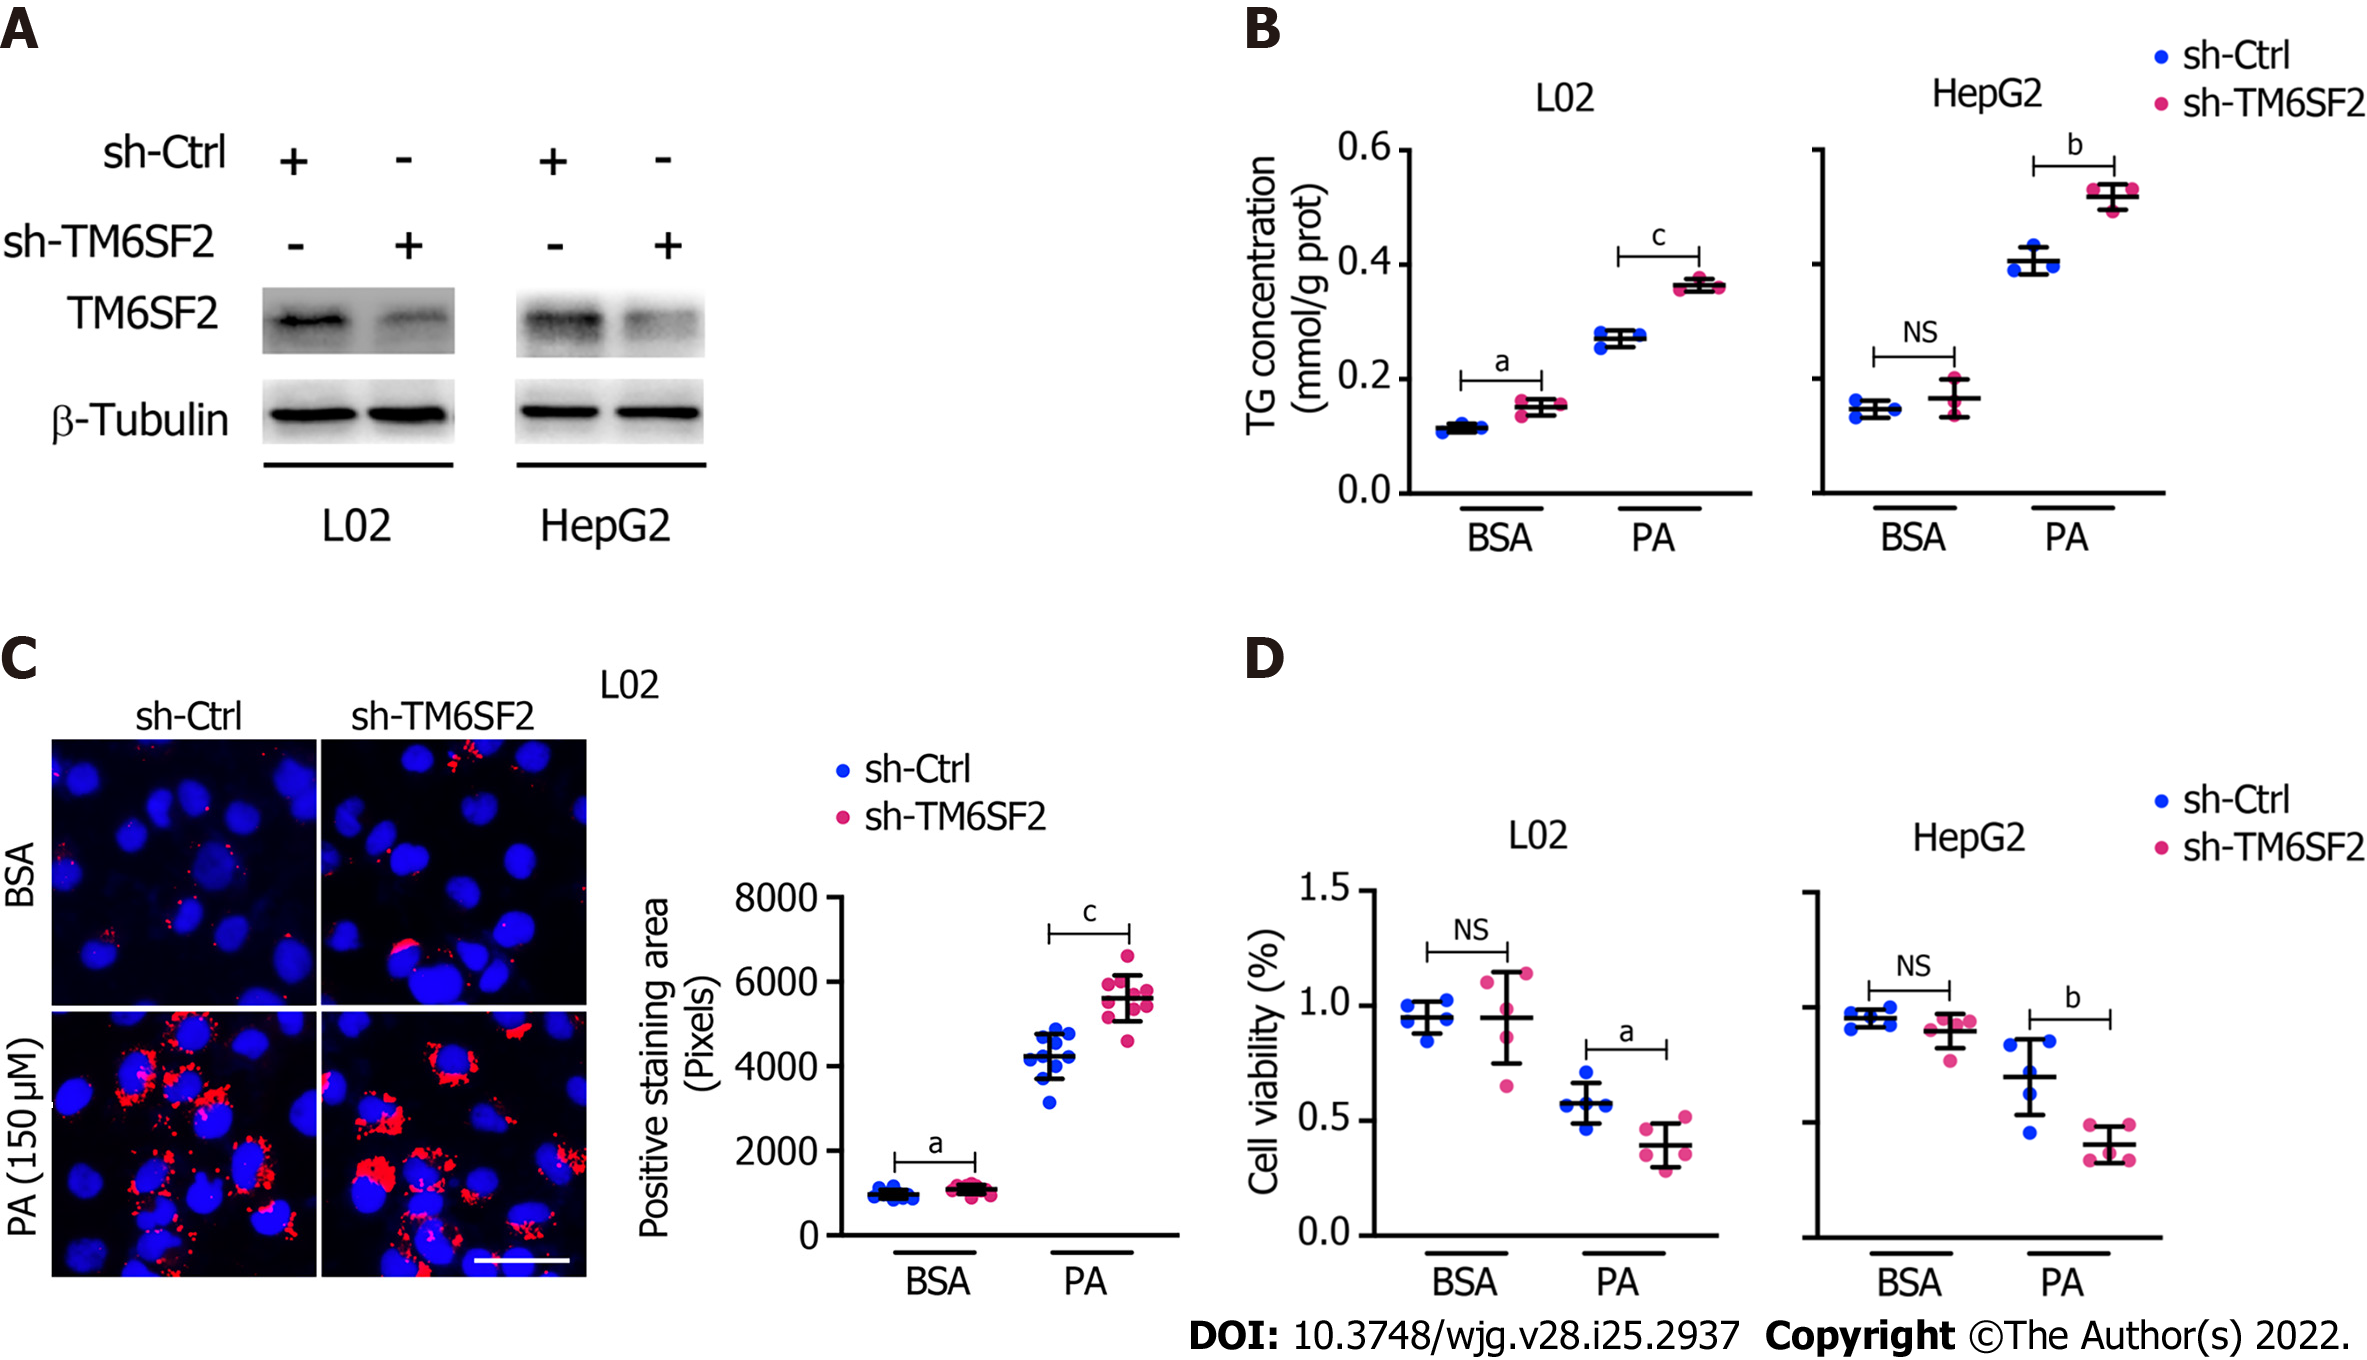
Figure 3 Knockdown of TM6SF2 promotes intracellular lipid accumulation and lipid-overload induced cell death.
A: The efficiency of TM6SF2 knockdown in two cell lines; B: Intracellular triglyceride levels (n = 3) in TM6SF2-knockdown cells were examined after palmitic acid (PA) (150 μmol/L) or bovine serum albumin (BSA) (fatty acid free) treatment for 24 h; C: Nile red staining (left, nuclei labeled with DAPI, blue) and quantification of lipid accumulation (right) of sh-Ctrl or sh-TM6SF2 L02 cells after PA or BSA treatment. Scale bars: 50 μm; D: TM6SF2-knockdown cells were incubated with PA (150 μmol/L) or BSA for 24 h. The cellular viability was examined (n = 5). aP < 0.05; bP < 0.01; cP < 0.001. NS: Not significant; BSA: Bovine serum albumin; PA: Palmitic acid; TG: Triglyceride; μM: μmol/L.
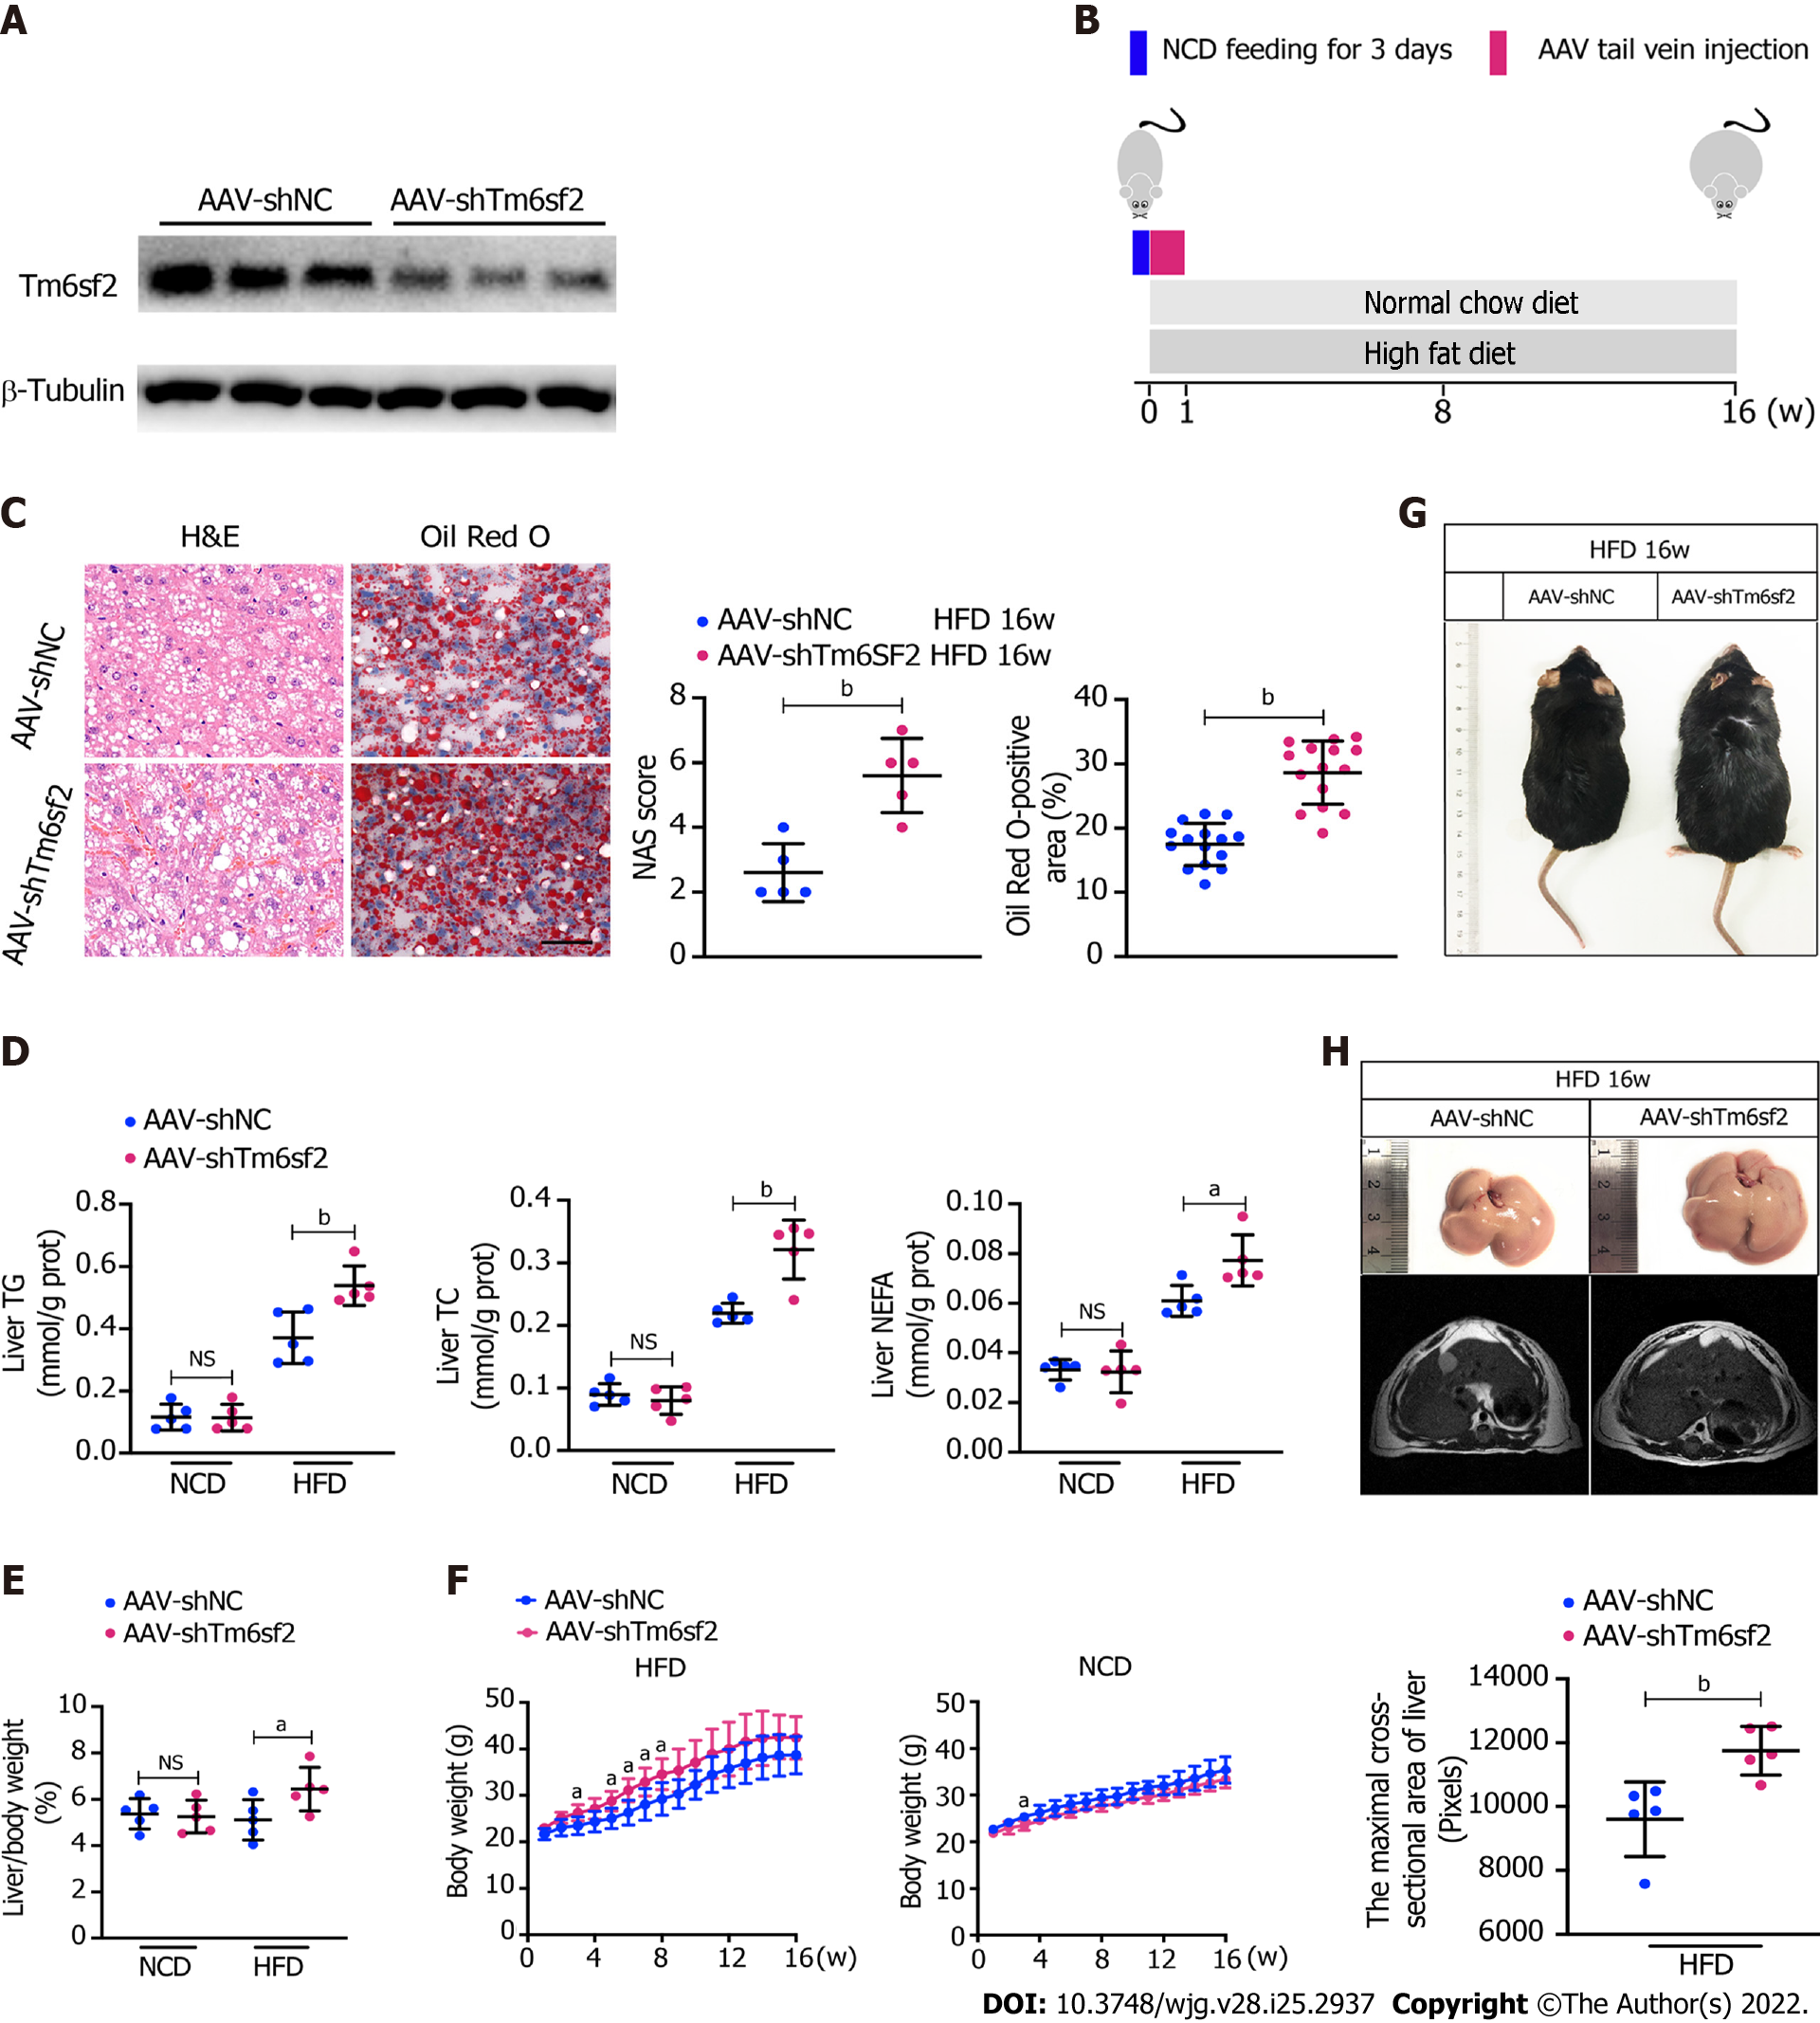
Figure 4 TM6SF2 deficiency exacerbates hepatic lipid accumulation and inflammation.
A: Mice were injected with AAV-shNC and AAV-shTm6sf2 viruses via the tail vein and fed a high-fat diet or normal chow diet for 16 wk (n = 5 mice per group). The efficiency of TM6SF2 knockdown in liver were shown; B: Schematic representation of animal experiments; C: Left, representative images of hematoxylin and eosin-staining (left) and Oil Red O-staining (right) of liver sections. Right, the Nonalcoholic fatty liver disease activity score (left) and quantification of lipid (right, 8 fields of each mouse were examined) were performed; D-F: Hepatic lipid contents (triglyceride, total cholesterol and non-esterified fatty acids) (D), liver/body weight ratio (E) and body weight (F) were measured; G: Representative images of mice morphology; H: Top, representative photos of fatty livers (top) and livers subjected to magnetic resonance imaging scanning (bottom) of mice were shown. Bottom, the maximal cross-sectional area of livers is quantified by the number of pixels. aP < 0.05; bP < 0.01. NS: Not significant; H&E: Hematoxylin and eosin; NCD: Normal chow diet; HFD: High-fat diet; TG: Triglyceride; TC: Total cholesterol; NEFA: Non-esterified fatty acids.
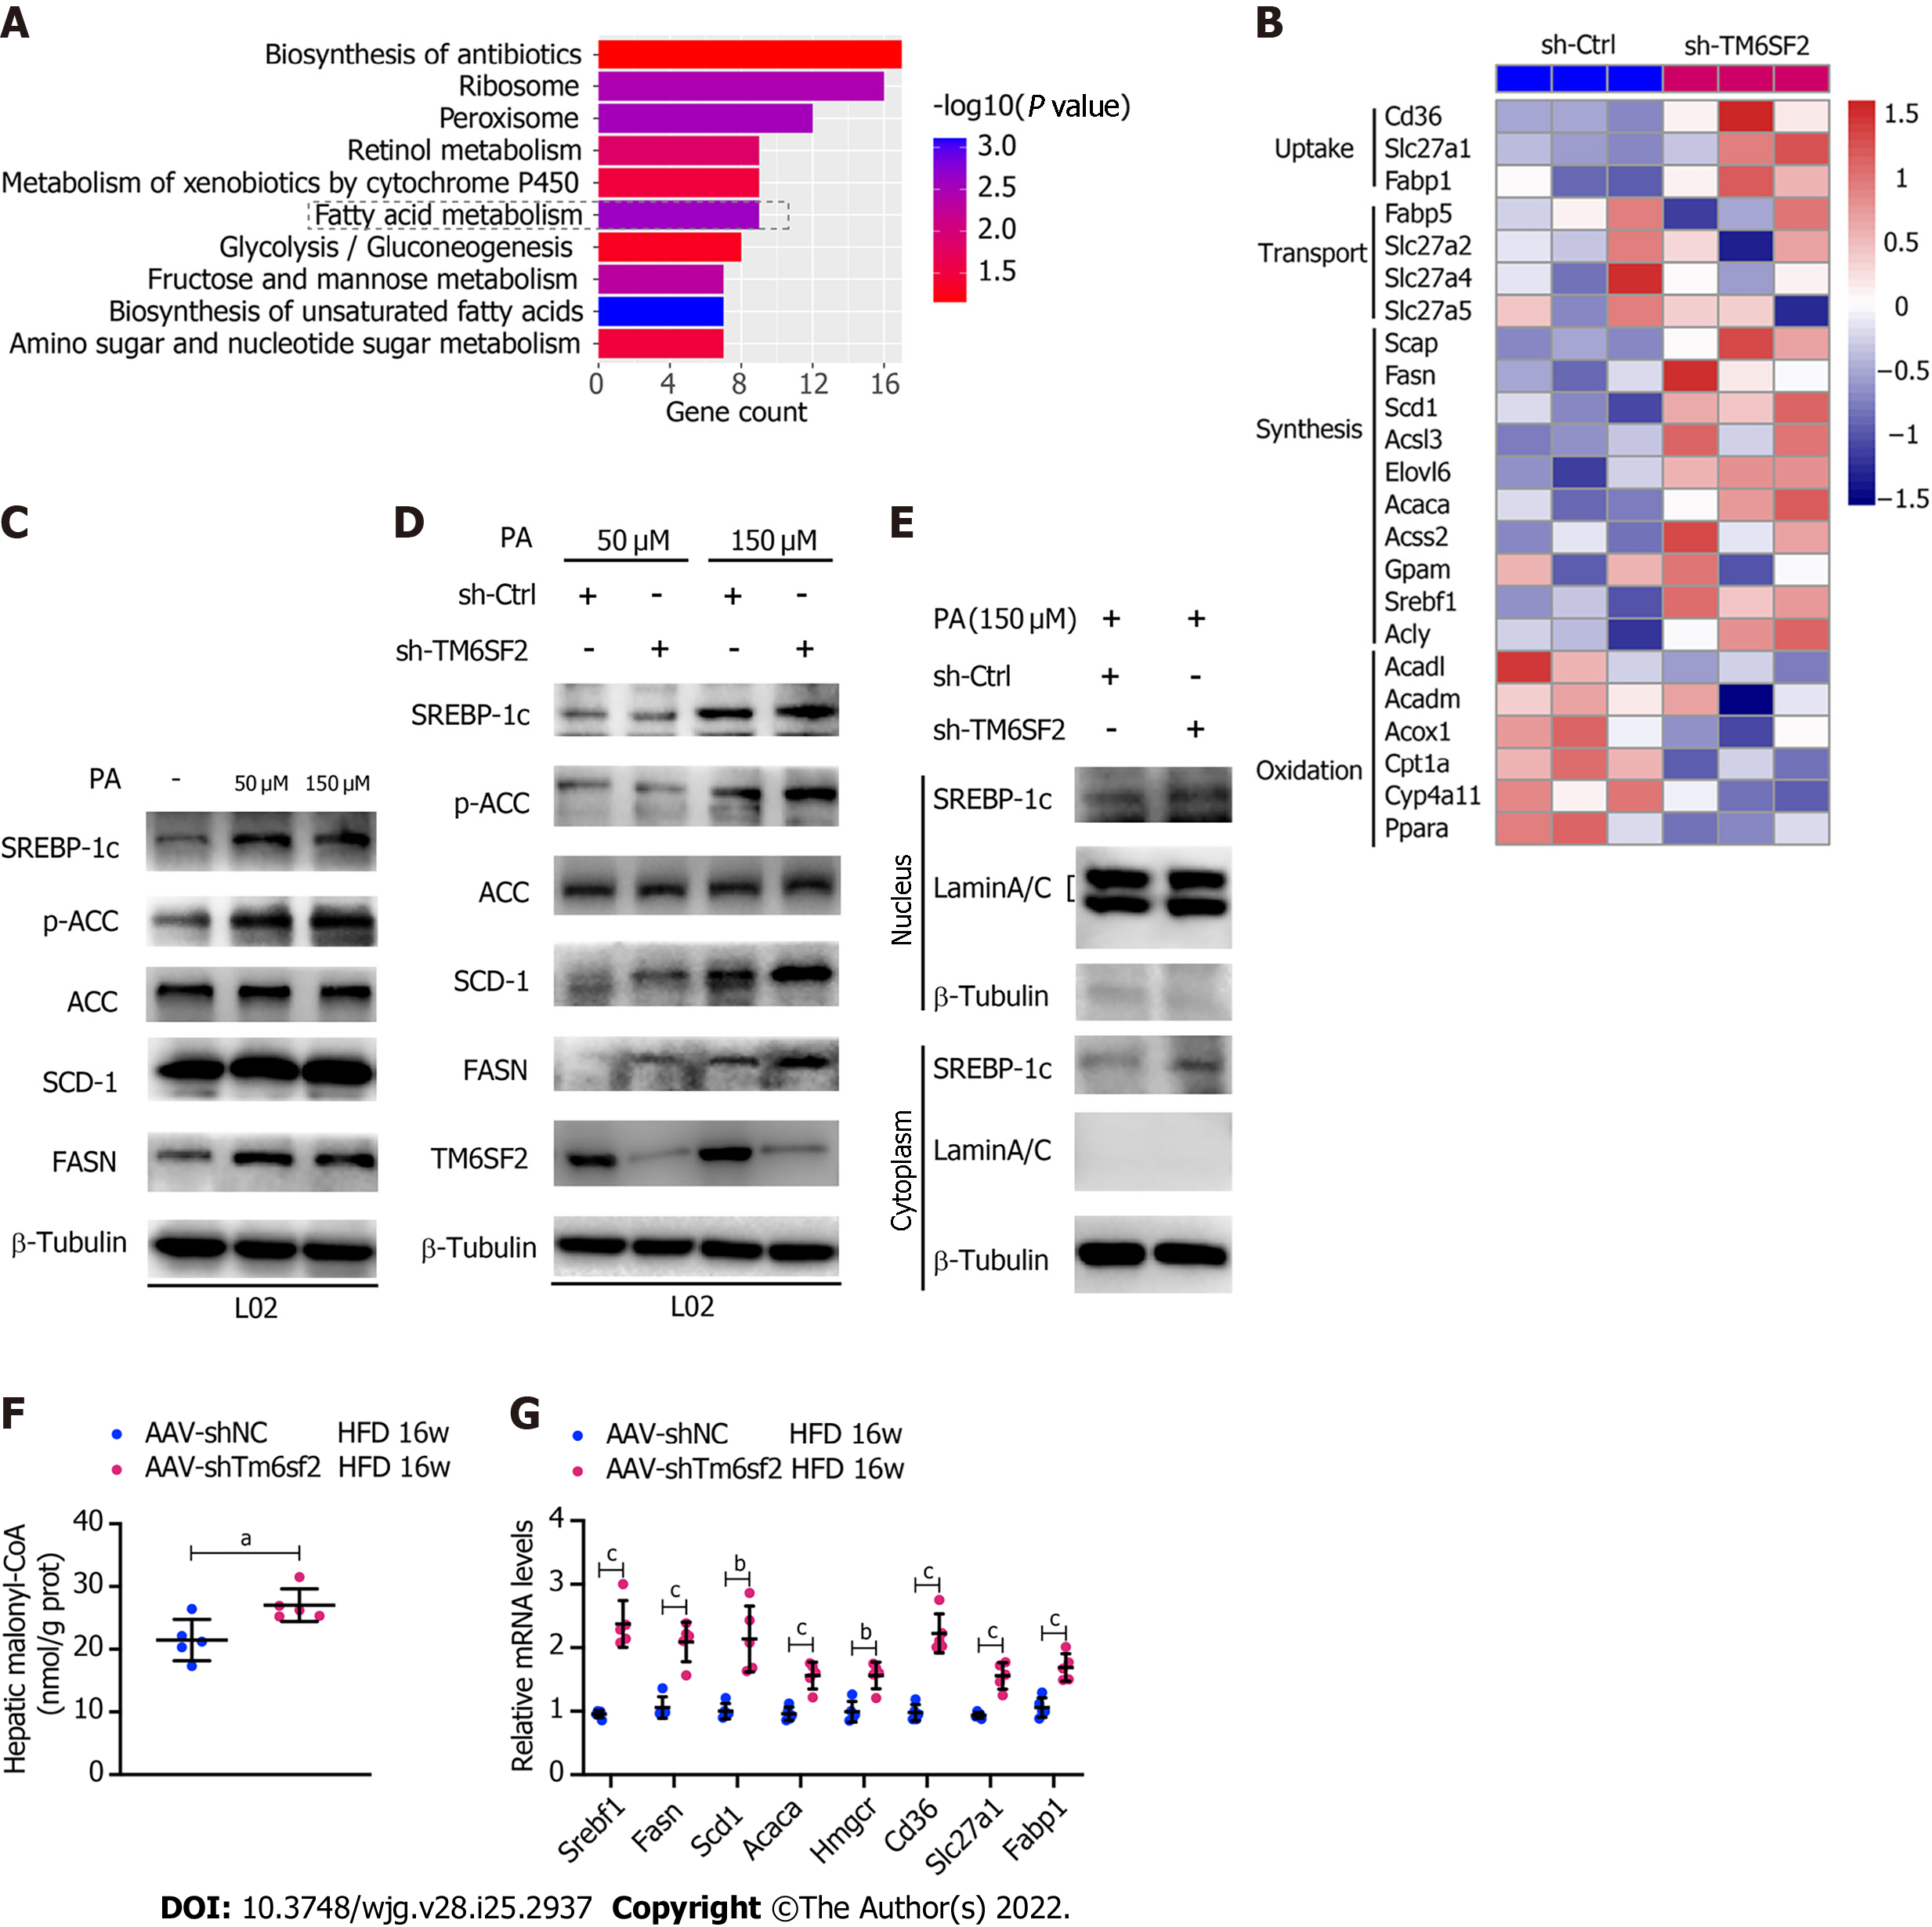
Figure 5 The activity of fatty acid synthesis was enhanced in TM6SF2 knockdown group.
A: Pathway enrichment of the up-regulated differentially expressed genes by Kyoto Encyclopedia of Genes and Genomes analysis; B: Microarray heatmap of genes involved in fatty acid metabolism in TM6SF2-knockdown cells; C: The SREBP-1c target protein levels in L02 and HepG2 cells after palmitic acid (PA) treatment; D: The SREBP-1c target protein levels in TM6SF2-knockdown cells after PA treatment; E: Immunoblot analysis of SREBP-1c in cytoplasmic and nuclear extracts; F: Hepatic malonyl-CoA contents of mice in two groups (n = 5 mice per group); G: The mRNA levels of genes involved in fatty acid synthesis (Srebf1, Fasn, Scd1, Acaca and Hmgcr) and uptake (Cd36, Slc27a1 and Fabp1). aP < 0.05; bP < 0.01; cP < 0.001. HFD: High-fat diet; PA: Palmitic acid; ACC: Acetyl-CoA carboxylase; μM: μmol/L.
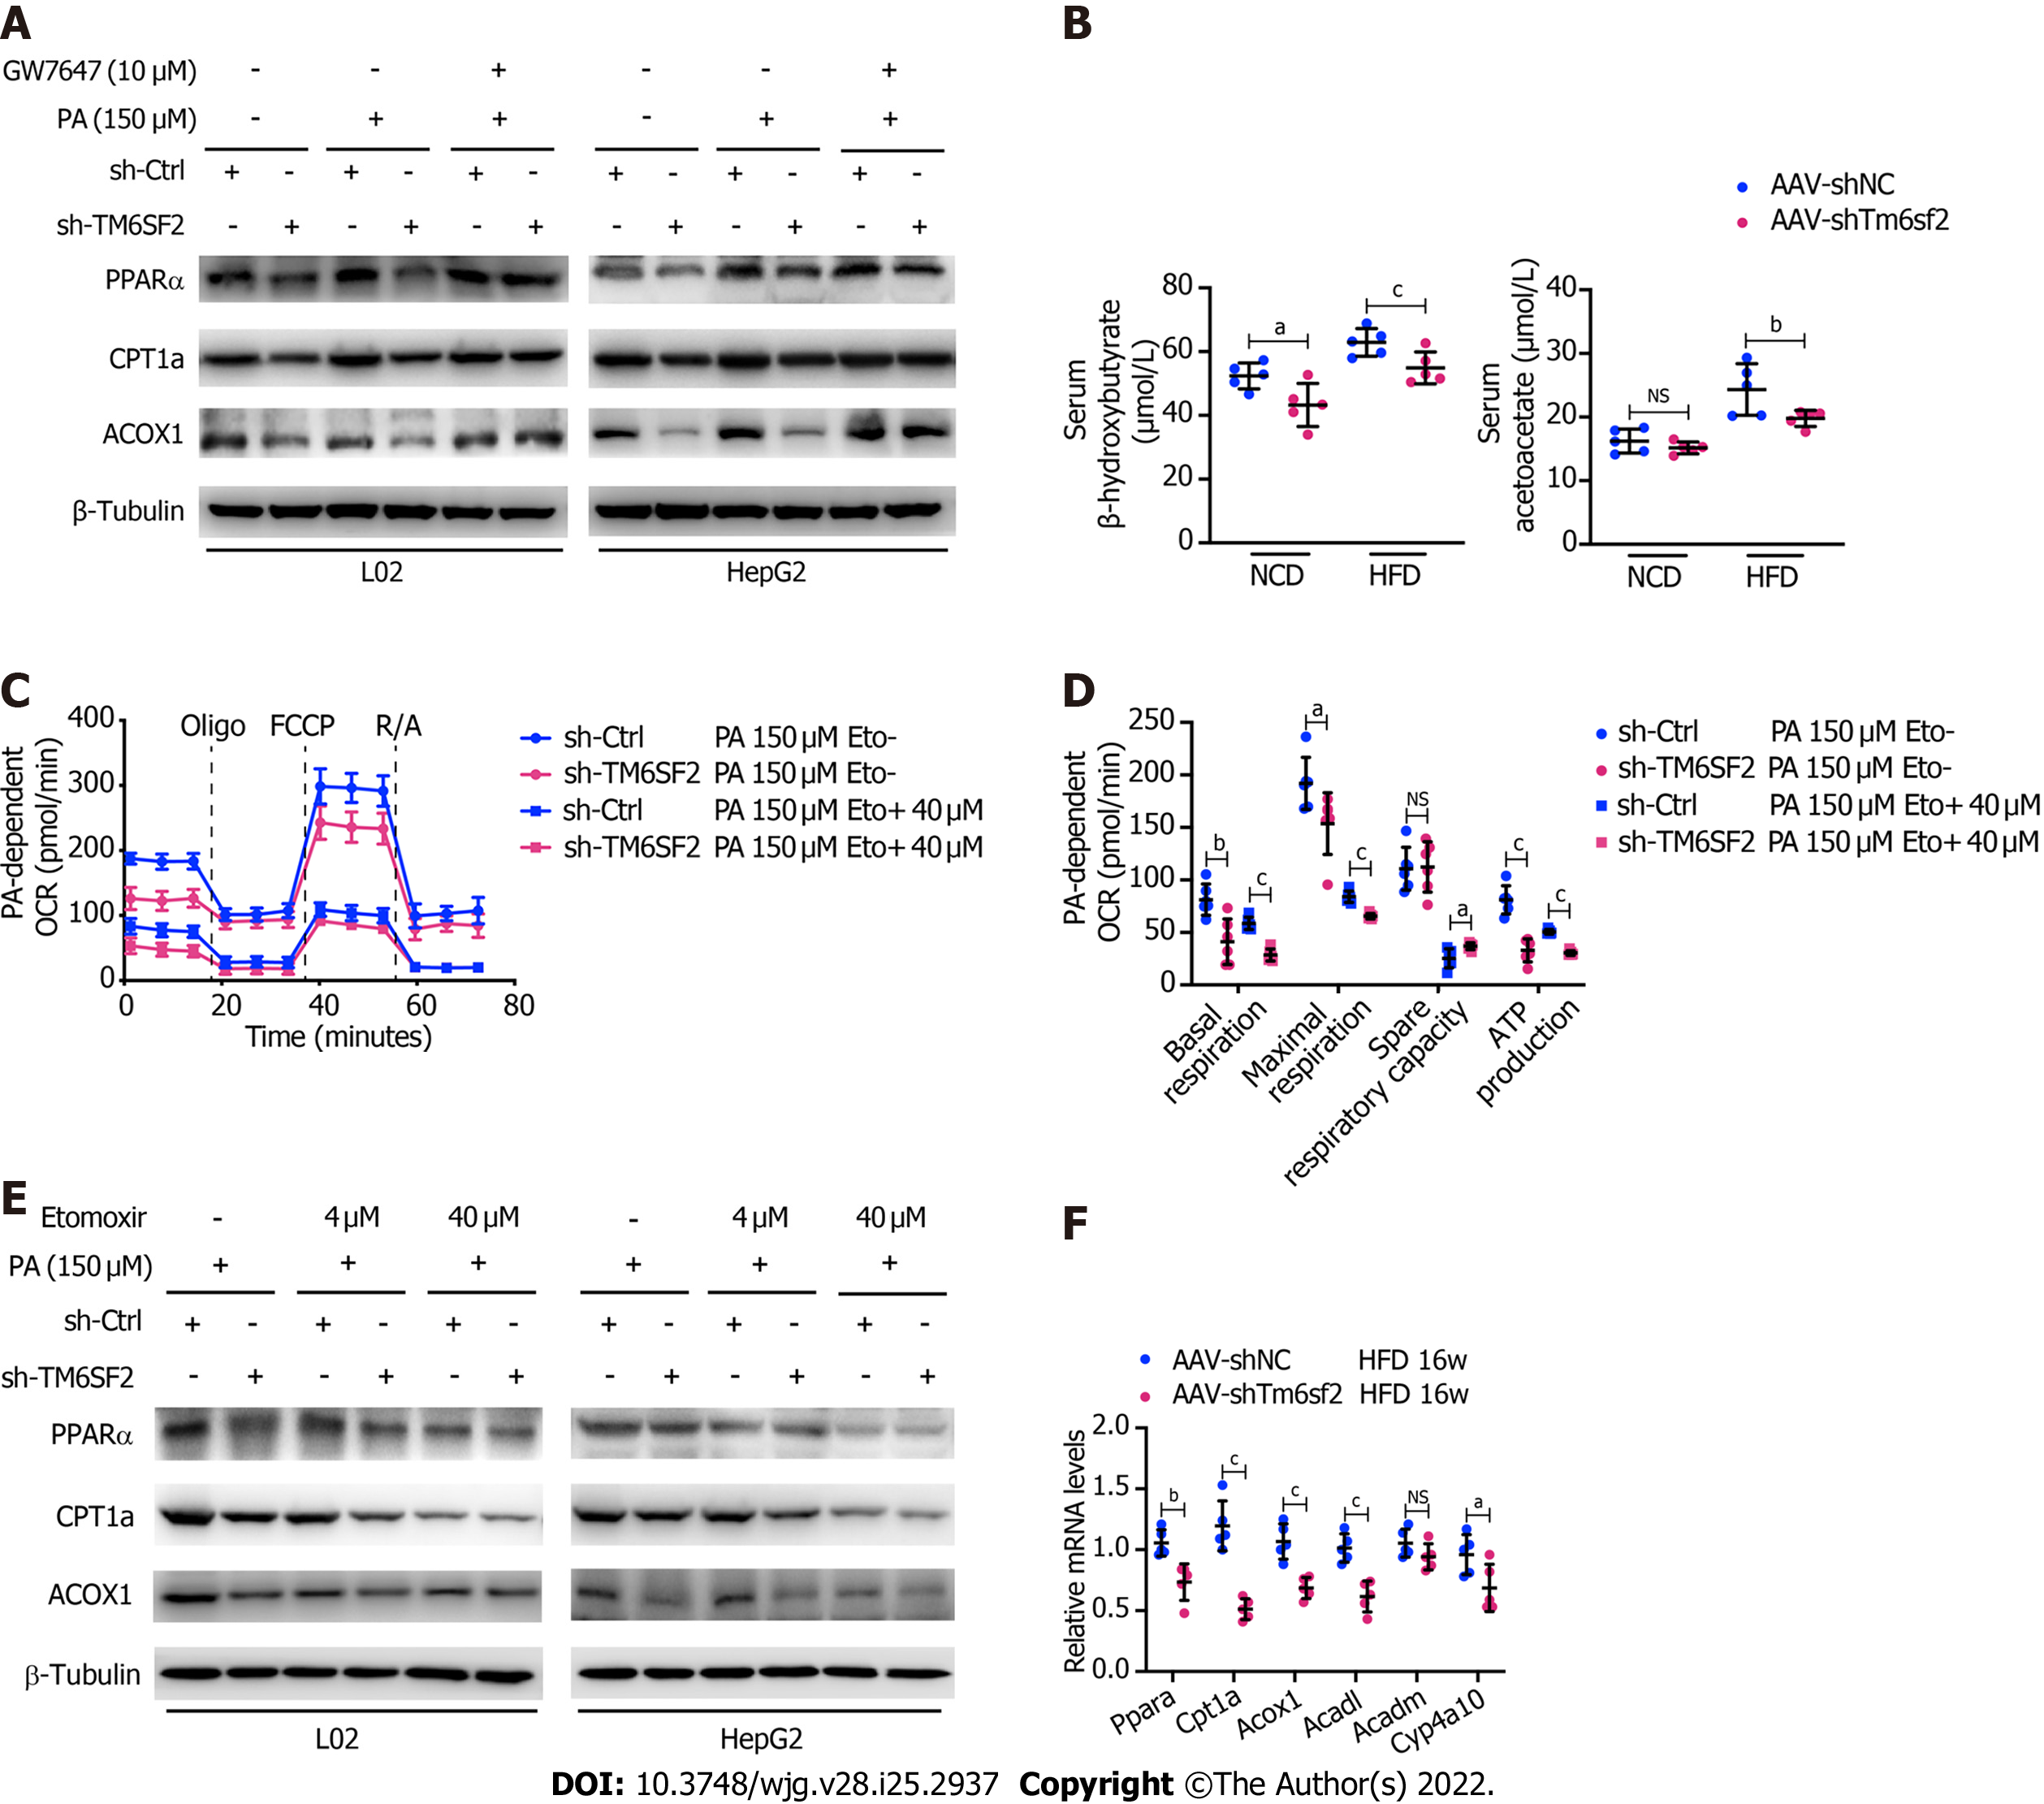
Figure 6 TM6SF2 deficiency caused the downregulation of fatty acid oxidation in liver.
A: Protein levels of PPARα, CPT1A and ACOX1 was analyzed in TM6SF2-knockdown cells after palmitic acid (PA) stimulation and their response to GW7647 (10 μmol/L) treatment; B: Serum levels of β-hydroxybutyrate and acetoacetate in normal chow diet- or high-fat diet-fed AAV-shNC or AAV-shTm6sf2 mice (n = 5 mice per group); C and D: PA-dependent oxygen consumption rate in sh-Ctrl and sh-TM6SF2 L02 cells with or without etomoxir (ETO, 40 μmol/L) administration (C, n = 6). The basal respiration, maximal respiration, spare respiratory capacity, and ATP production were calculated (D); E: Protein levels of PPARα, CPT1A and ACOX1 were determined in TM6SF2-knockdown cells with or without ETO treatment under PA (150 μmol/L) stimulation; F: The hepatic mRNA levels of fatty acid oxidation-related genes in the indicated mice. aP < 0.05; bP < 0.01; cP < 0.001. PA: Palmitic acid; NS: Not significant; NCD: Normal chow diet; HFD: High-fat diet; OCR: Oxygen consumption rate; μM: μmol/L.
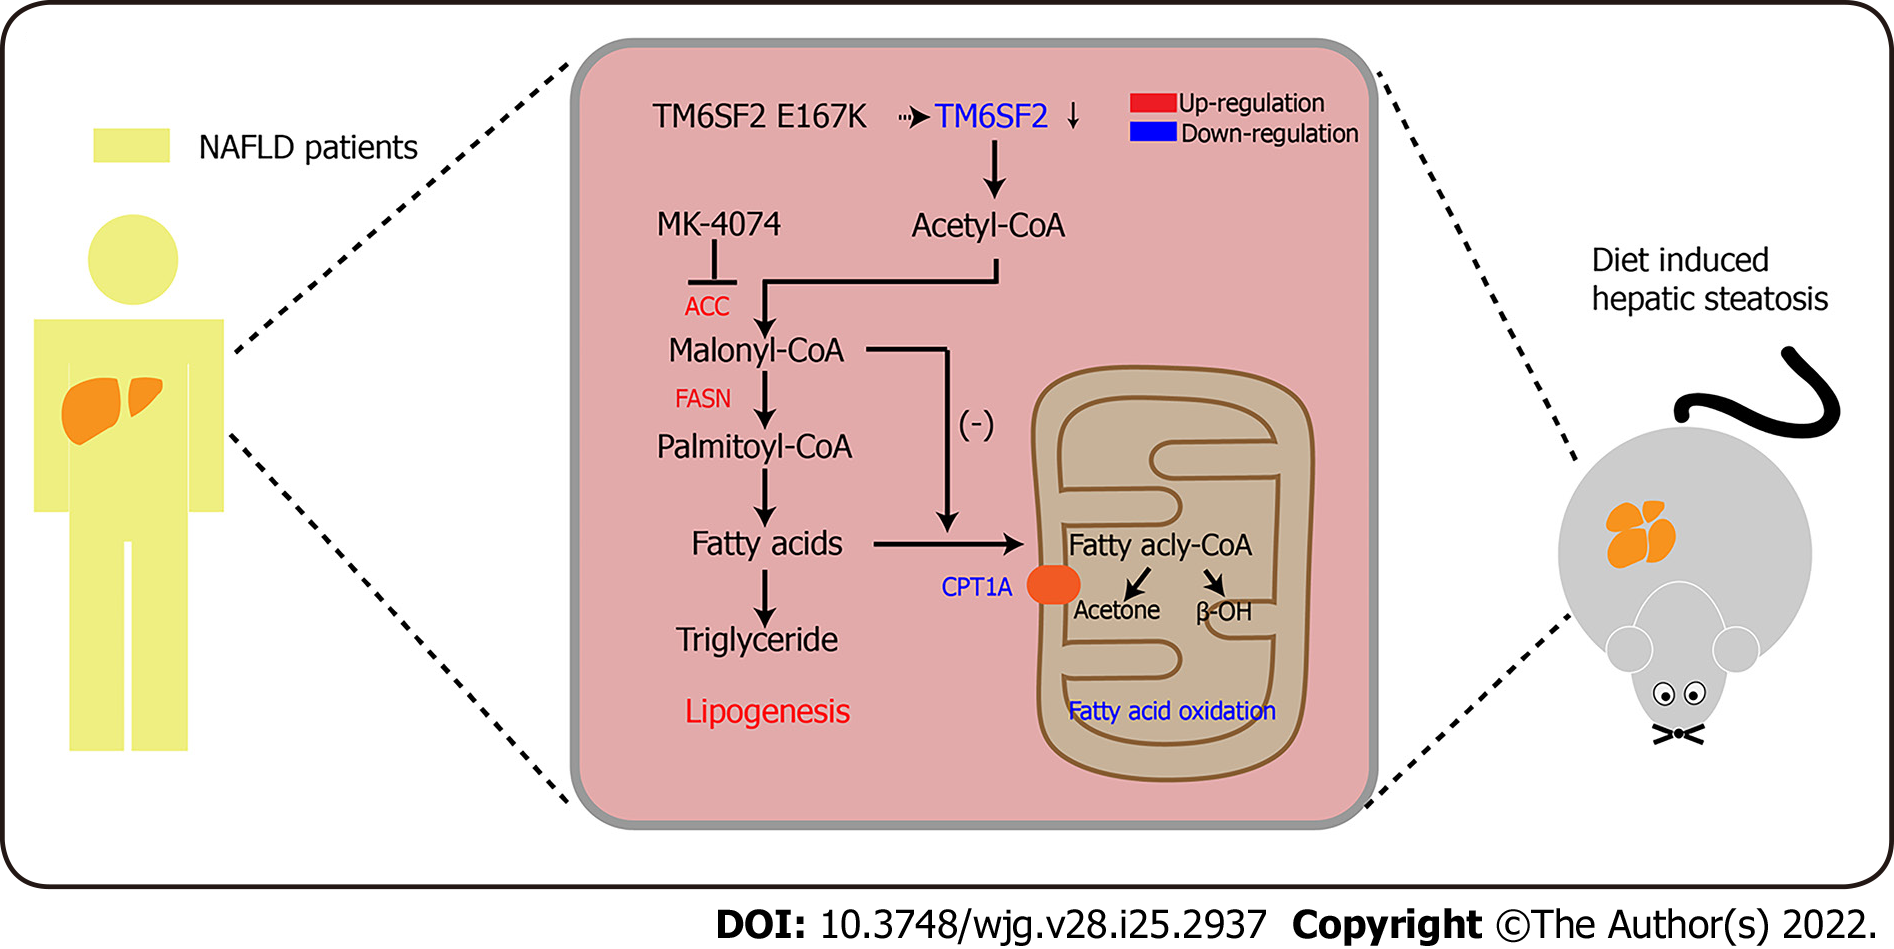
Figure 7 Schematic diagram of MK-4074 blocking acetyl-CoA carboxylase pathway and alleviating nonalcoholic fatty liver disease in TM6SF2-deficient mice.
ACC: Acetyl-CoA carboxylase; NAFLD: Nonalcoholic fatty liver disease.
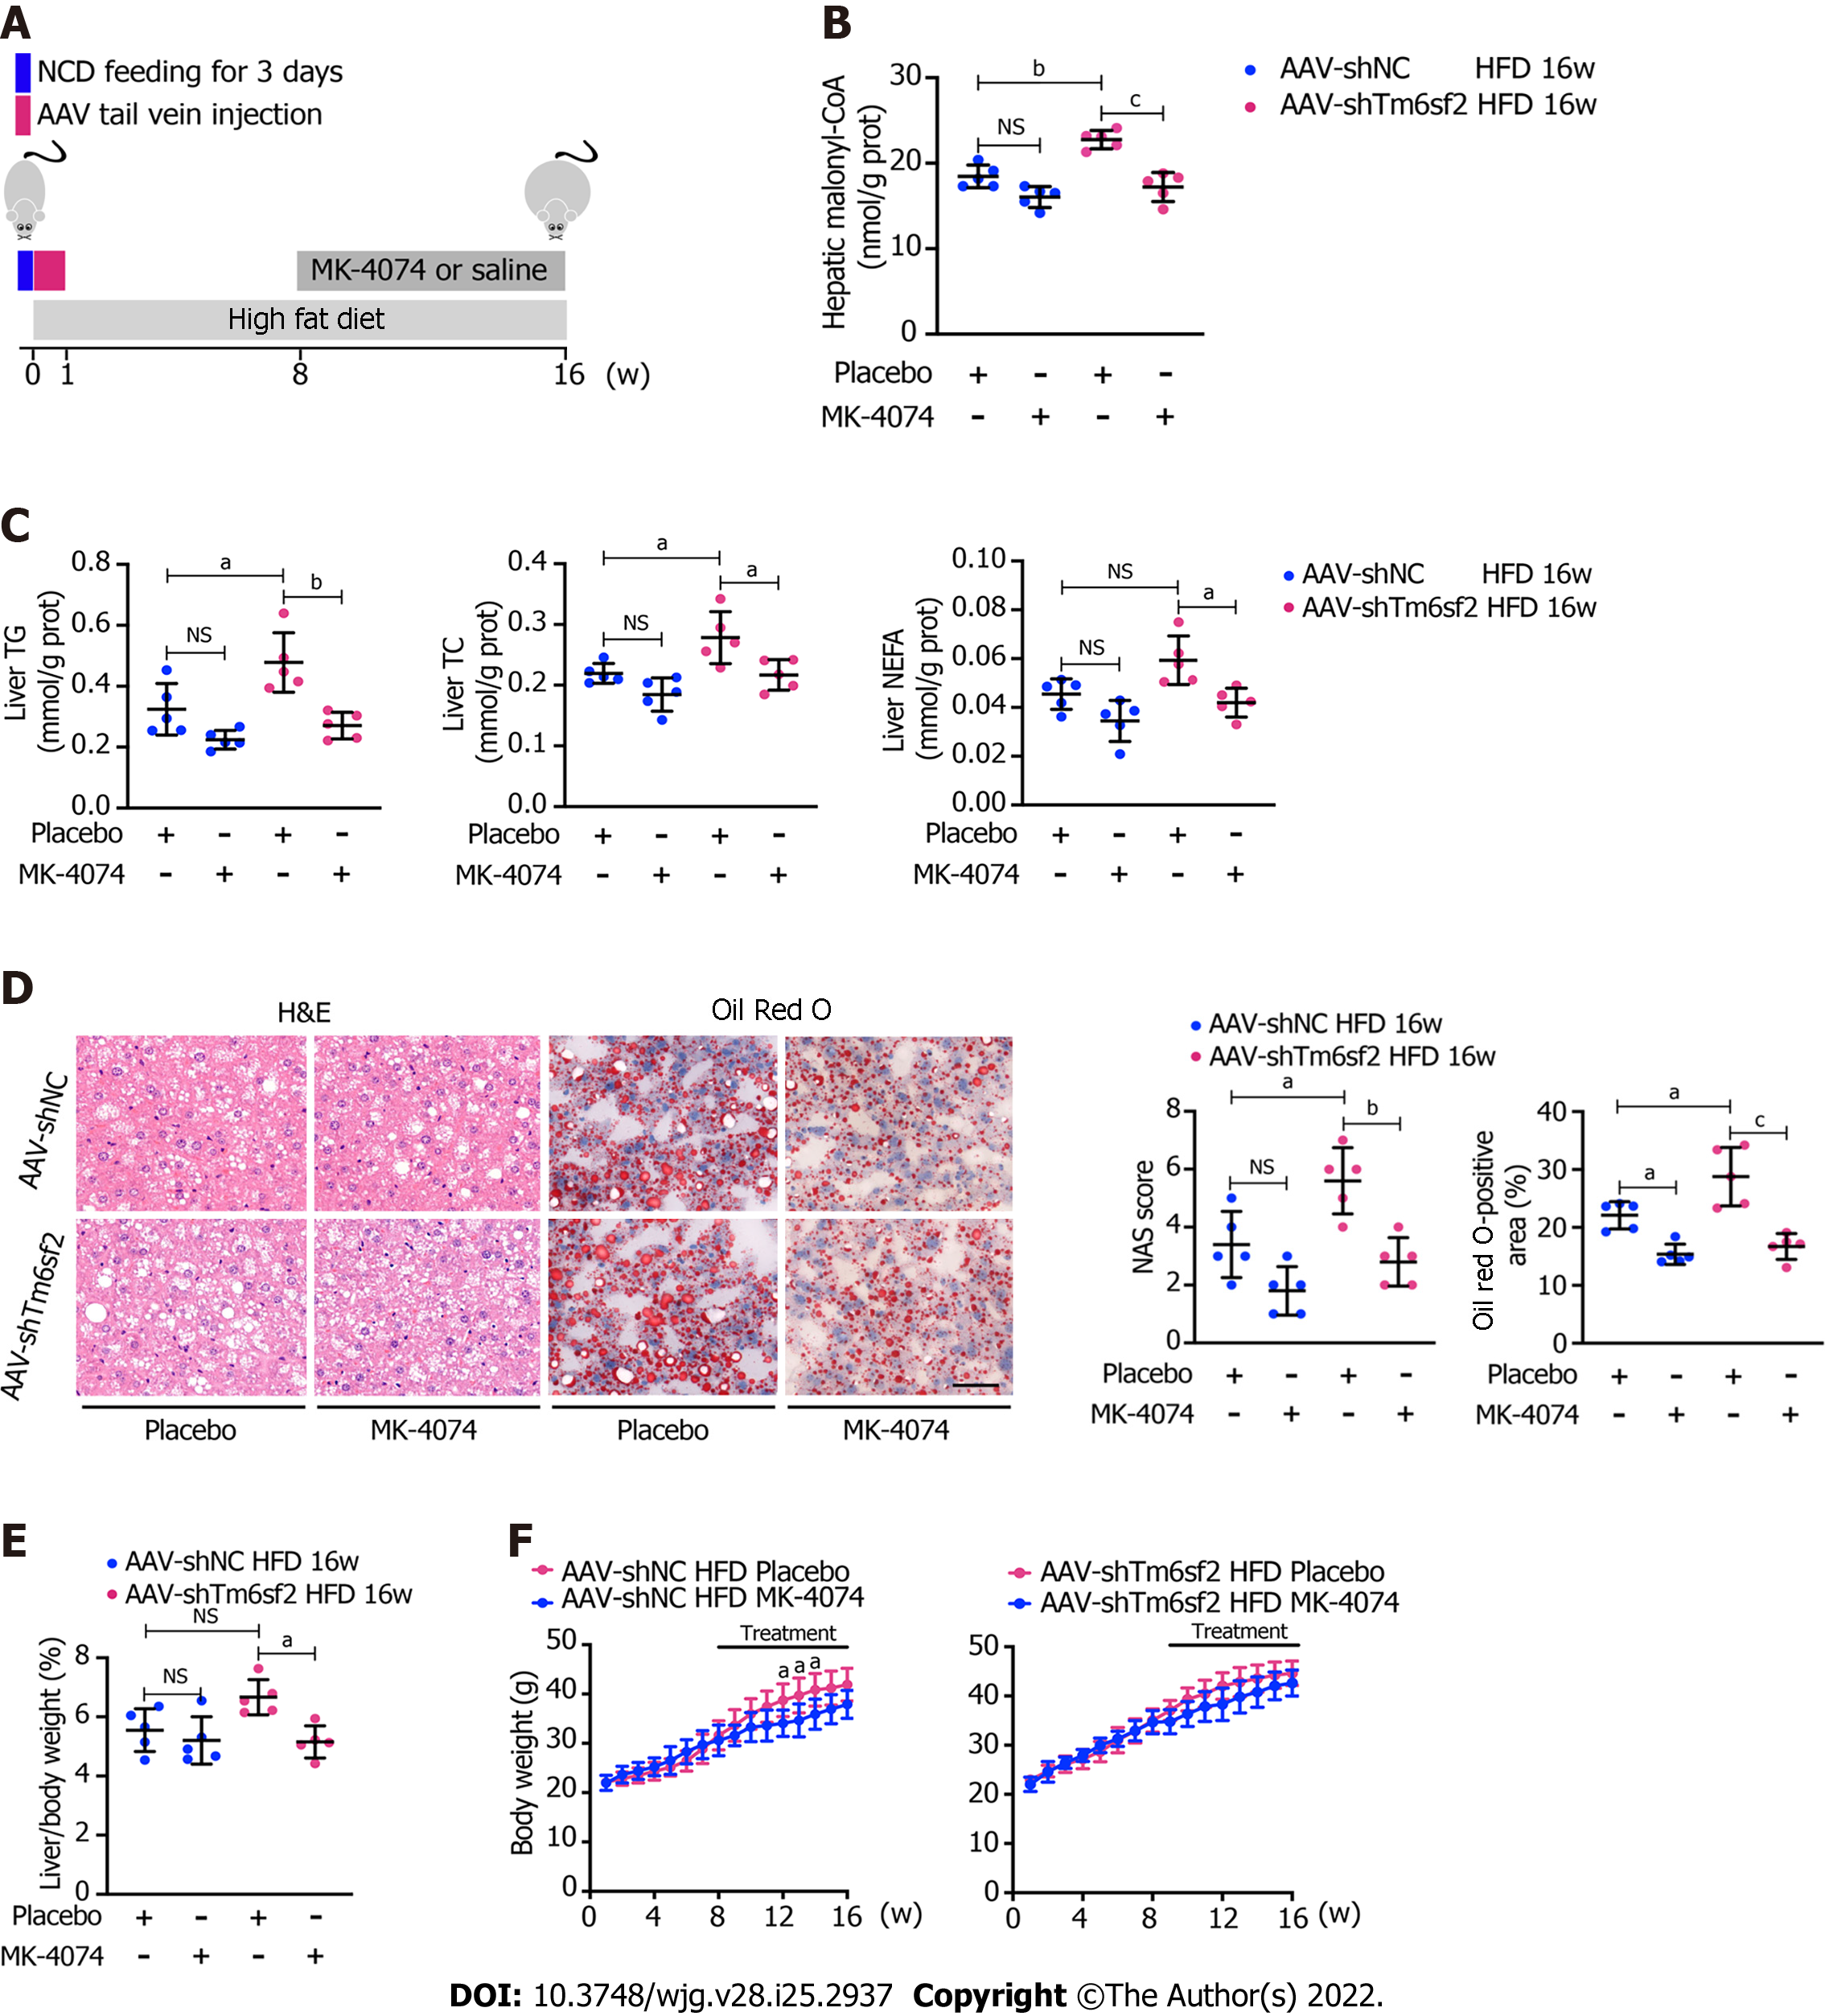
Figure 8 Therapeutic potential of MK-4074 on nonalcoholic fatty liver disease caused by TM6SF2 deficiency.
A: Schematic representation of animal experiments; B-D: Two groups (AAV-shNC and AAV-shTm6sf2) of mice were fed a high-fat diet (HFD) for 8 wk to induce nonalcoholic fatty liver disease phenotypes and then each subgroup was dosed with MK-4074 (10 mg/kg/day) or placebo orally for additional 8 wk. The hepatic malonyl-CoA levels (B) and lipid content (C) as well as results of hematoxylin and eosin-staining and Oil Red O-staining of liver sections (D) were shown; E and F: The liver/body weight ratio (E) and the body weight (F) of HFD-fed AAV-shNC and AAV-shTm6sf2 mice with or without MK-4074 treatment (n = 5 mice per group) were shown. aP < 0.05; bP < 0.01; cP < 0.001. NS: Not significant; H&E: Hematoxylin and eosin; NCD: Normal chow diet; HFD: High-fat diet; TG: Triglyceride; TC: Total cholesterol; NEFA: Non-esterified fatty acids.
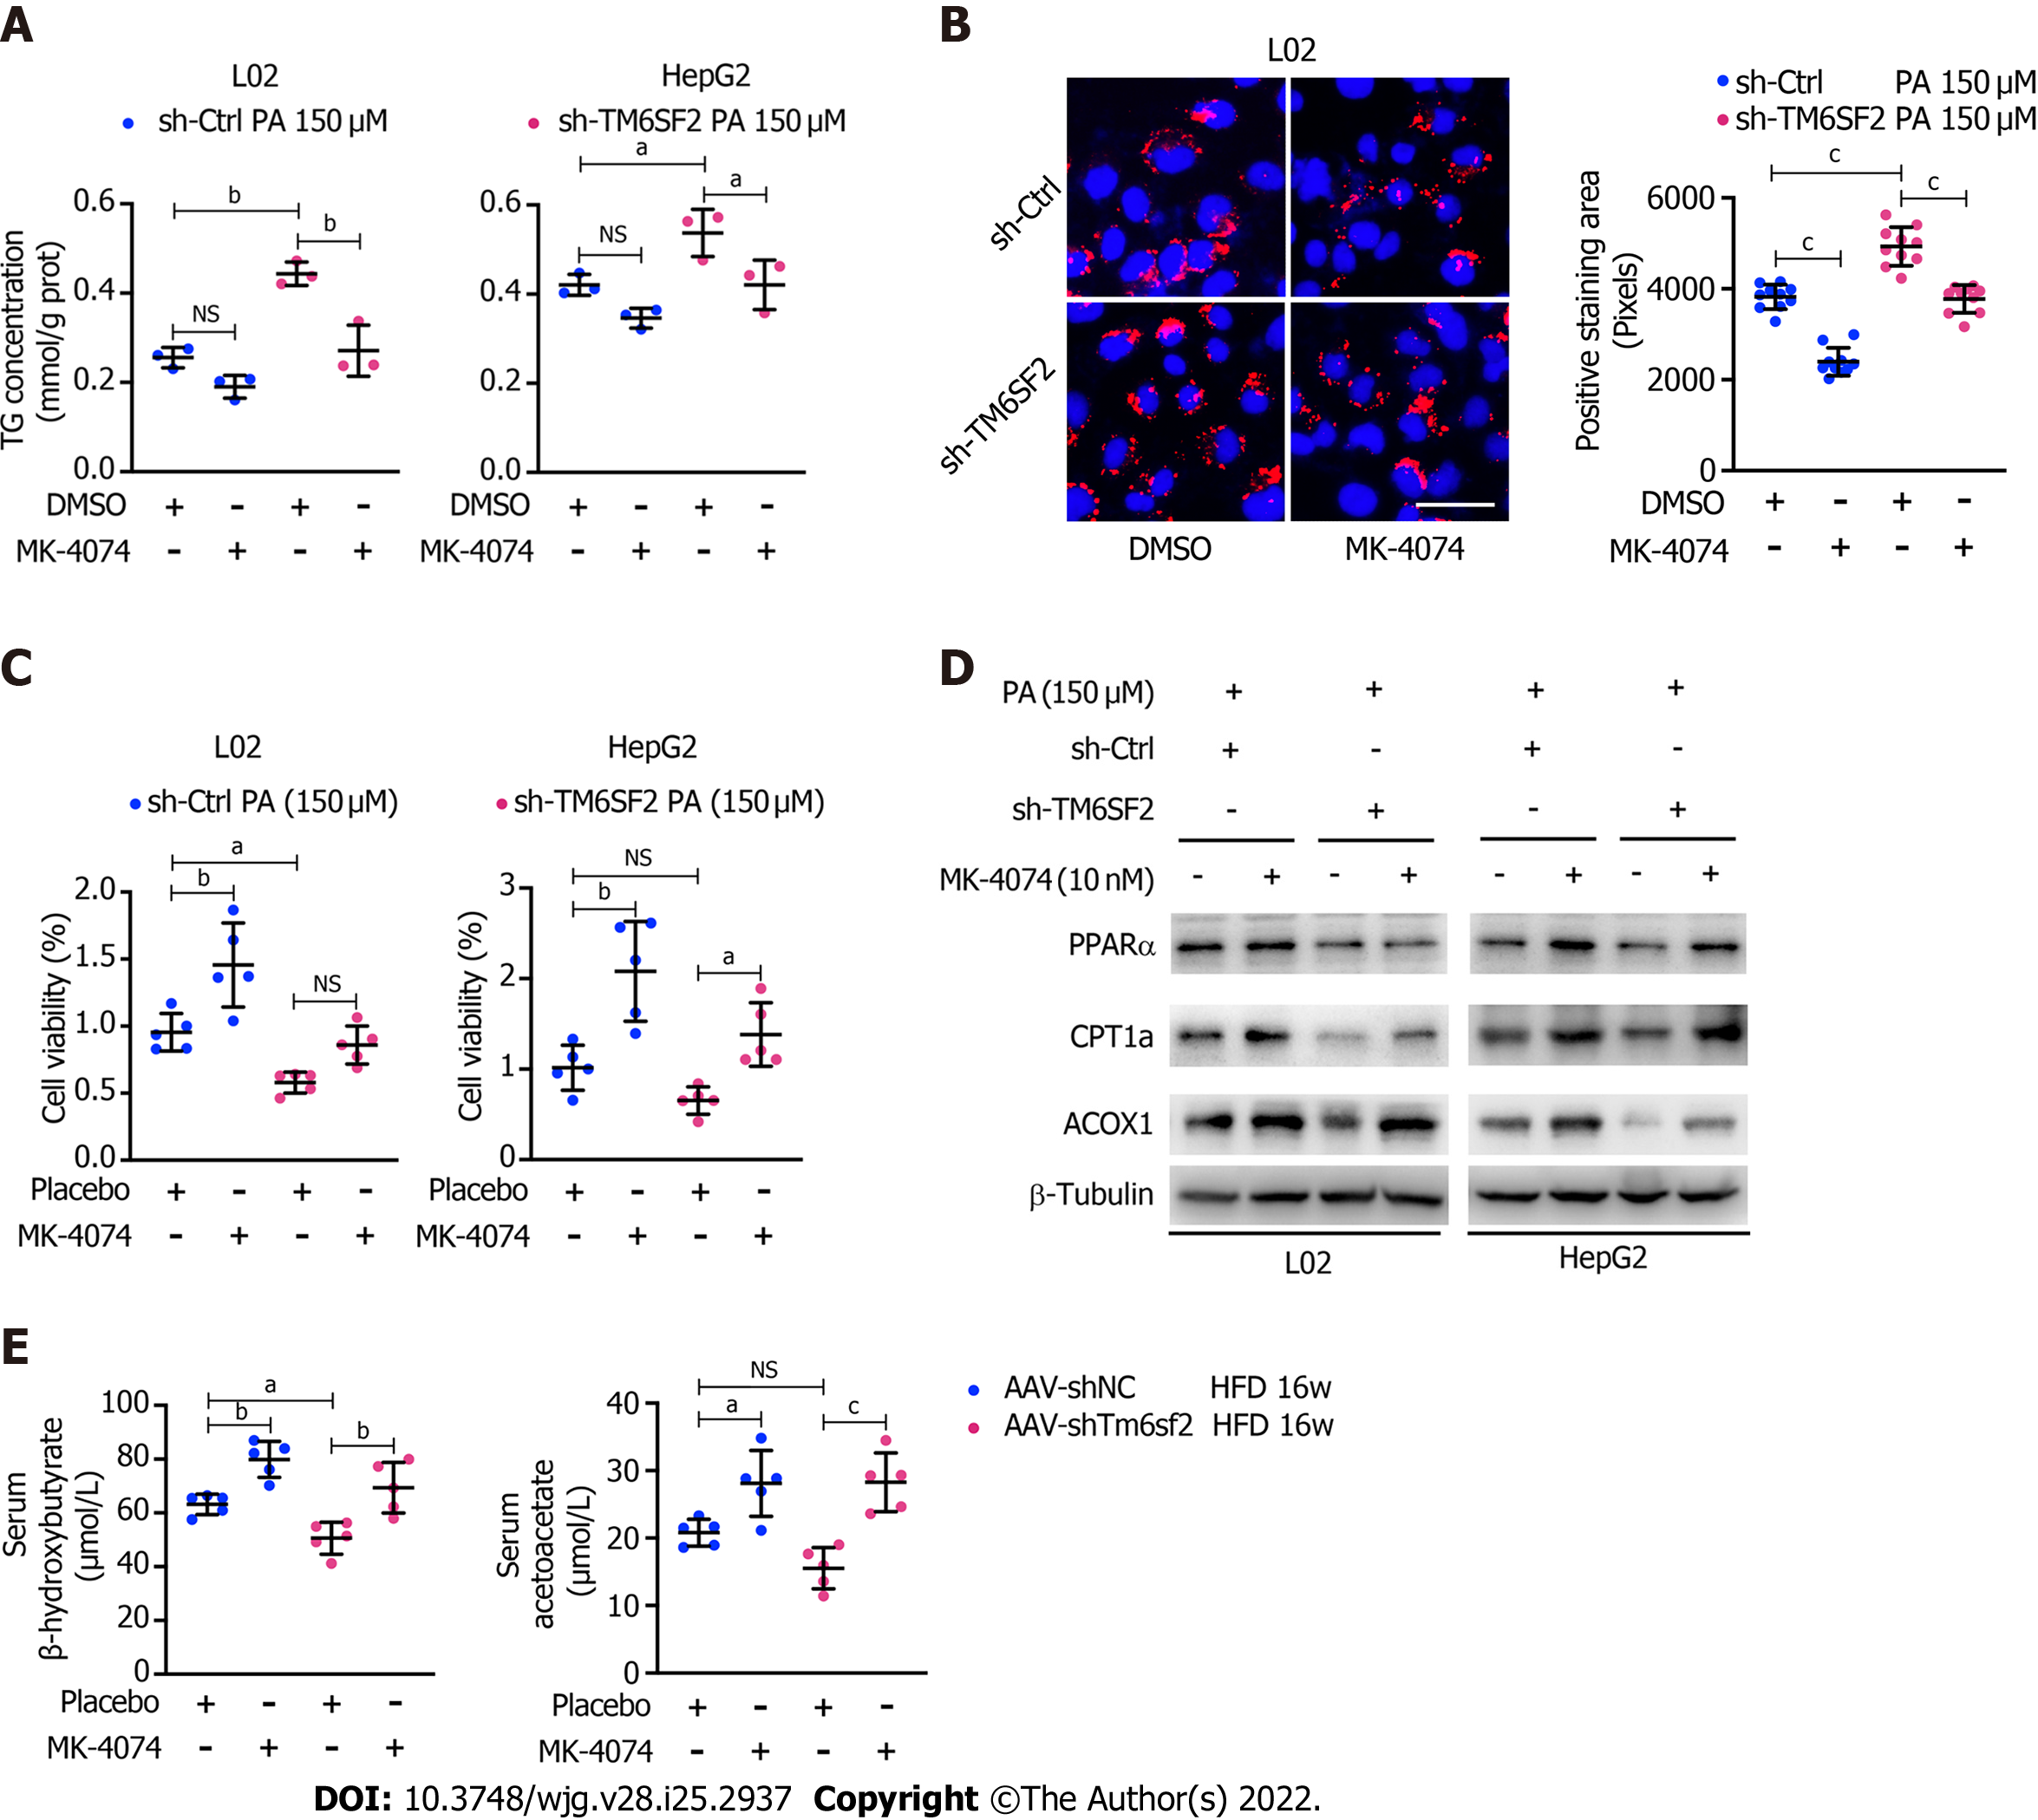
Figure 9 MK-4074 can improve intracellular lipid accumulation, lipid overload-induced cell death, and fatty acids β-oxidation.
A: Intracellular triglyceride levels (n = 3) in TM6SF2-knockdown cells with palmitic acid (PA) (150 μmol/L) stimulation were examined after MK-4074 (10 nM) treatment for 24 h; B: Representative nile red staining images (left) and lipid droplet quantification (right) of sh-Ctrl or sh-TM6SF2 L02 cells after PA stimulation in response to MK-4074 (10 nM) treatment (10 fields of each sample were examined). Scale bars: 50 μm; C: The cellular viability was examined in TM6SF2-knockdown cells with or without MK-4074 treatment in response to PA-induced cell death (n = 5); D: The sh-Ctrl and sh-TM6SF2 cells were cultured with PA (150 μmol/L) for 24 h. Cells were then treated with MK-4074 (10 nM) for 12 h. The expression of fatty acid oxidation-related proteins was determined; E: Serum levels of β-hydroxybutyrate and acetoacetate in the indicated mice with or without MK-4074 treatment. aP < 0.05; bP < 0.01; cP < 0.001. NS: Not significant; HFD: High-fat diet; TG: Triglyceride; PA: Palmitic acid; μM: μmol/L.
- Citation: Li ZY, Wu G, Qiu C, Zhou ZJ, Wang YP, Song GH, Xiao C, Zhang X, Deng GL, Wang RT, Yang YL, Wang XL. Mechanism and therapeutic strategy of hepatic TM6SF2-deficient non-alcoholic fatty liver diseases via in vivo and in vitro experiments. World J Gastroenterol 2022; 28(25): 2937-2954
- URL: https://www.wjgnet.com/1007-9327/full/v28/i25/2937.htm
- DOI: https://dx.doi.org/10.3748/wjg.v28.i25.2937


