Copyright
©The Author(s) 2022.
World J Gastroenterol. Jan 14, 2022; 28(2): 242-262
Published online Jan 14, 2022. doi: 10.3748/wjg.v28.i2.242
Published online Jan 14, 2022. doi: 10.3748/wjg.v28.i2.242
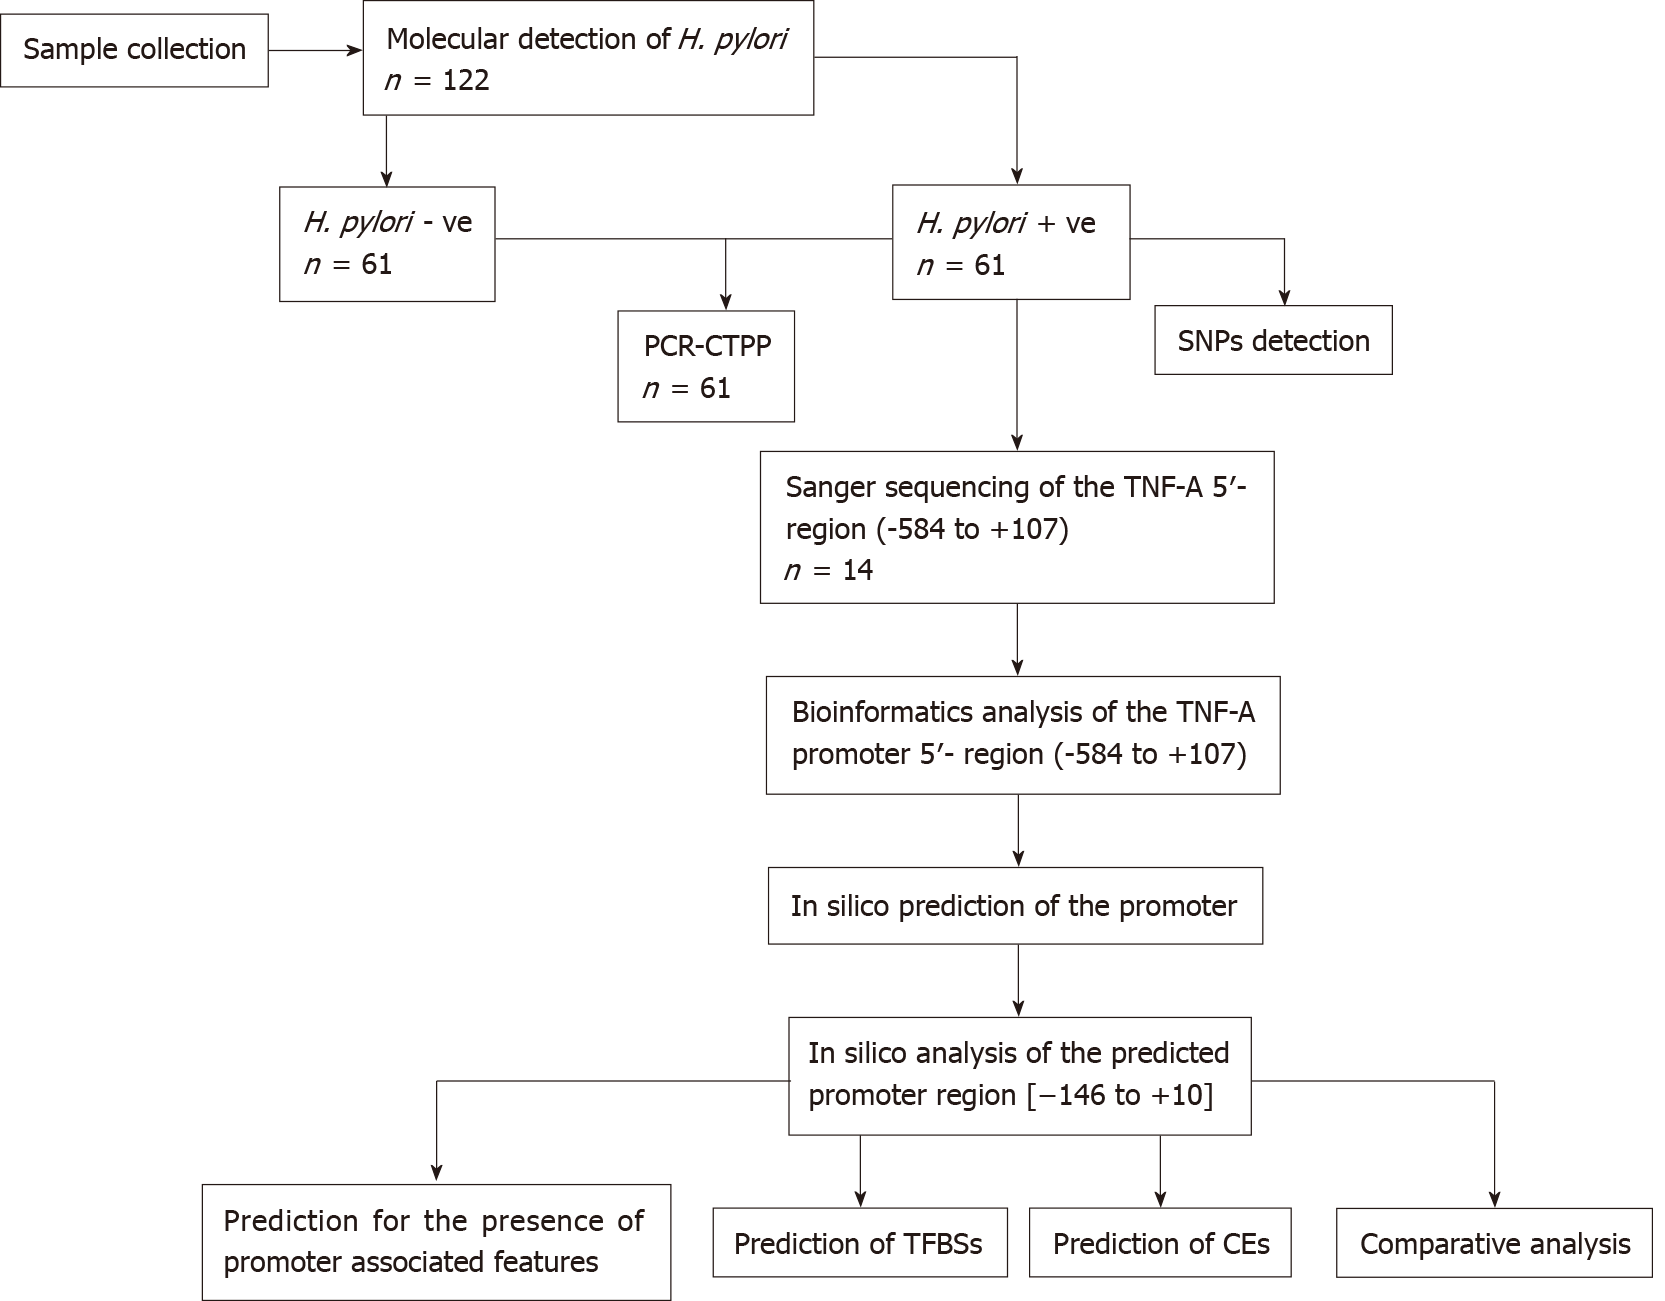
Figure 1 Schematic representation of the study methodology.
H. pylori: Helicobacter pylori; -ve: Negative; +ve: Positive; CTPP: Confronting two-pair primer; SNP: Single nucleotide polymorphism; TNF-A: Tumor necrosis factor-alpha; TFBS: Transcription factor binding site; CE: Composite regulatory elements.
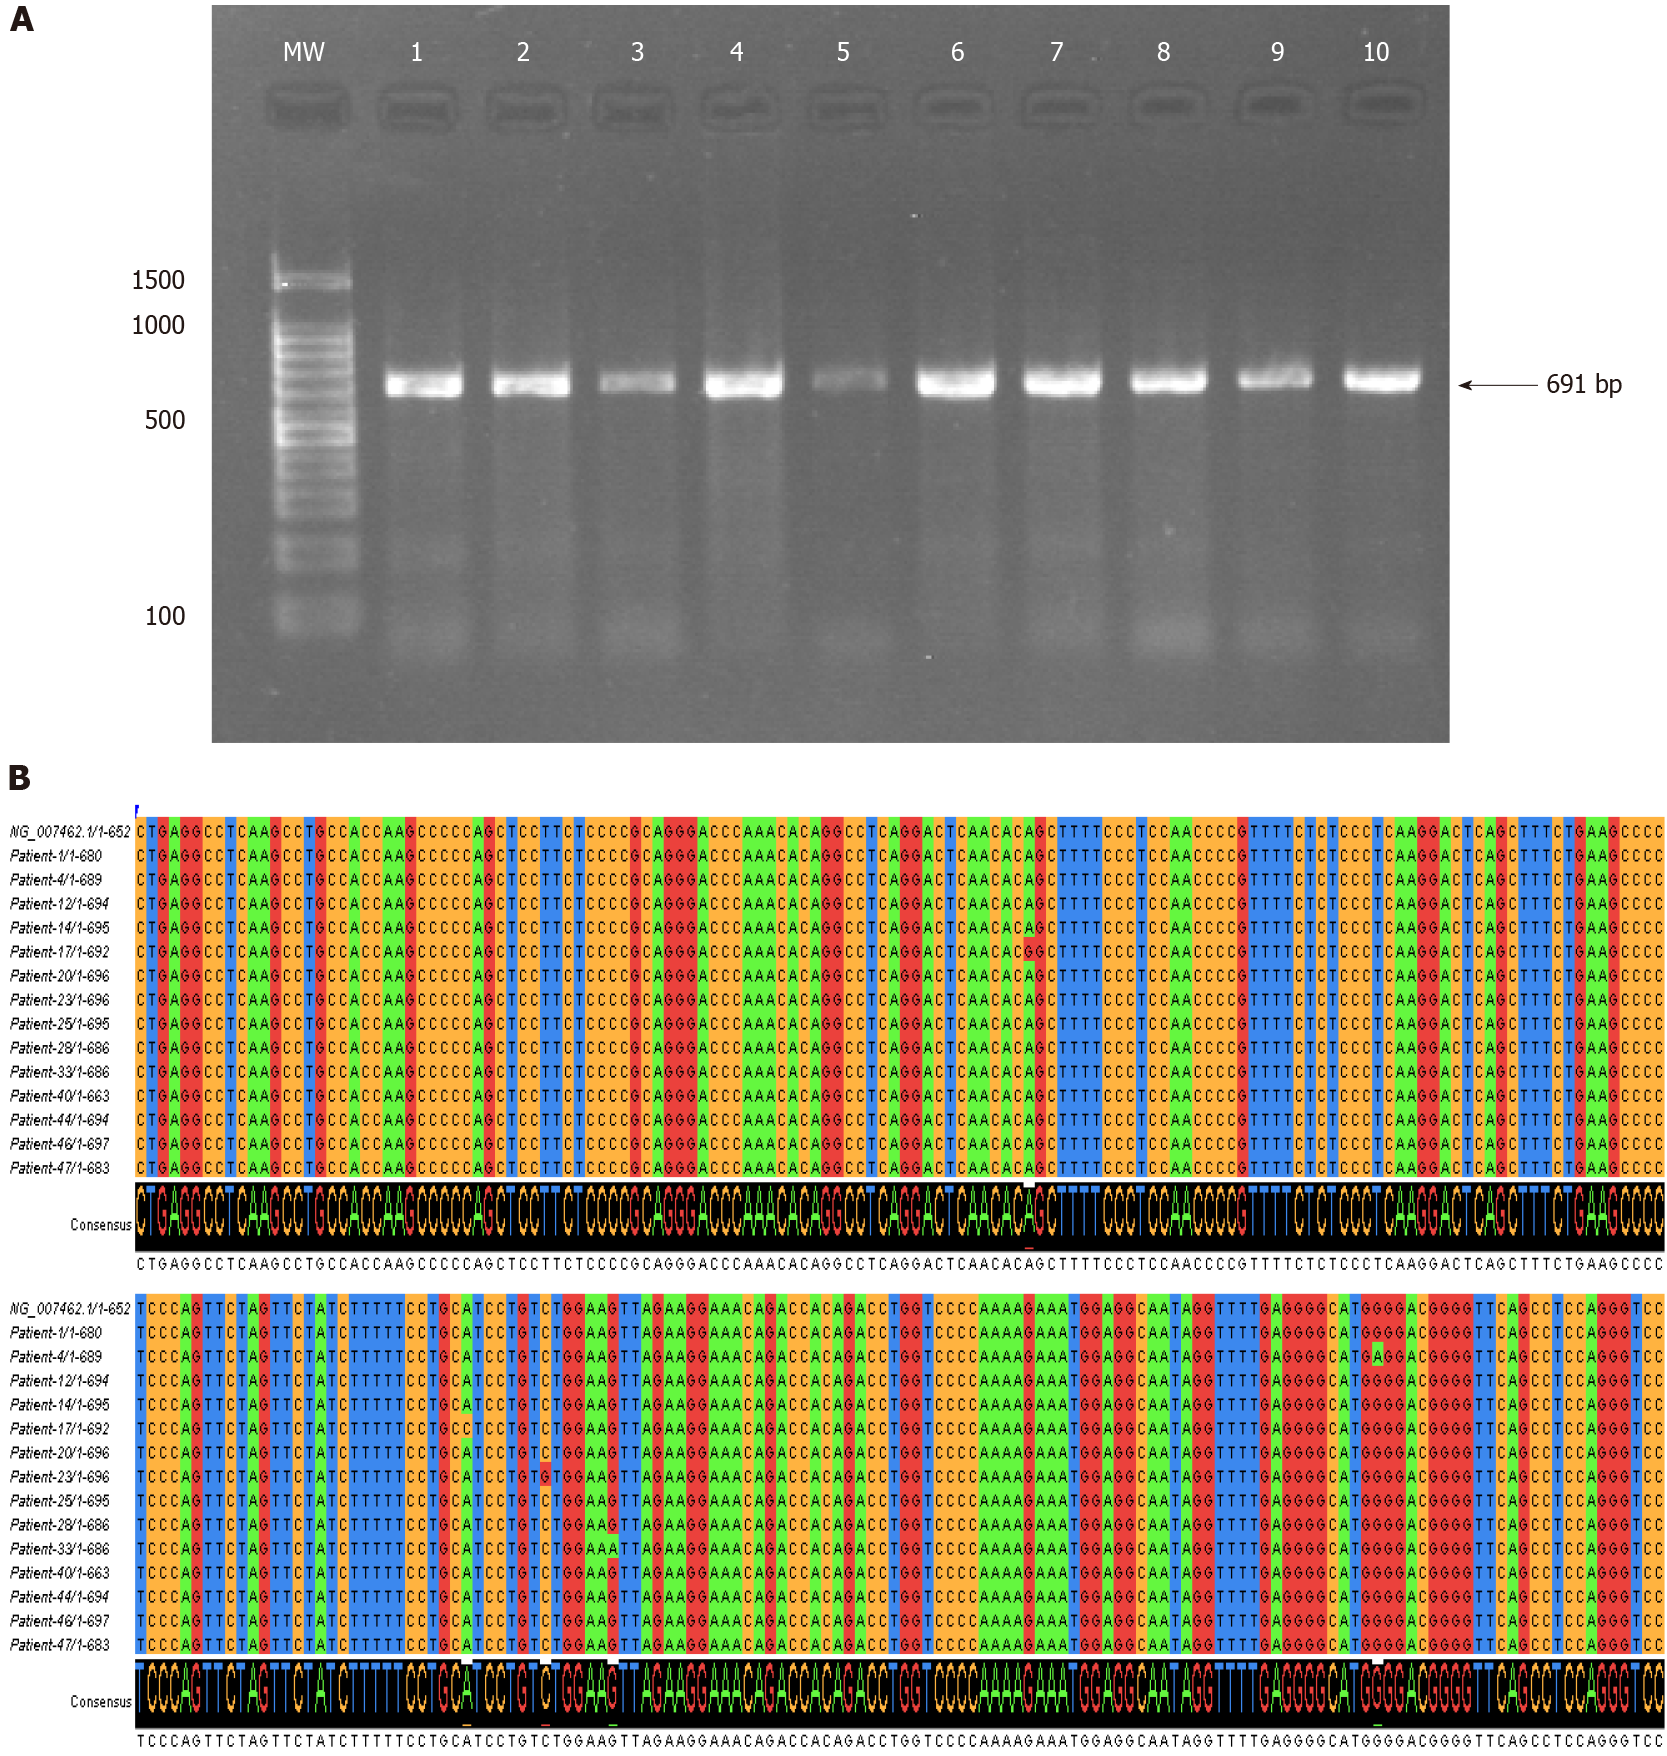
Figure 2 Nucleotide variations of the tumor necrosis factor-alpha 5’-region (-584 to +107) in the Sudanese Helicobacter pylori-infected patients.
A: PCR amplification results of the tumor necrosis factor-alpha 5’-region (-584 to +107) examined on 1% agarose gel electrophoresis; B: Multiple sequence alignment of the nucleotide sequences of the tumor necrosis factor-alpha 5’-region performed in Clustal W and visualized in Jalview[55]. The levels of identity are visible as histograms at the bottom.
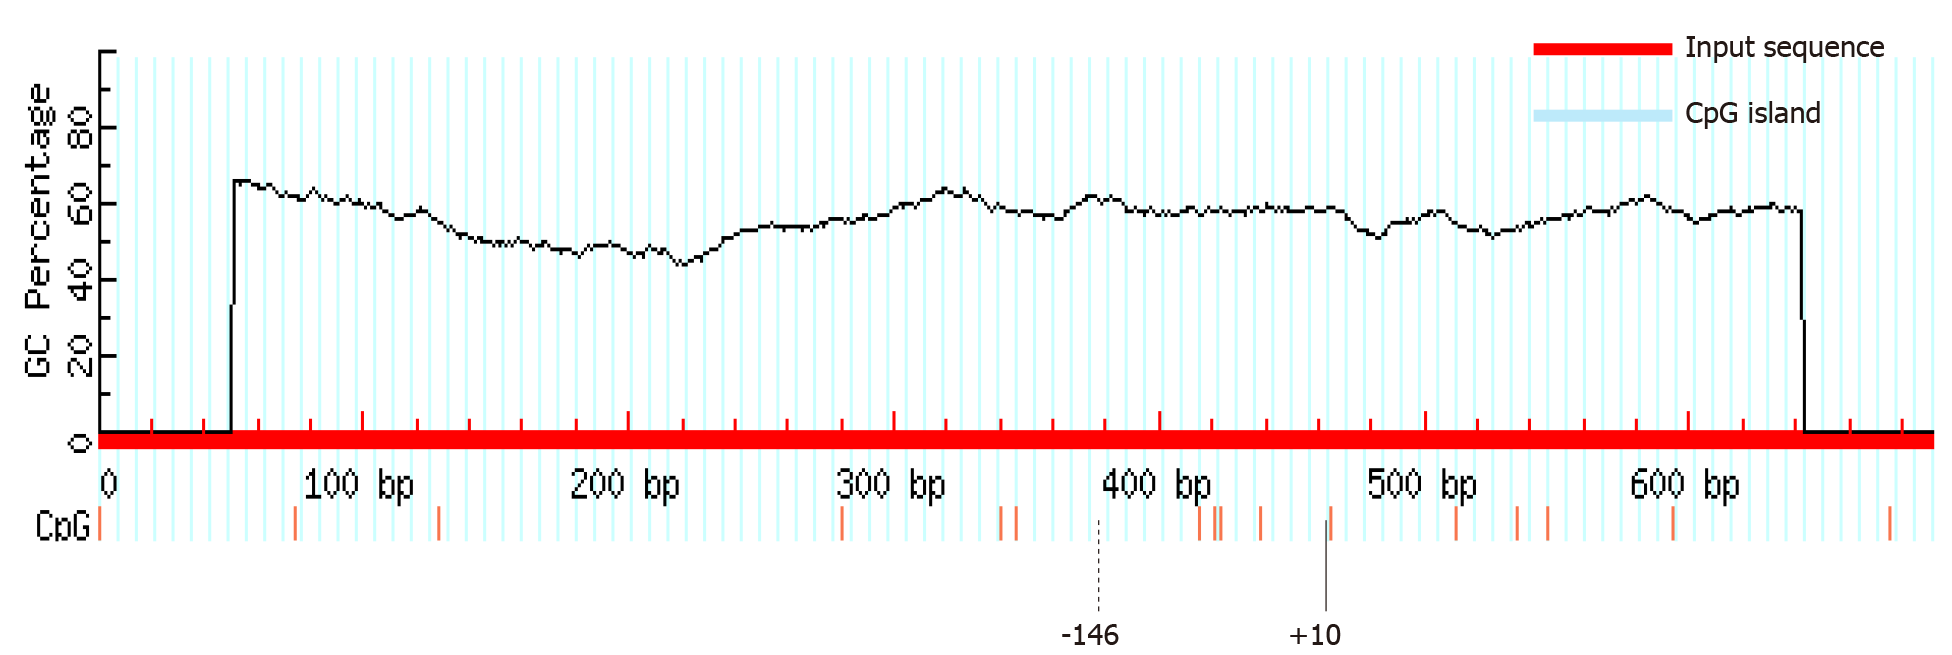
Figure 3 MethPrimer software prediction of no CpG islands in the in silico predicted promoter region.
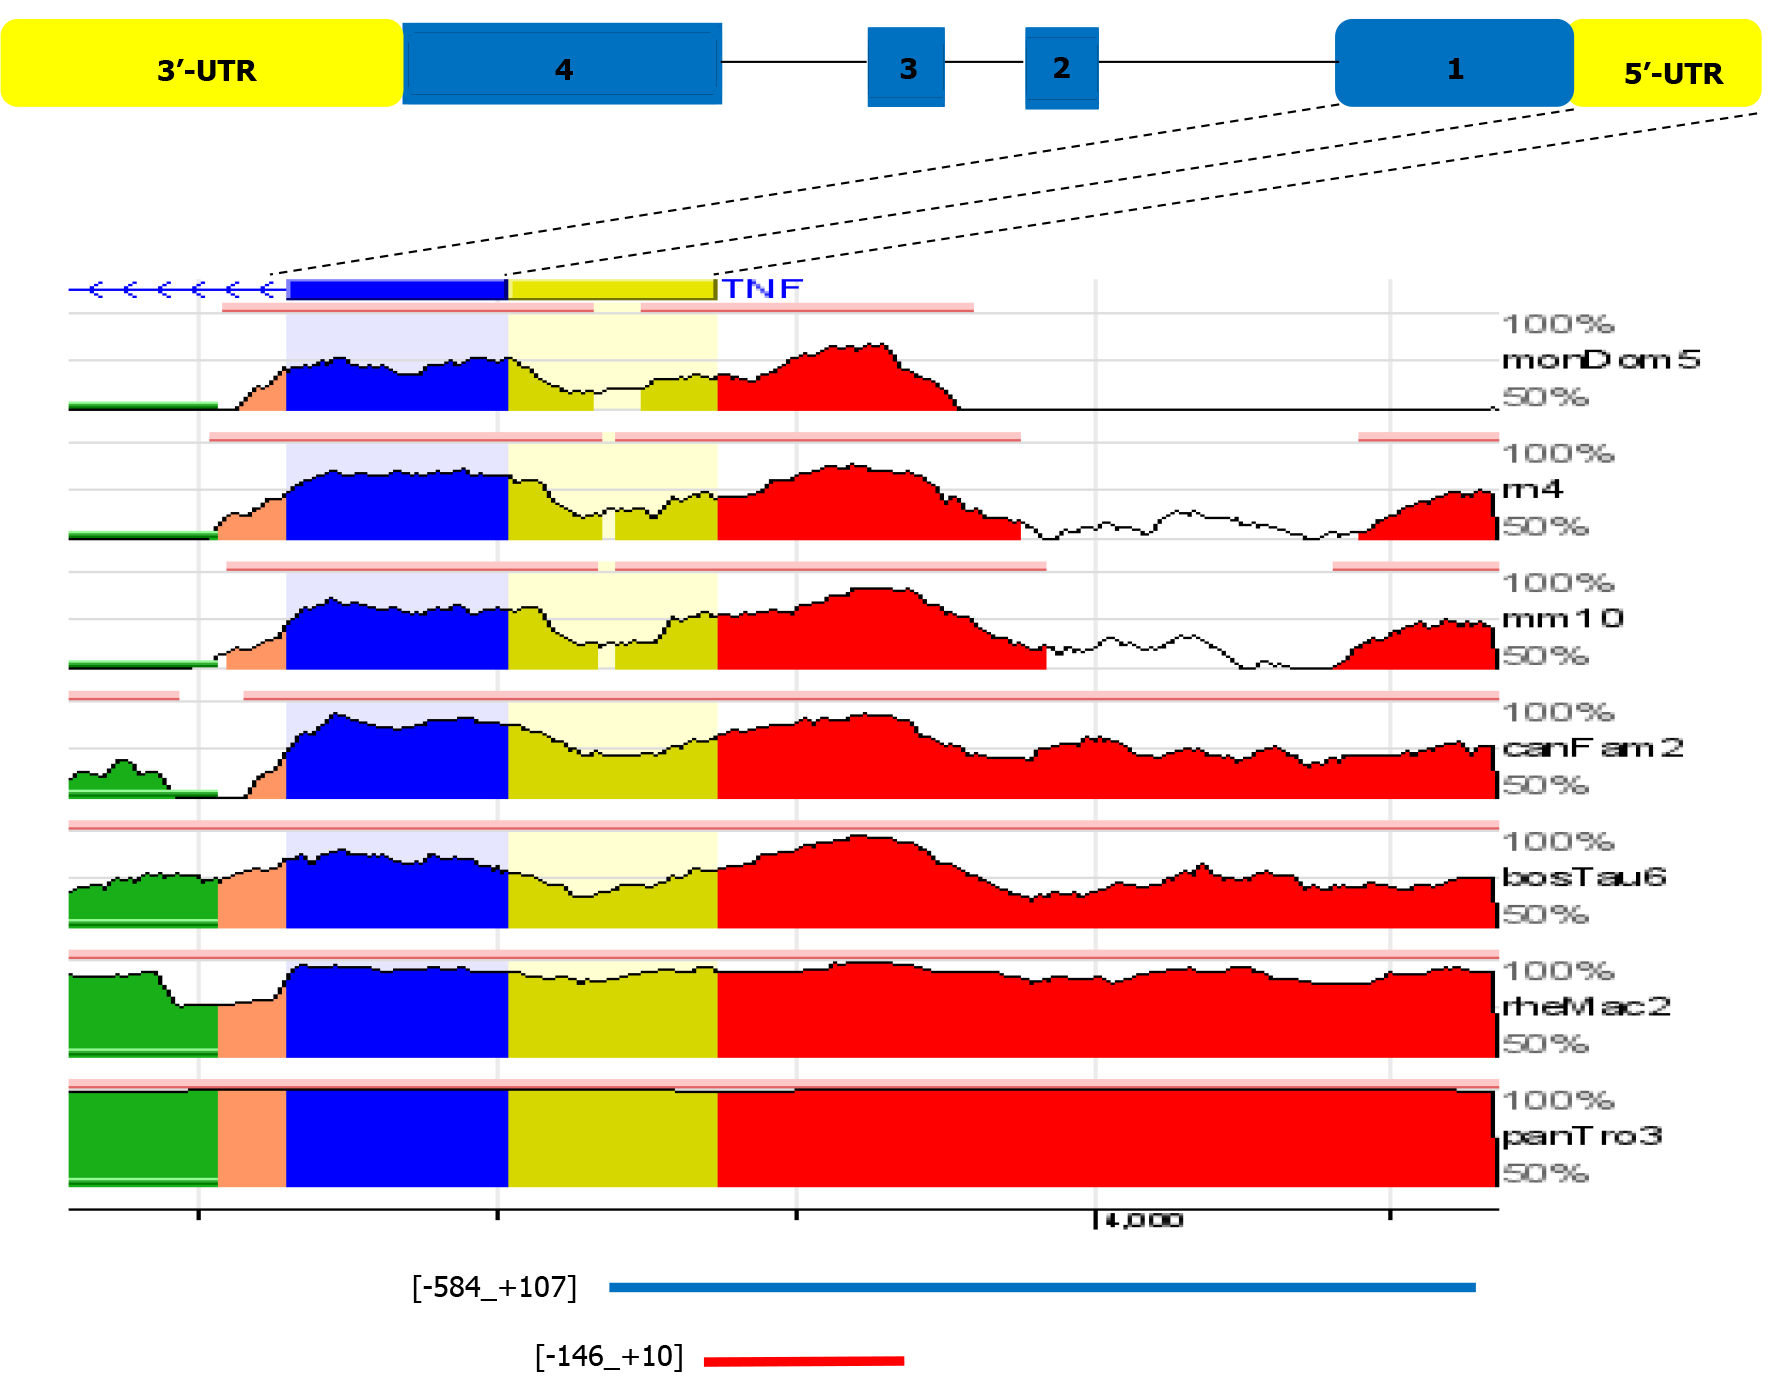
Figure 4 Overview from the ECR Browser shows mammalian conservation of the tumor necrosis factor 5’-upstream region compared to the human sequence in the region (-584 to +107) (hg19 chr6:31542751-31543444).
Blue boxes represent the first tumor necrosis factor exon, while yellow indicates the tumor necrosis factor 5’ untranslated region. Intragenic positions are highlighted in red or in green when corresponding to transposable elements and simple repeats. UTR: Untranslated region.
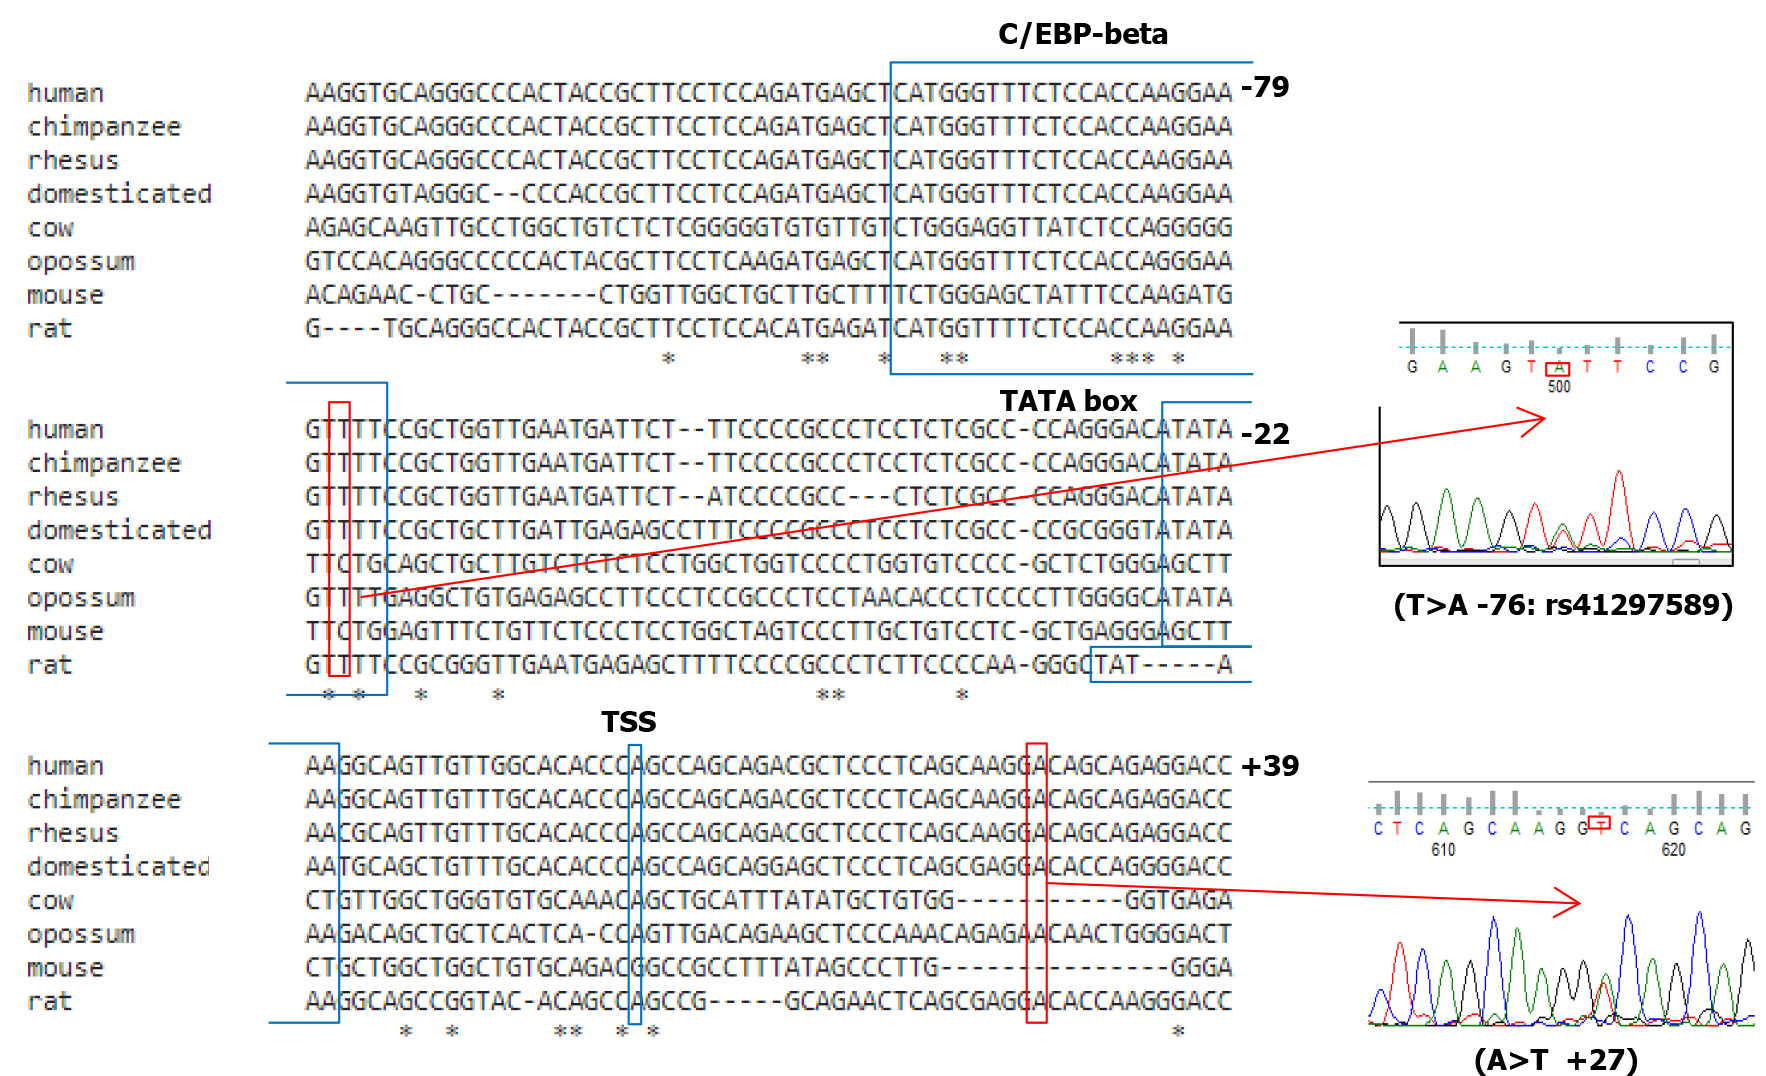
Figure 5 Mammalian conservation of (AT; single nucleotide polymorphism databases dbSNP: rs41297589) at position -76 and the novel mutation (A>T at +27) in the 5’ untranslated region among various species.
The nucleotides are enumerated at each line on the right side, and the in silico predicted TATA-, C/EBP-beta and transcription start site have marked inboxes. The chromatogram results of the polymorphisms are visualized using Finch TV software. TSS: Transcription start site.
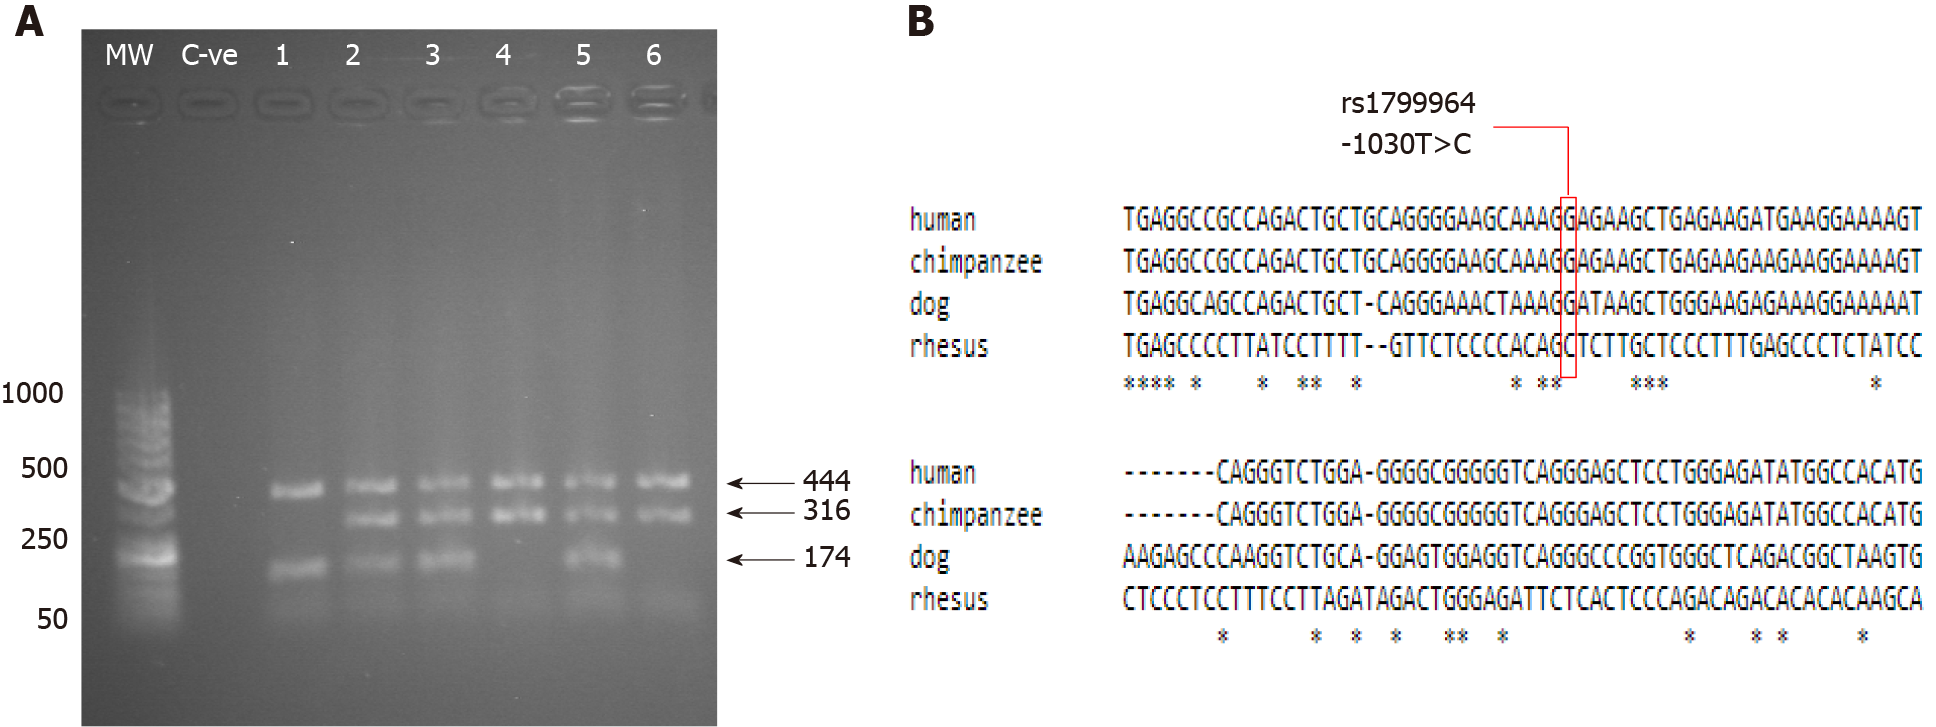
Figure 6 Molecular detection of the tumor necrosis factor-alpha-1030 C/T polymorphism.
A: PCR with confronting two-pair primer products analyzed on a 1% agarose gel stained with ethidium bromide. Three genotypes can be seen. Lanes 2, 3 and 5 showed 444 bp, 316 bp and 174 bp, indicating a heterozygous genotype. Lanes 4 and 6 showed 444 bp and 316 bp, which indicated a homozygous T genotype. Lane 1 showed 444 bp and 174 bp, which indicated a homozygous C genotype; B: Mammalian conservation of (TC; dbSNP: rs1799964) position -1030 among different species. MW: Molecular weight marker; C-ve: Negative control.
- Citation: Idris AB, Idris AB, Gumaa MA, Idris MB, Elgoraish A, Mansour M, Allam D, Arbab BM, Beirag N, Ibrahim EAM, Hassan MA. Identification of functional tumor necrosis factor-alpha promoter variants associated with Helicobacter pylori infection in the Sudanese population: Computational approach. World J Gastroenterol 2022; 28(2): 242-262
- URL: https://www.wjgnet.com/1007-9327/full/v28/i2/242.htm
- DOI: https://dx.doi.org/10.3748/wjg.v28.i2.242


