Copyright
©The Author(s) 2022.
World J Gastroenterol. May 14, 2022; 28(18): 1981-1995
Published online May 14, 2022. doi: 10.3748/wjg.v28.i18.1981
Published online May 14, 2022. doi: 10.3748/wjg.v28.i18.1981
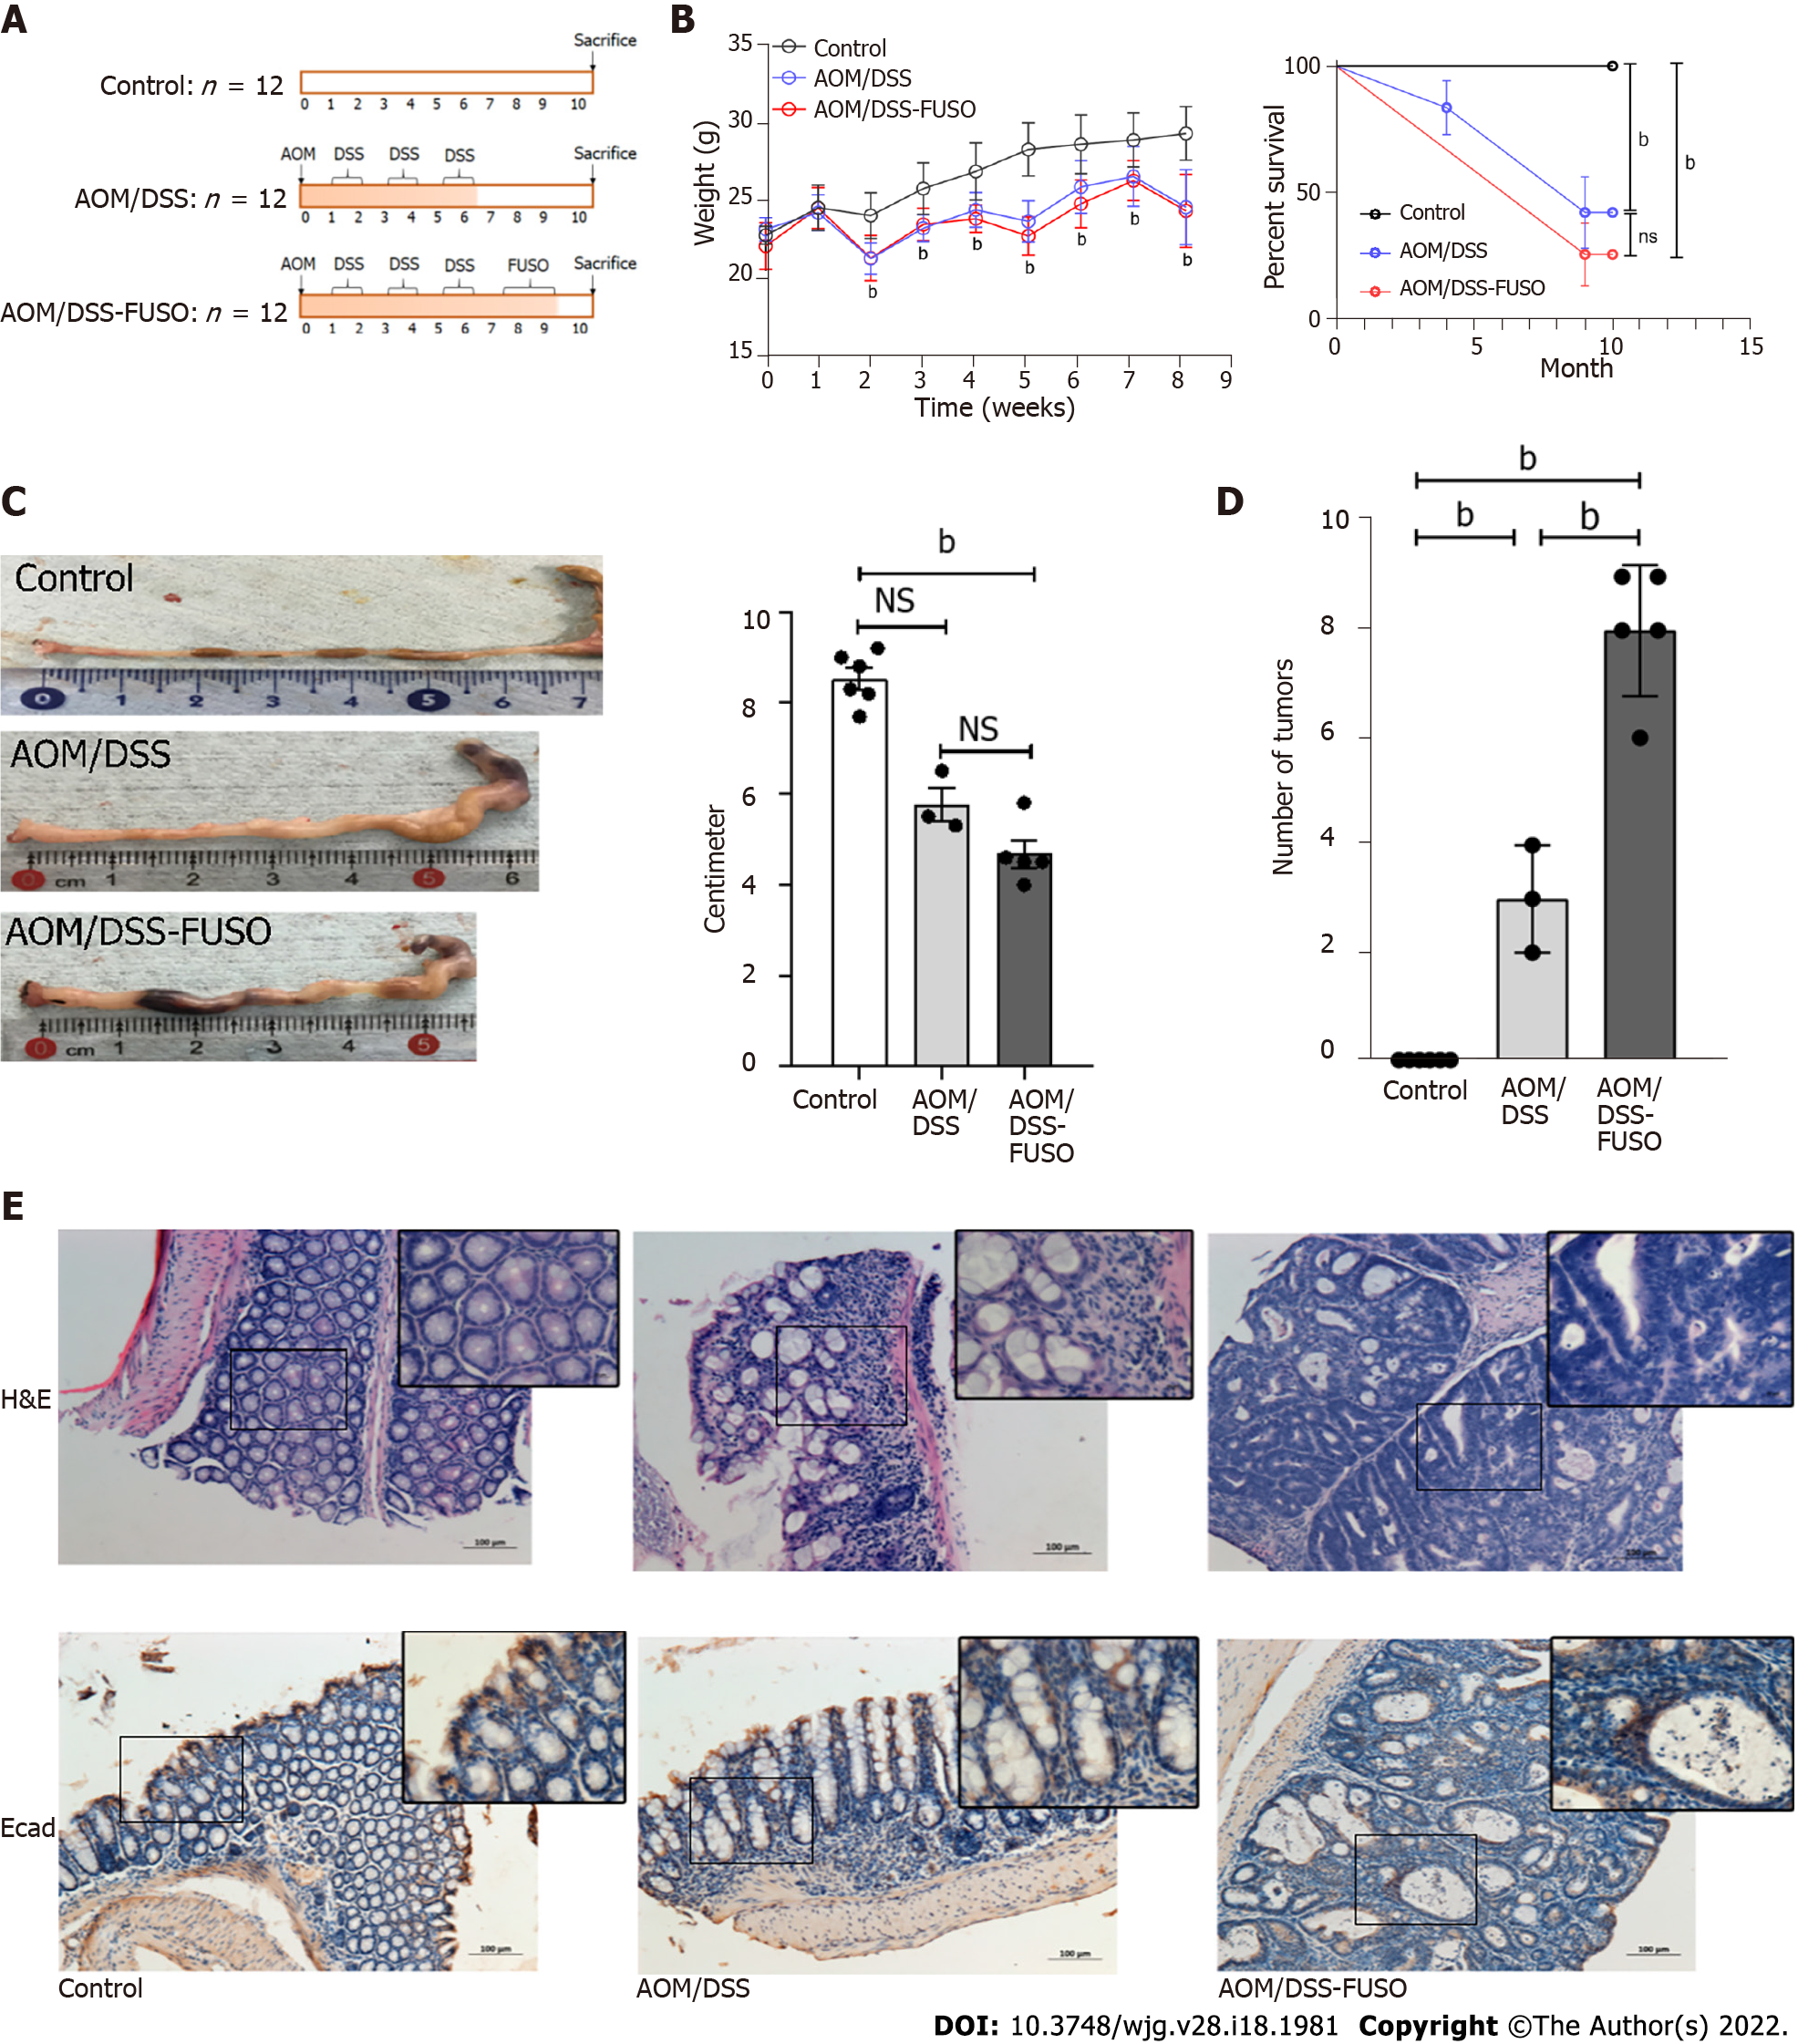
Figure 1 Effect of F.
nucleatum infection on colon carcinogenesis in the azoxymethane/dextran sulfate sodium-induced model. A: Experimental design illustrating the F. nucleatum infection strategy combined with azoxymethane/dextran sulfate sodium salt treatment; B: The body weight and survival curve of the three groups during the experiment was evaluated with two-way ANOVA; C: The colon lengths of the three groups were compared using a t-test; D: The numbers of tumors in the colon of the three groups were compared using a t-test; E: Hematoxylin-eosin staining and immunohistochemistry of E-cadherin-positive cells in the colon of the three groups. aP < 0.05; bP < 0.01. NS: No signification; AOM: Azoxymethane; DSS: Dextran sulfate sodium salt.
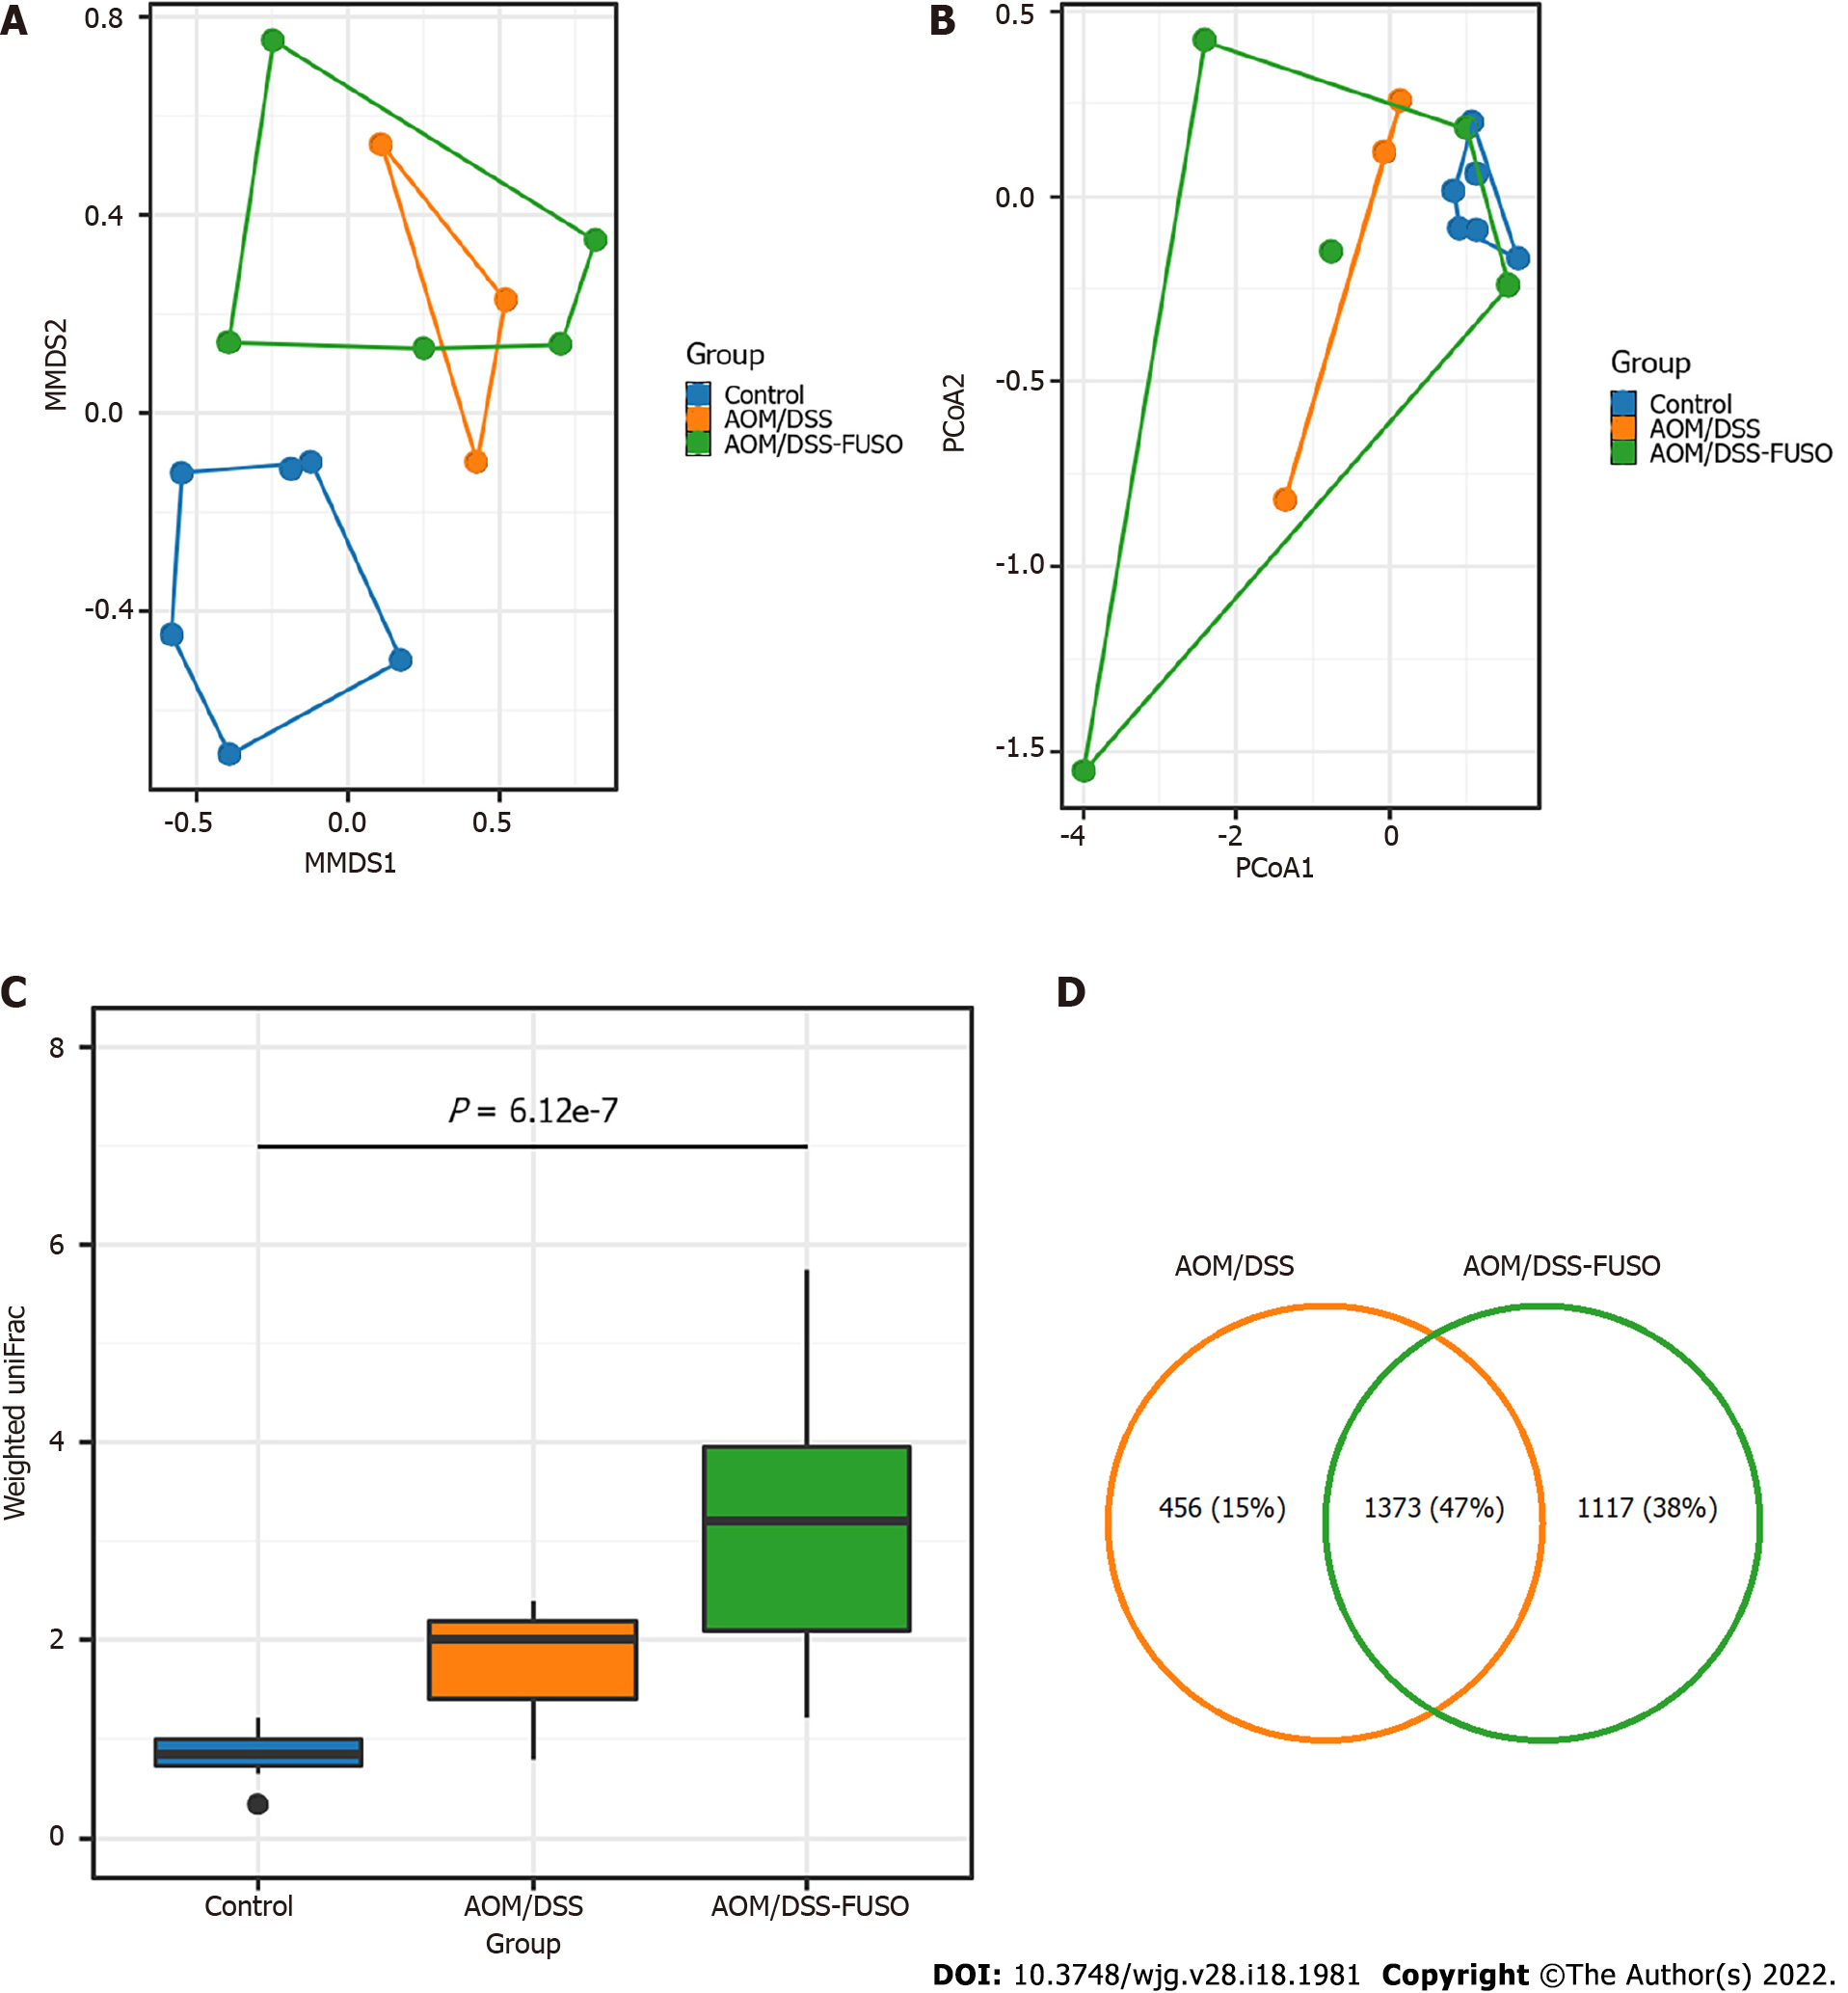
Figure 2 Diversity and shared operational taxonomic units of the gut microbiota in different groups.
A: Nonmetric multidimensional plot of the cecal microbiota from the 14 samples based on Bray-Curtis similarities; B: Principal coordinate analysis plot of the cecal microbiota from the 14 samples based on Bray-Curtis similarities; C: Weighted UniFrac distance of the samples from different groups. Kruskal-Wallis test: P = 6.12 × 10⁻⁷; D: Number of shared operational taxonomic units between the samples from the azoxymethane-dextran sulfate sodium salt (AOM/DSS)-FUSO group and the AOM/DSS group. AOM: Azoxymethane; DSS: Dextran sulfate sodium salt.
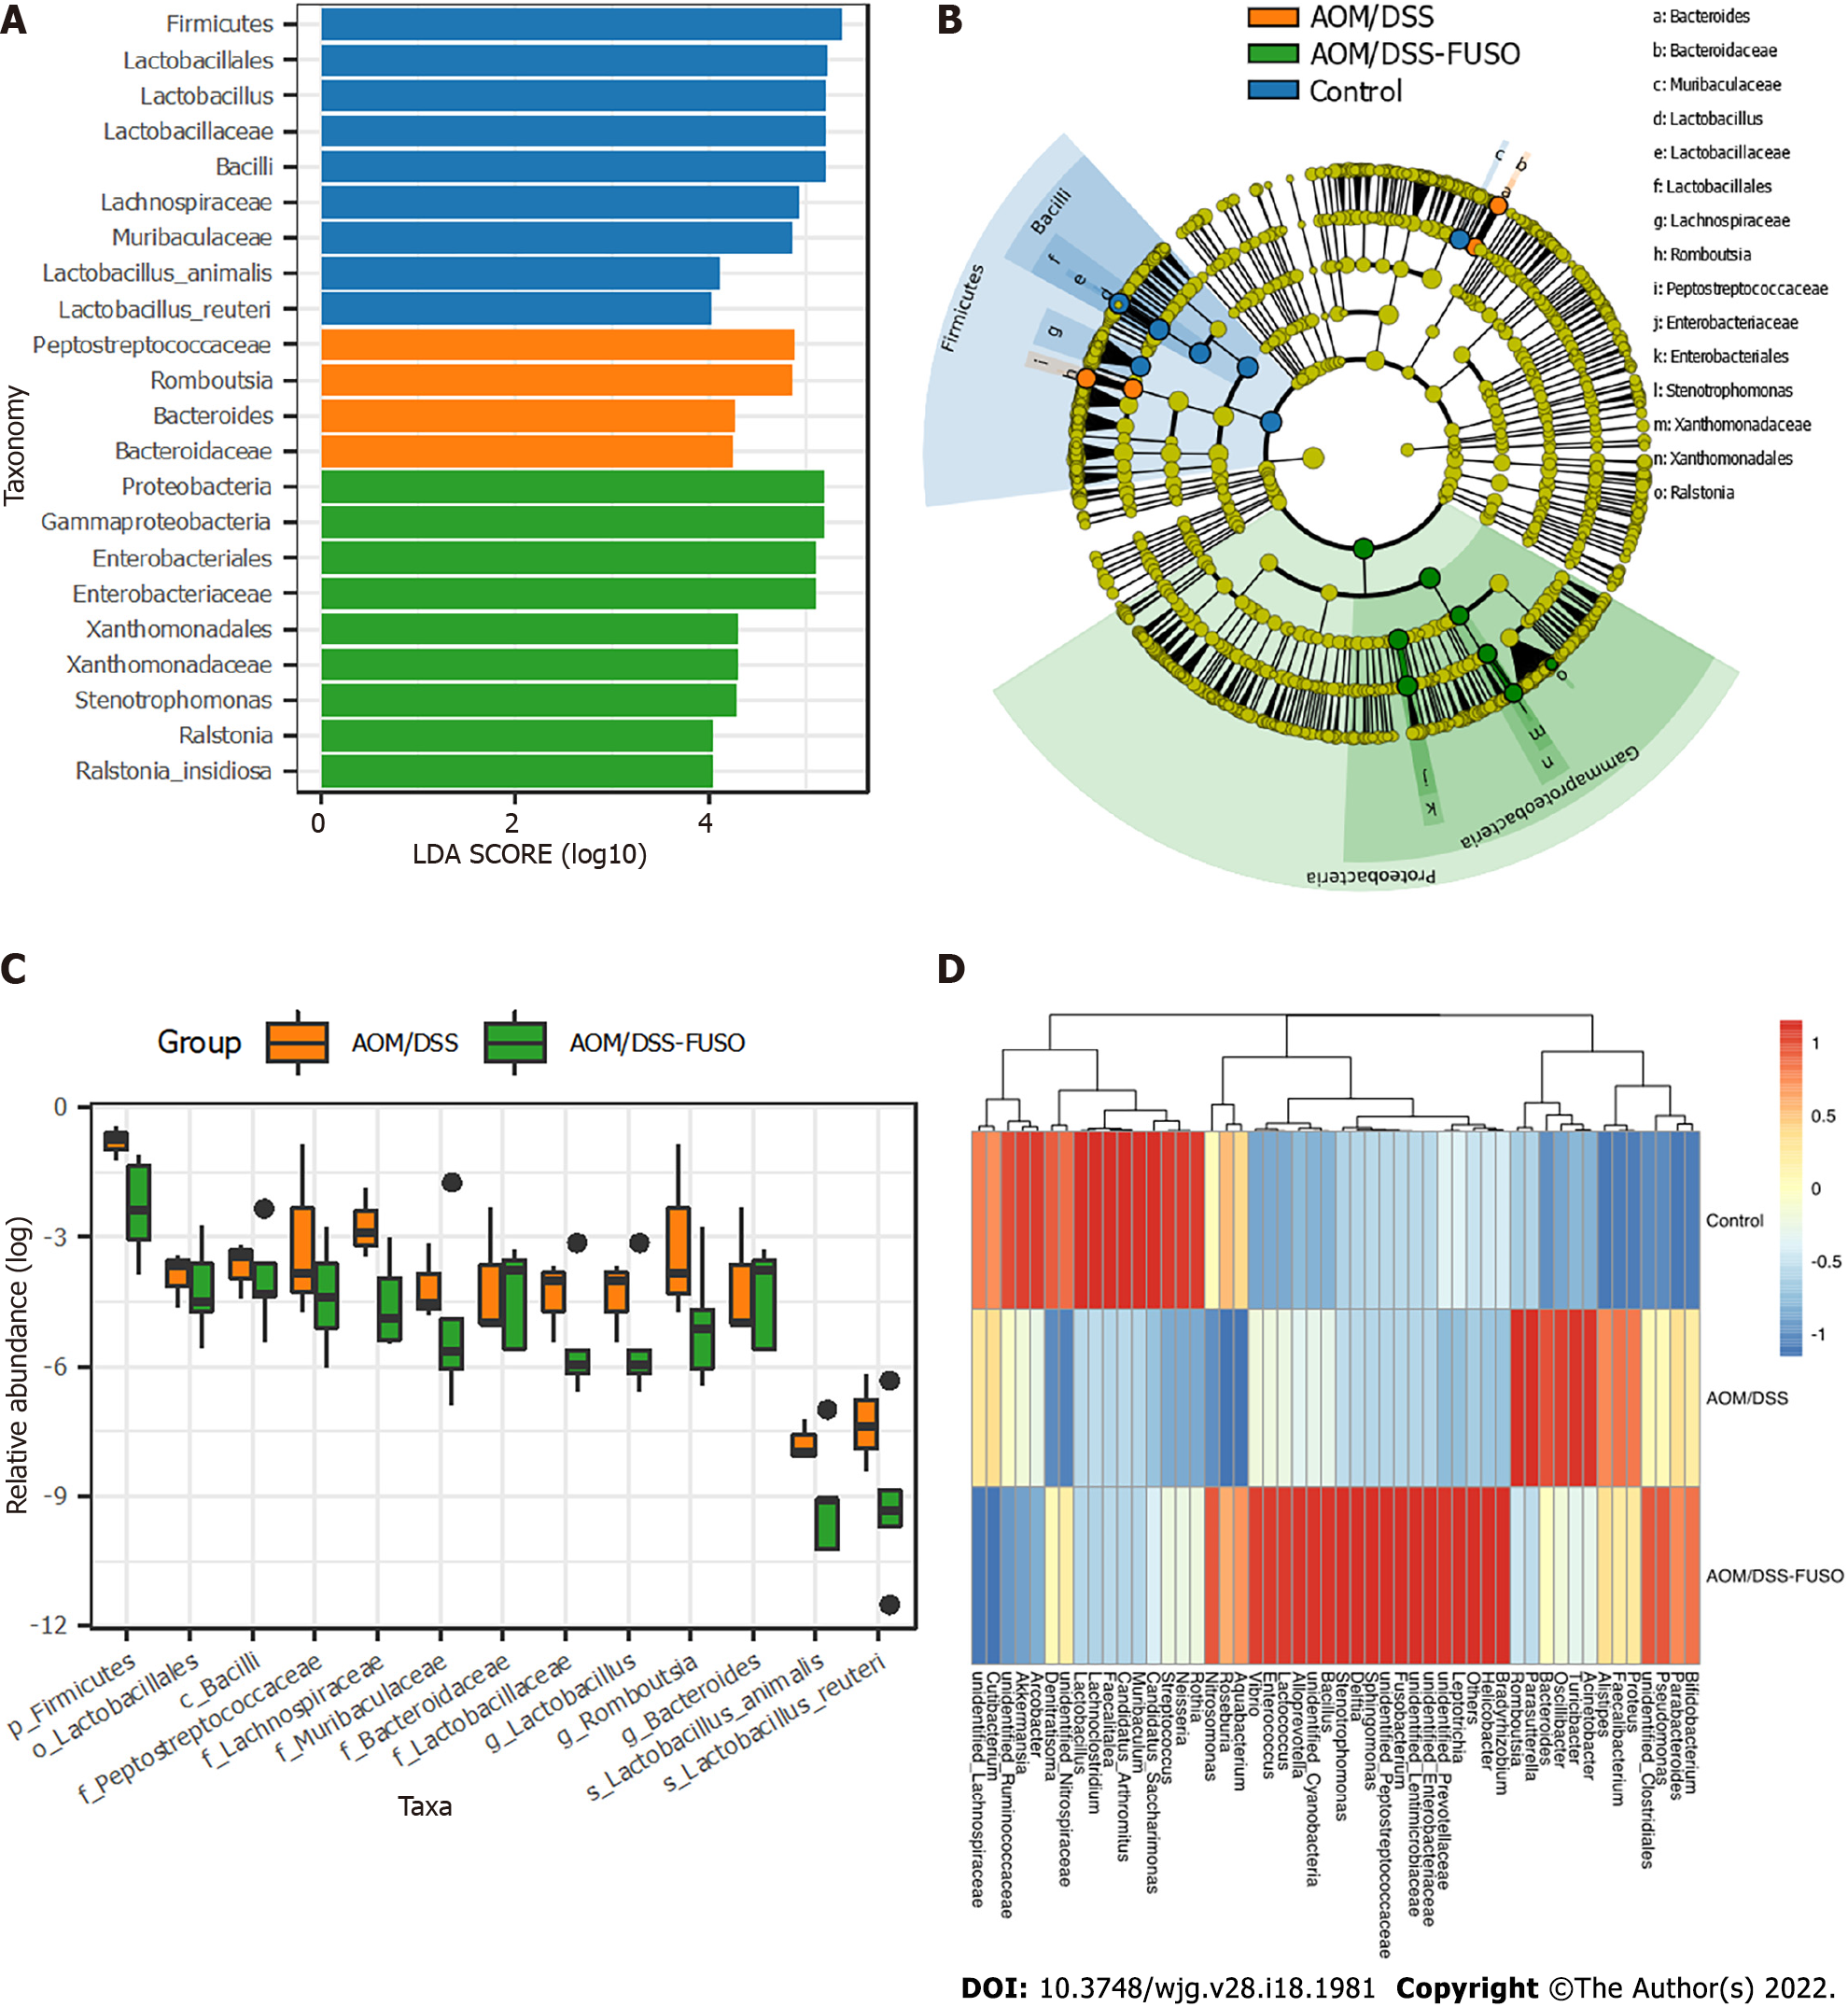
Figure 3 The differentially abundant taxa among the three groups.
A: Histogram of the linear discriminant analysis scores computed for taxa that were differentially abundant among the three groups; B: Taxonomic representation of statistically and biologically consistent differences among the three groups. The differences are represented in the color of the most abundant class; C: Relative abundance of the taxa in azoxymethane/dextran sulfate sodium salt (AOM/DSS)-FUSO and AOM/DSS; D: Patterns of the abundance of the top 50 operational taxonomic units in all samples. The colors indicate the Z scores of the mean abundance in each group. AOM: Azoxymethane; DSS: Dextran sulfate sodium salt.
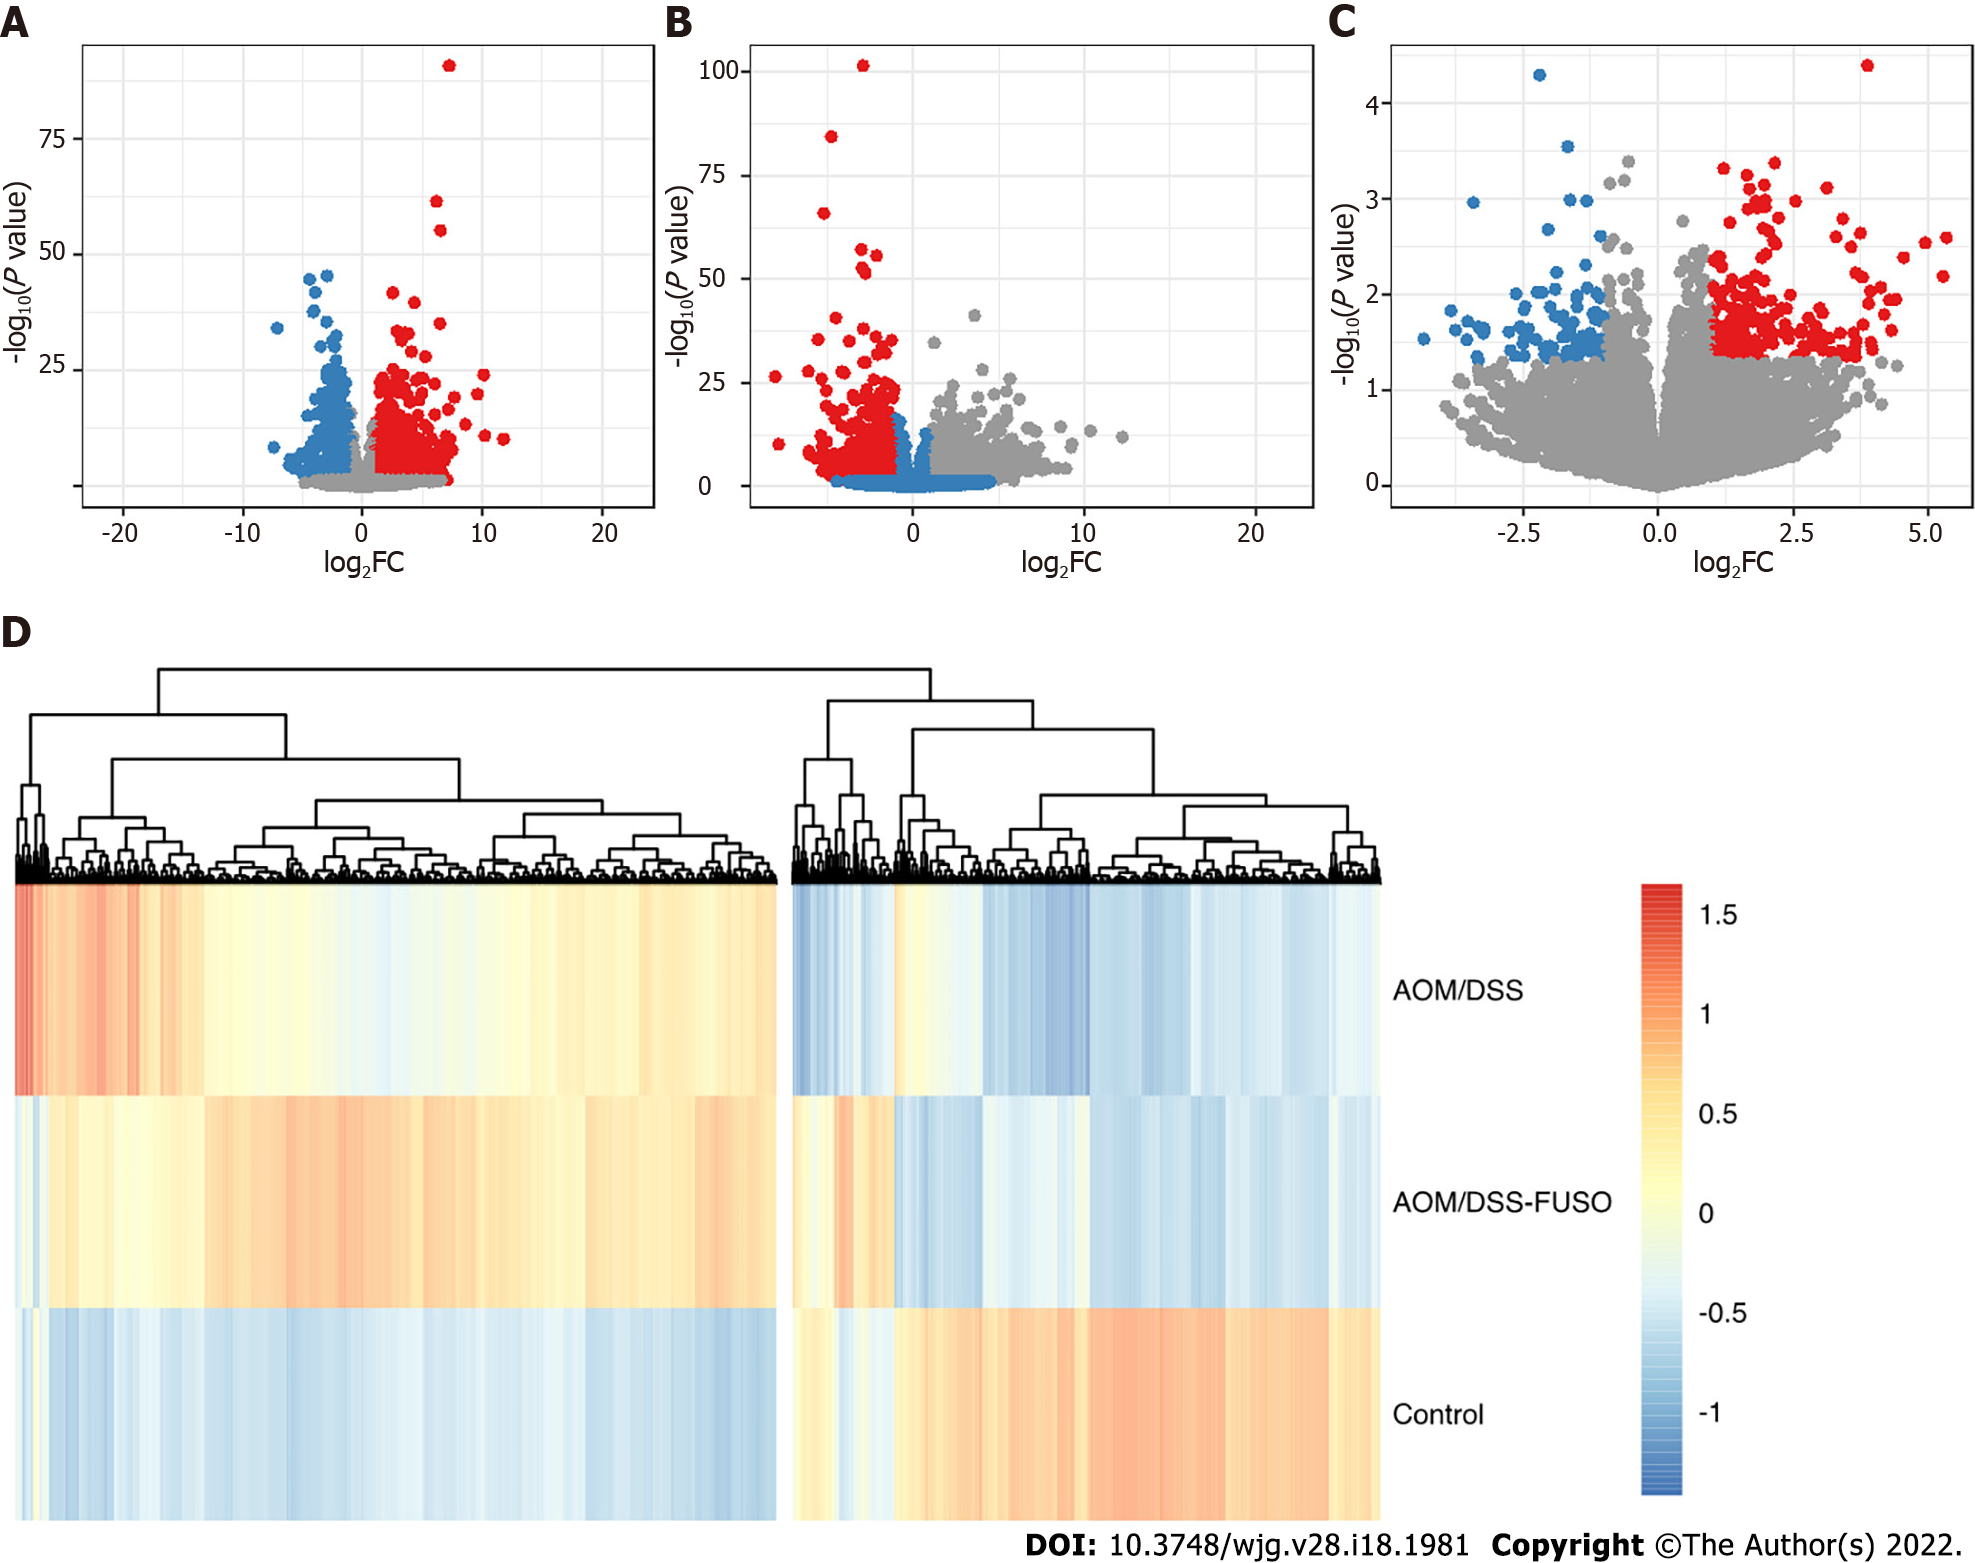
Figure 4 The differentially expressed genes of the mucosa.
A: Volcano plot showing the differentially expressed genes between the azoxymethane/dextran sulfate sodium salt (AOM/DSS) group and the control group; B: Volcano plot showing the differentially expressed genes between the AOM/DSS-FUSO group and the control group; C: Volcano plot showing the differentially expressed genes between the AOM/DSS-FUSO group and the AOM/DSS group. Significantly upregulated genes are shown in red (P < 0.05 and log2FC ≥ 1). Significantly downregulated genes are shown in blue (P < 0.05 and log2FC ≤ -1). The numbers of significantly upregulated genes were 1374 for (A), 1939 for (B) and 231 for (C). The numbers of significantly downregulated genes were 1050 for (A), 1104 for (B) and 92 for (C); D: Patterns of the abundance of all of the differentially expressed genes in the upper panels. The colors indicate the Z scores of the mean abundance in each group. AOM: Azoxymethane; DSS: Dextran sulfate sodium salt.
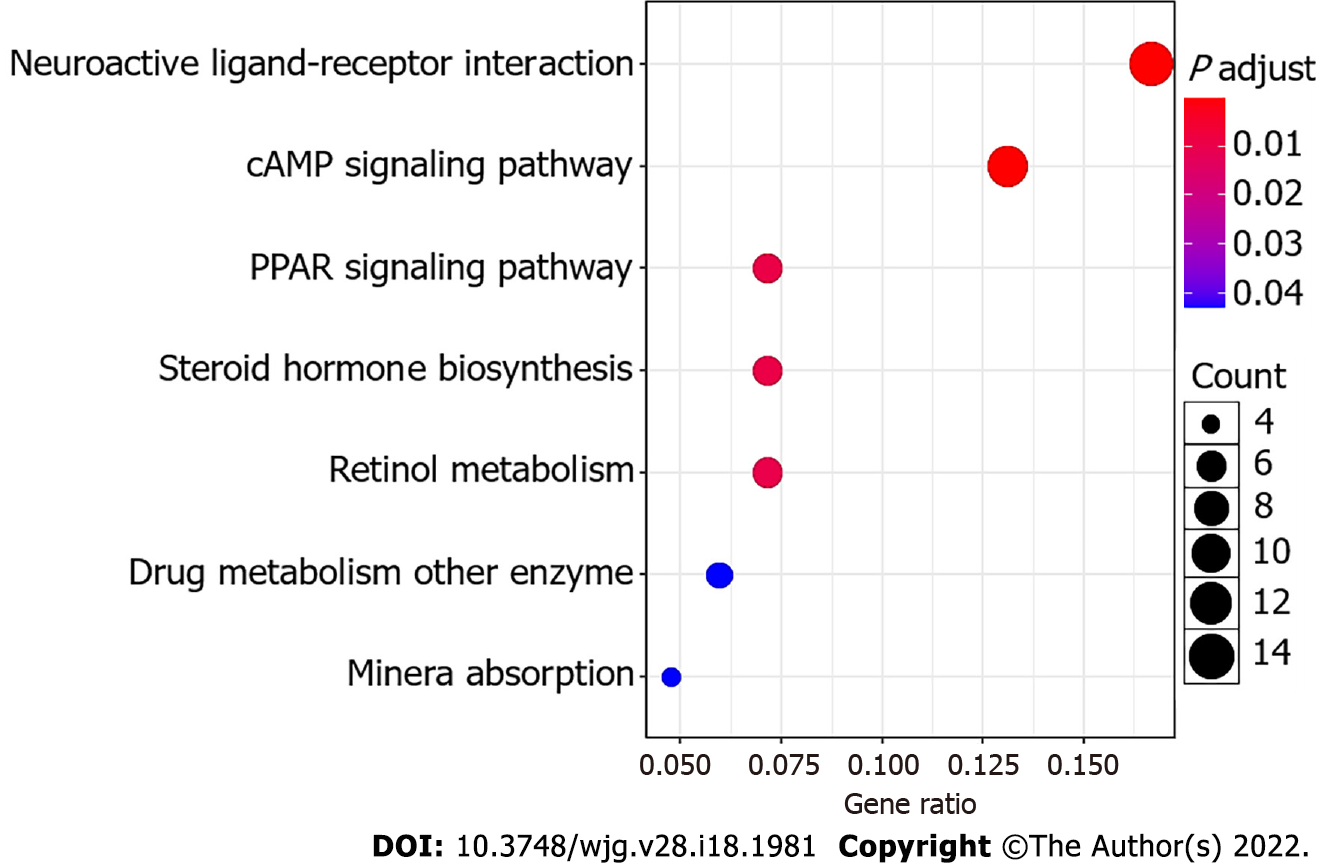
Figure 5 Bubble plot of the KEGG pathways.
The size of the bubble indicates the relative number of genes in the set. The color of the bubble indicates the adjusted P value.
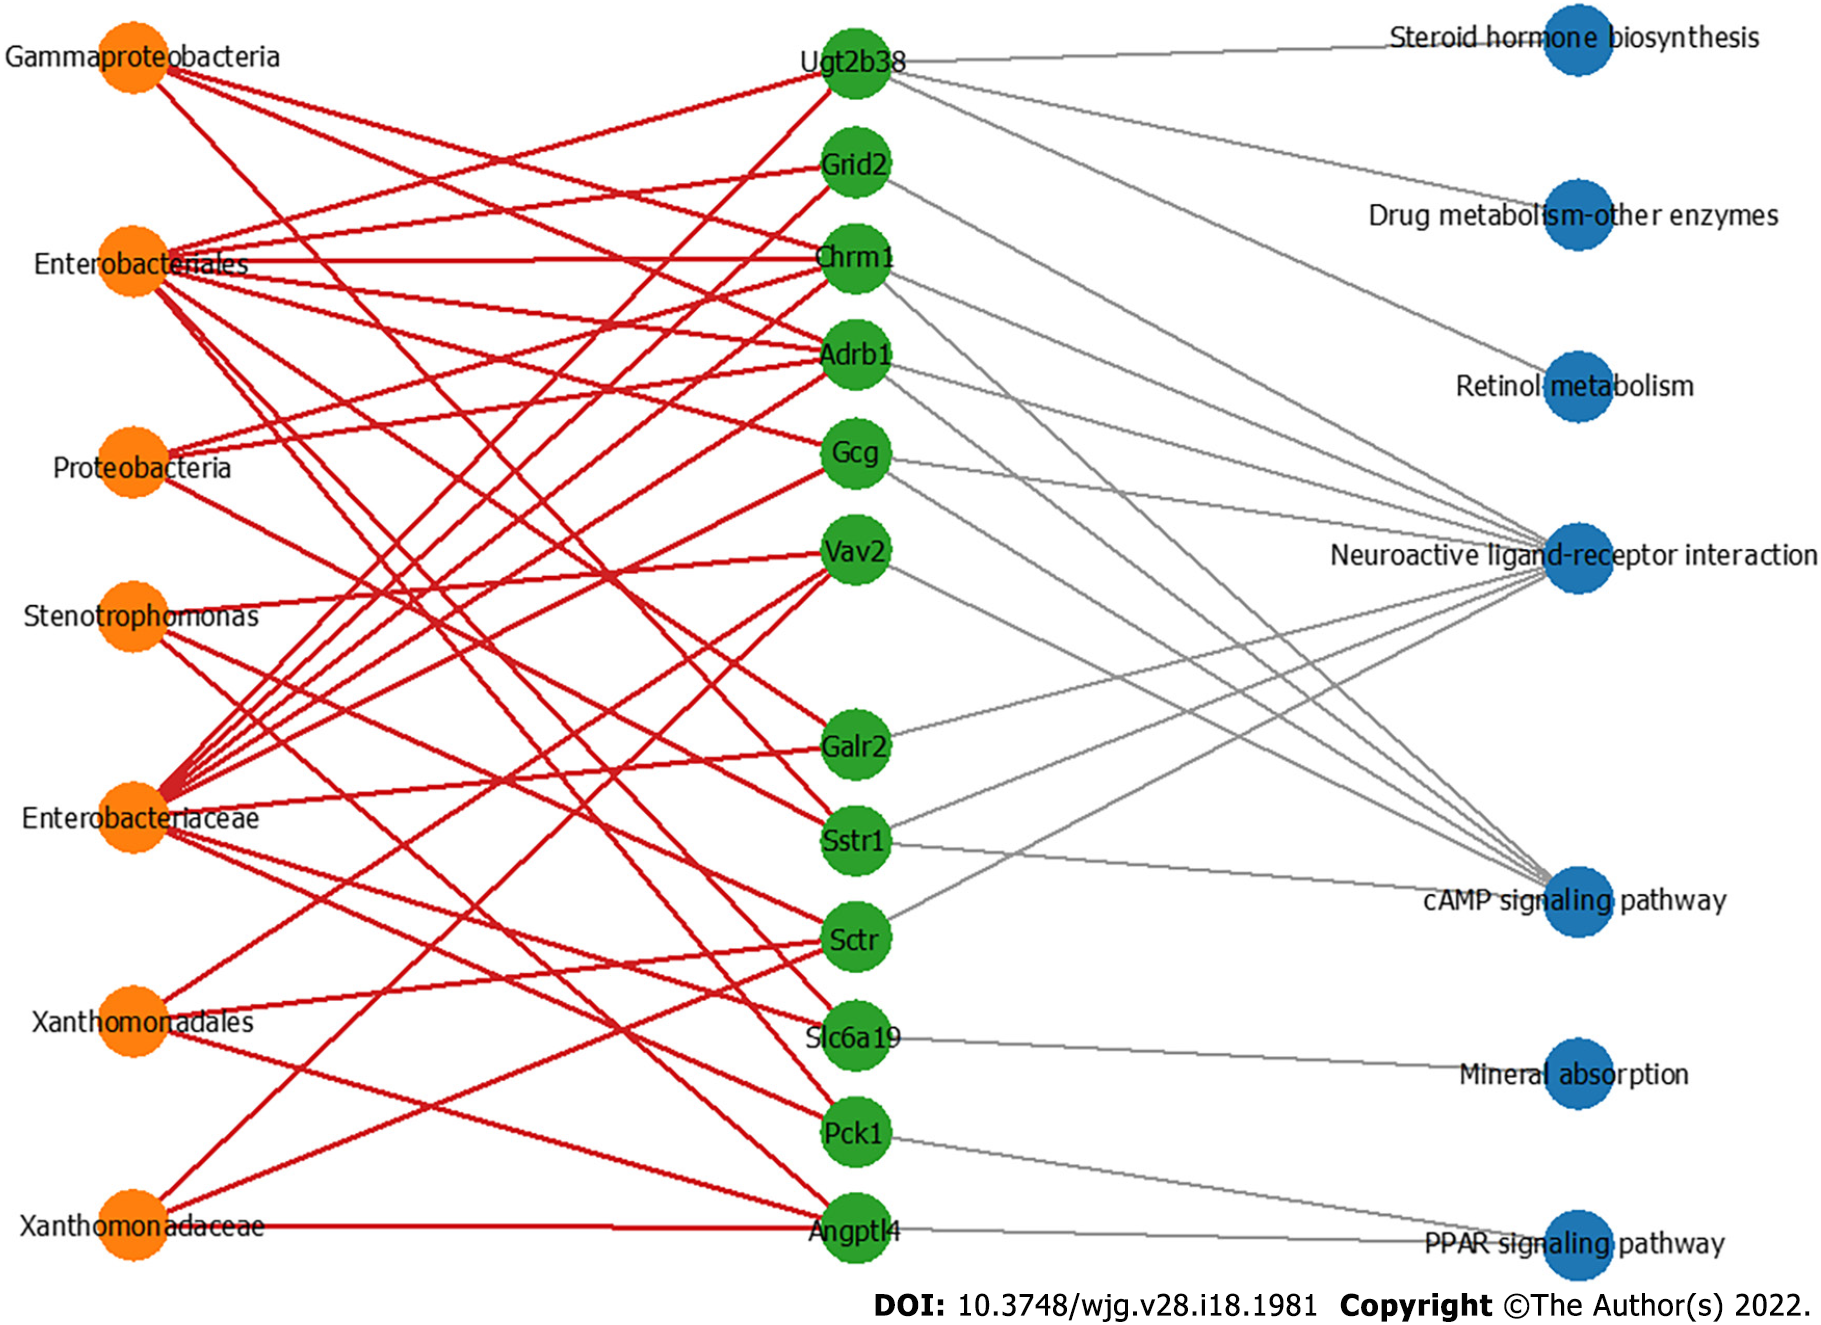
Figure 6 The co-occurrence network shows the correlations of the colon mucosa microbiota with the differentially expressed genes.
Edges: Correlations with P values < 0.01; red edges: Positive correlations; gray edges: Relationship between the genes and the pathways; green nodes: Genes involved in the top seven significantly differential KEGG pathways in the azoxymethane/dextran sulfate sodium salt (AOM/DSS)-FUSO group compared with the AOM/DSS group; orange nodes: The differential bacterial taxa identified by LEfSe analysis; blue nodes: Related pathways of defferentially expressed genes.
- Citation: Wu N, Feng YQ, Lyu N, Wang D, Yu WD, Hu YF. Fusobacterium nucleatum promotes colon cancer progression by changing the mucosal microbiota and colon transcriptome in a mouse model. World J Gastroenterol 2022; 28(18): 1981-1995
- URL: https://www.wjgnet.com/1007-9327/full/v28/i18/1981.htm
- DOI: https://dx.doi.org/10.3748/wjg.v28.i18.1981


