Copyright
©The Author(s) 2022.
World J Gastroenterol. Mar 28, 2022; 28(12): 1257-1271
Published online Mar 28, 2022. doi: 10.3748/wjg.v28.i12.1257
Published online Mar 28, 2022. doi: 10.3748/wjg.v28.i12.1257
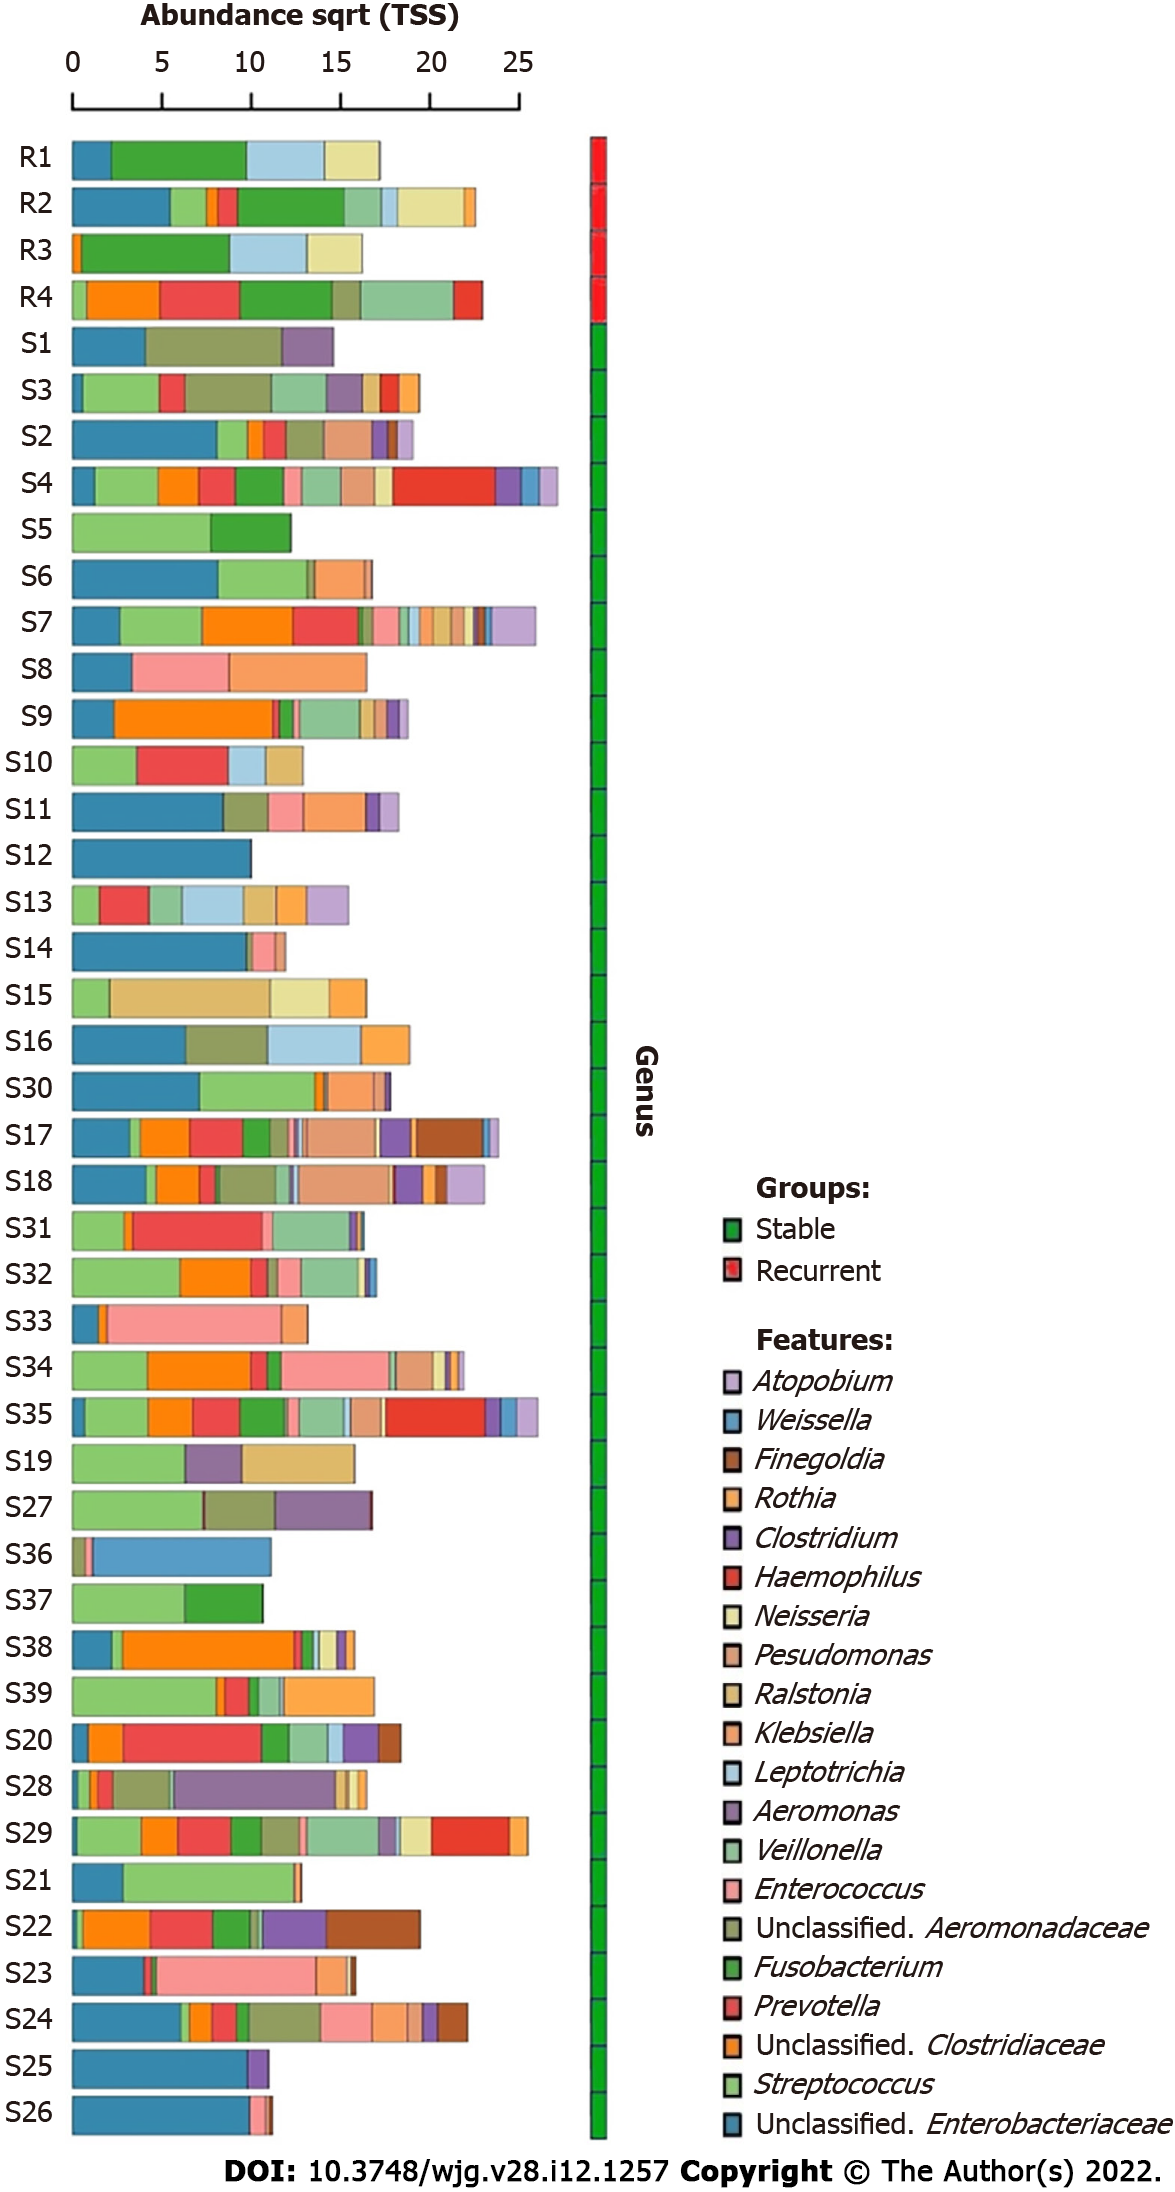
Figure 1 Dominant bacterial genera in the bile of choledocholithiasis patients.
The top 20 dominant bacterial genera in bile are shown in the bar chart, the bile microbiome of recurrent choledocholithiasis patients post-endoscopic sphincterotomy are in the red group and choledocholithiasis patients without recurrence post-EST are in the green group. The genera were listed from the bottom to the top according to their relative abundance in bile samples.
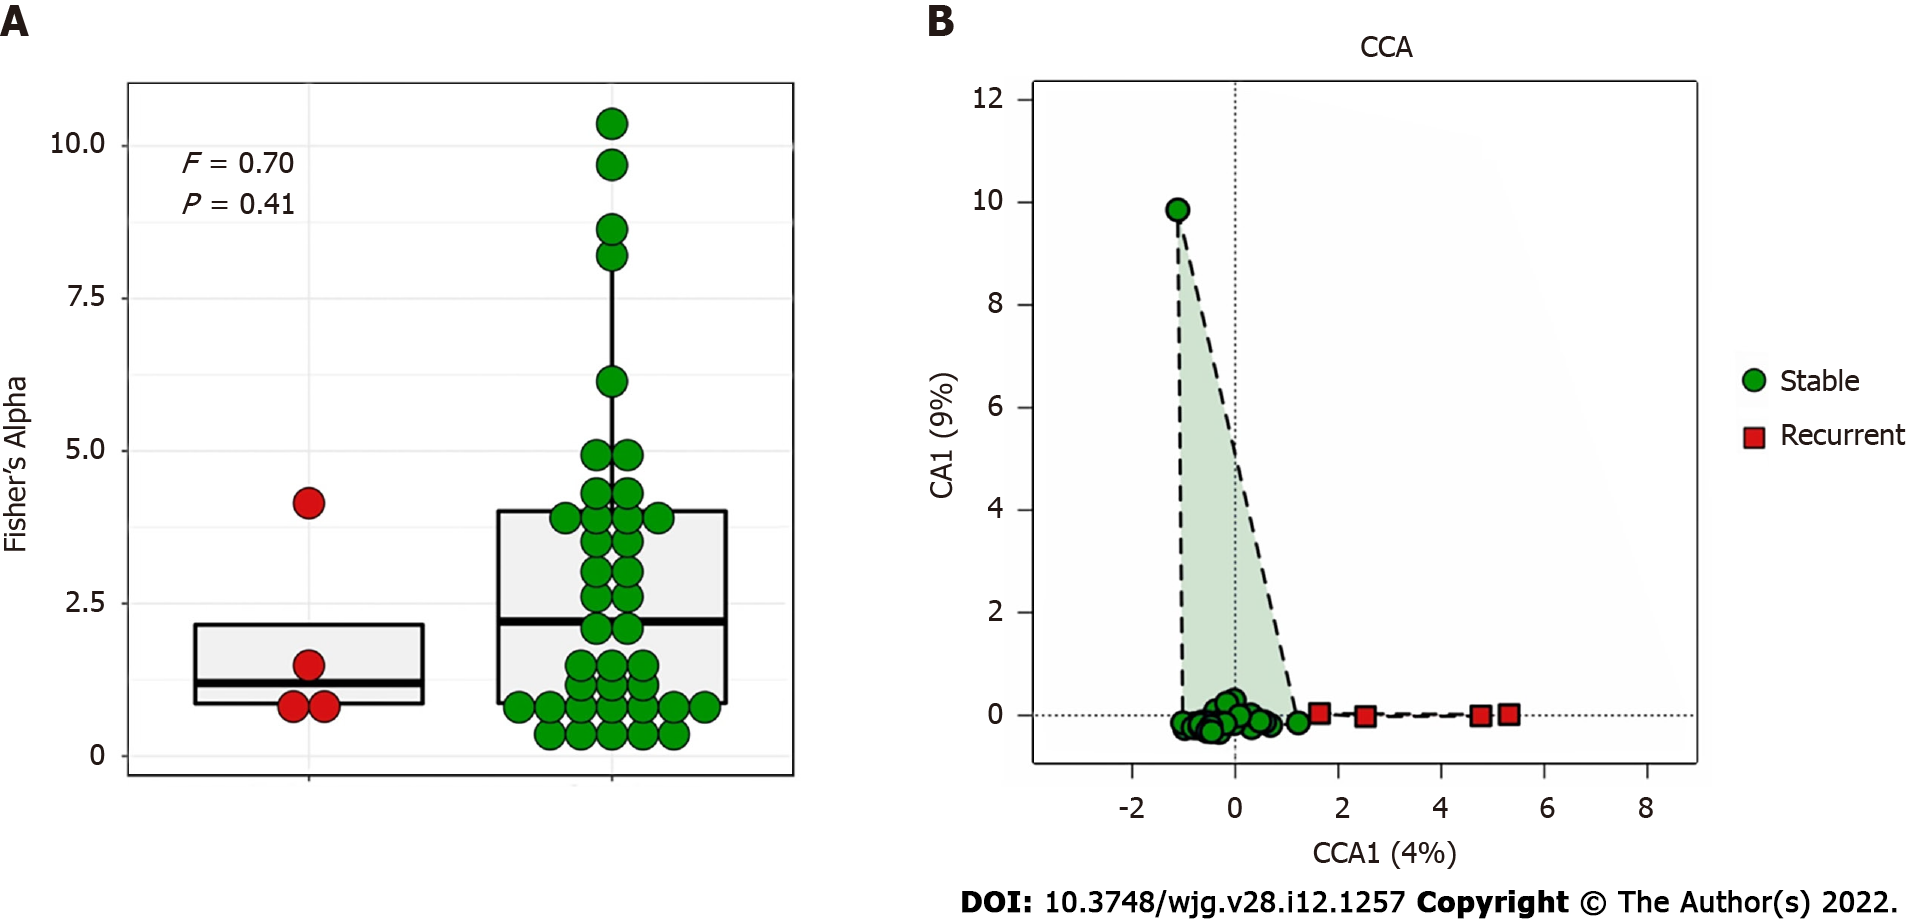
Figure 2 Diversity analysis of bile microbiome of choledocholithiasis patients.
A: Comparison of alpha diversity of bile microbiome by the Fisher’s Alpha Index between stable (green) and recurrent (red) choledocholithiasis patients post-endoscopic sphincterotomy (EST); B: Comparison of beta diversity of bile microbiome using canonical correspondence analysis between stable (green) and recurrent (red) choledocholithiasis patients post-EST.
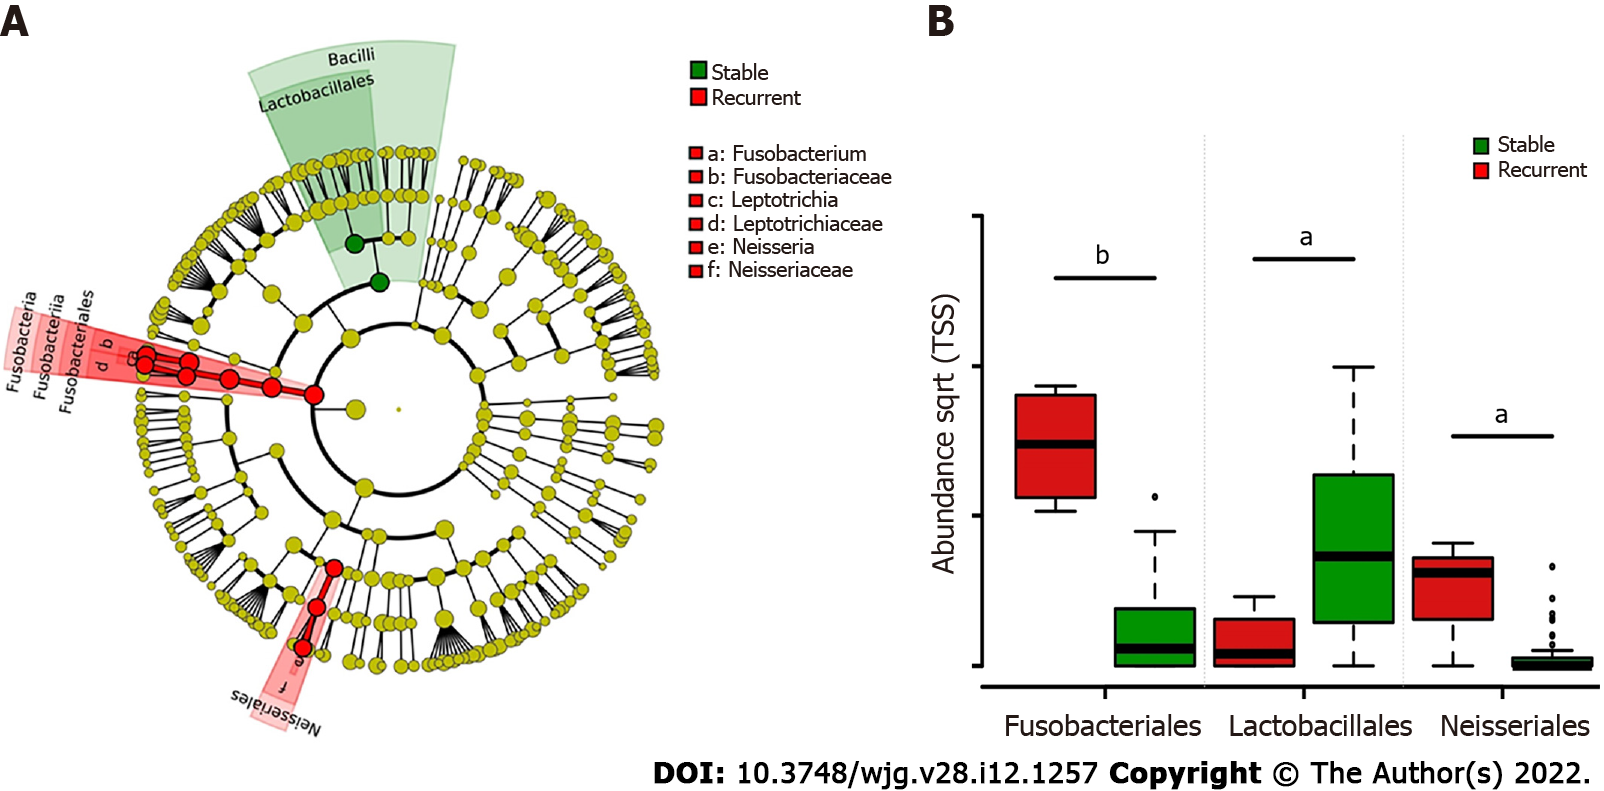
Figure 3 LEfSe analysis of group-specific microbes in choledocholithiasis patients with different prognosis post endoscopic sphincterotomy.
A: Colored cladogram showing microbiota with biomarker significance in choledocholithiasis patients with different prognosis post-endoscopic sphincterotomy (EST) (red for biomarkers in recurrent patients and green for biomarkers in patients without recurrence post EST); B: Relative abundance comparison of microbes with biomarker significance in choledocholithiasis patients with different prognosis post-EST. Statistical significance is expressed as aP < 0.05, bP < 0.001.
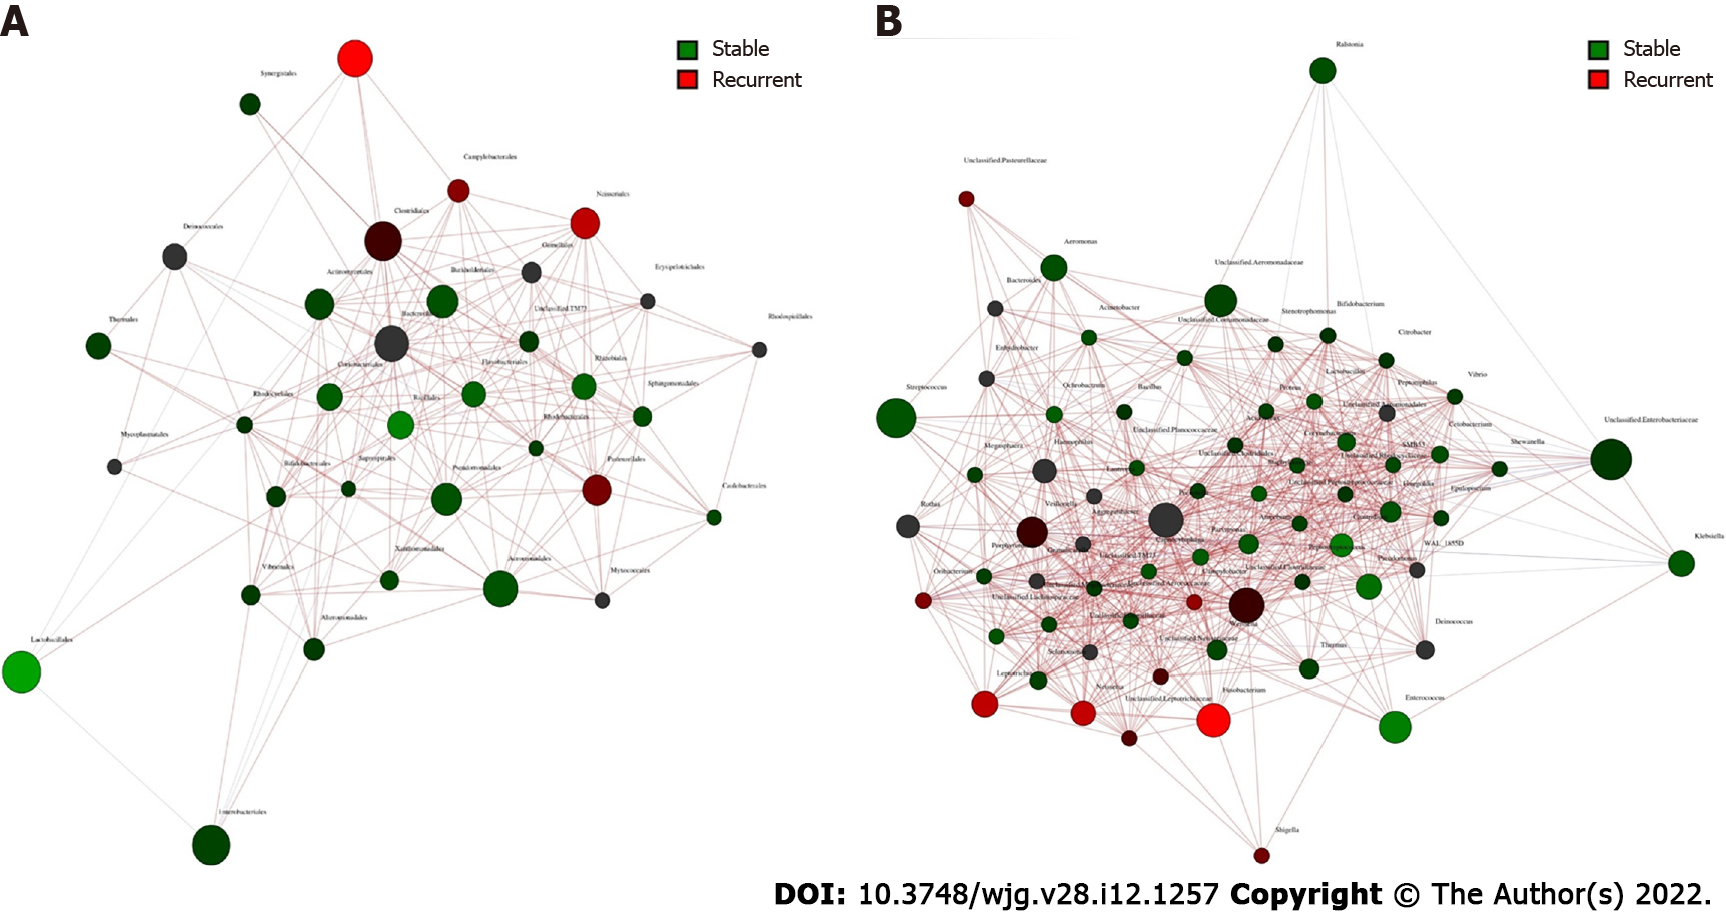
Figure 4 Co-occurrence network analysis of bile microbiome of choledocholithiasis patients with different prognosis post endoscopic sphincterotomy.
A: Co-occurrence and disease-specific bacterial interactions at the order level. Order was presented as nodes (stable group specific order in green and recurrent group specific order in red), order abundance was presented as node size, and edges were represented based on their association tested using Pearson’s correlation (positive inter-node correlations in blue, negative inter-node correlations in red); B: Co-occurrence and disease-specific bacterial interactions at the genus level. Genus was presented as nodes (stable group specific genus in green and recurrent group specific genus in red), genus abundance was presented as node size, and edges were represented based on their association tested using Pearson’s correlation (positive inter-node correlations in blue, negative inter-node correlations in red).
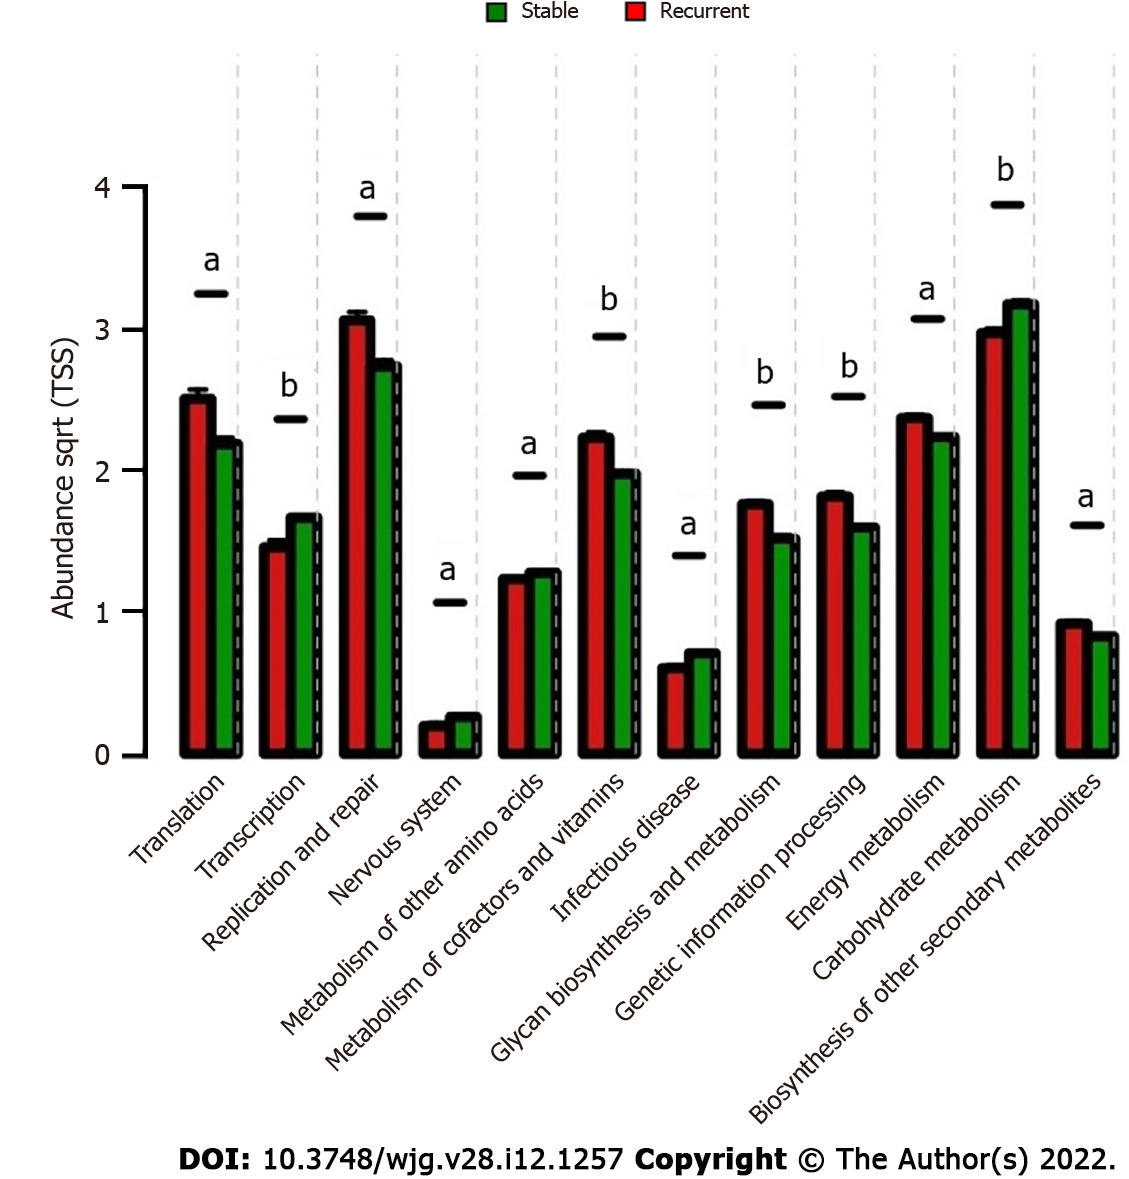
Figure 5 Comparison of microbial function prediction of bile microbiome of choledocholithiasis patients with different prognosis post endoscopic sphincterotomy.
Functional analysis was performed at the 2nd hierarchy level of the Kyoto Encyclopedia of Genes and Genomes pathways in the bile microbiome of choledocholithiasis patients. Wilcoxon test was applied to the comparison of each category of microbial function; those with significant differences are shown in the bar chart. Statistical significance is expressed as aP < 0.05, bP < 0.01.
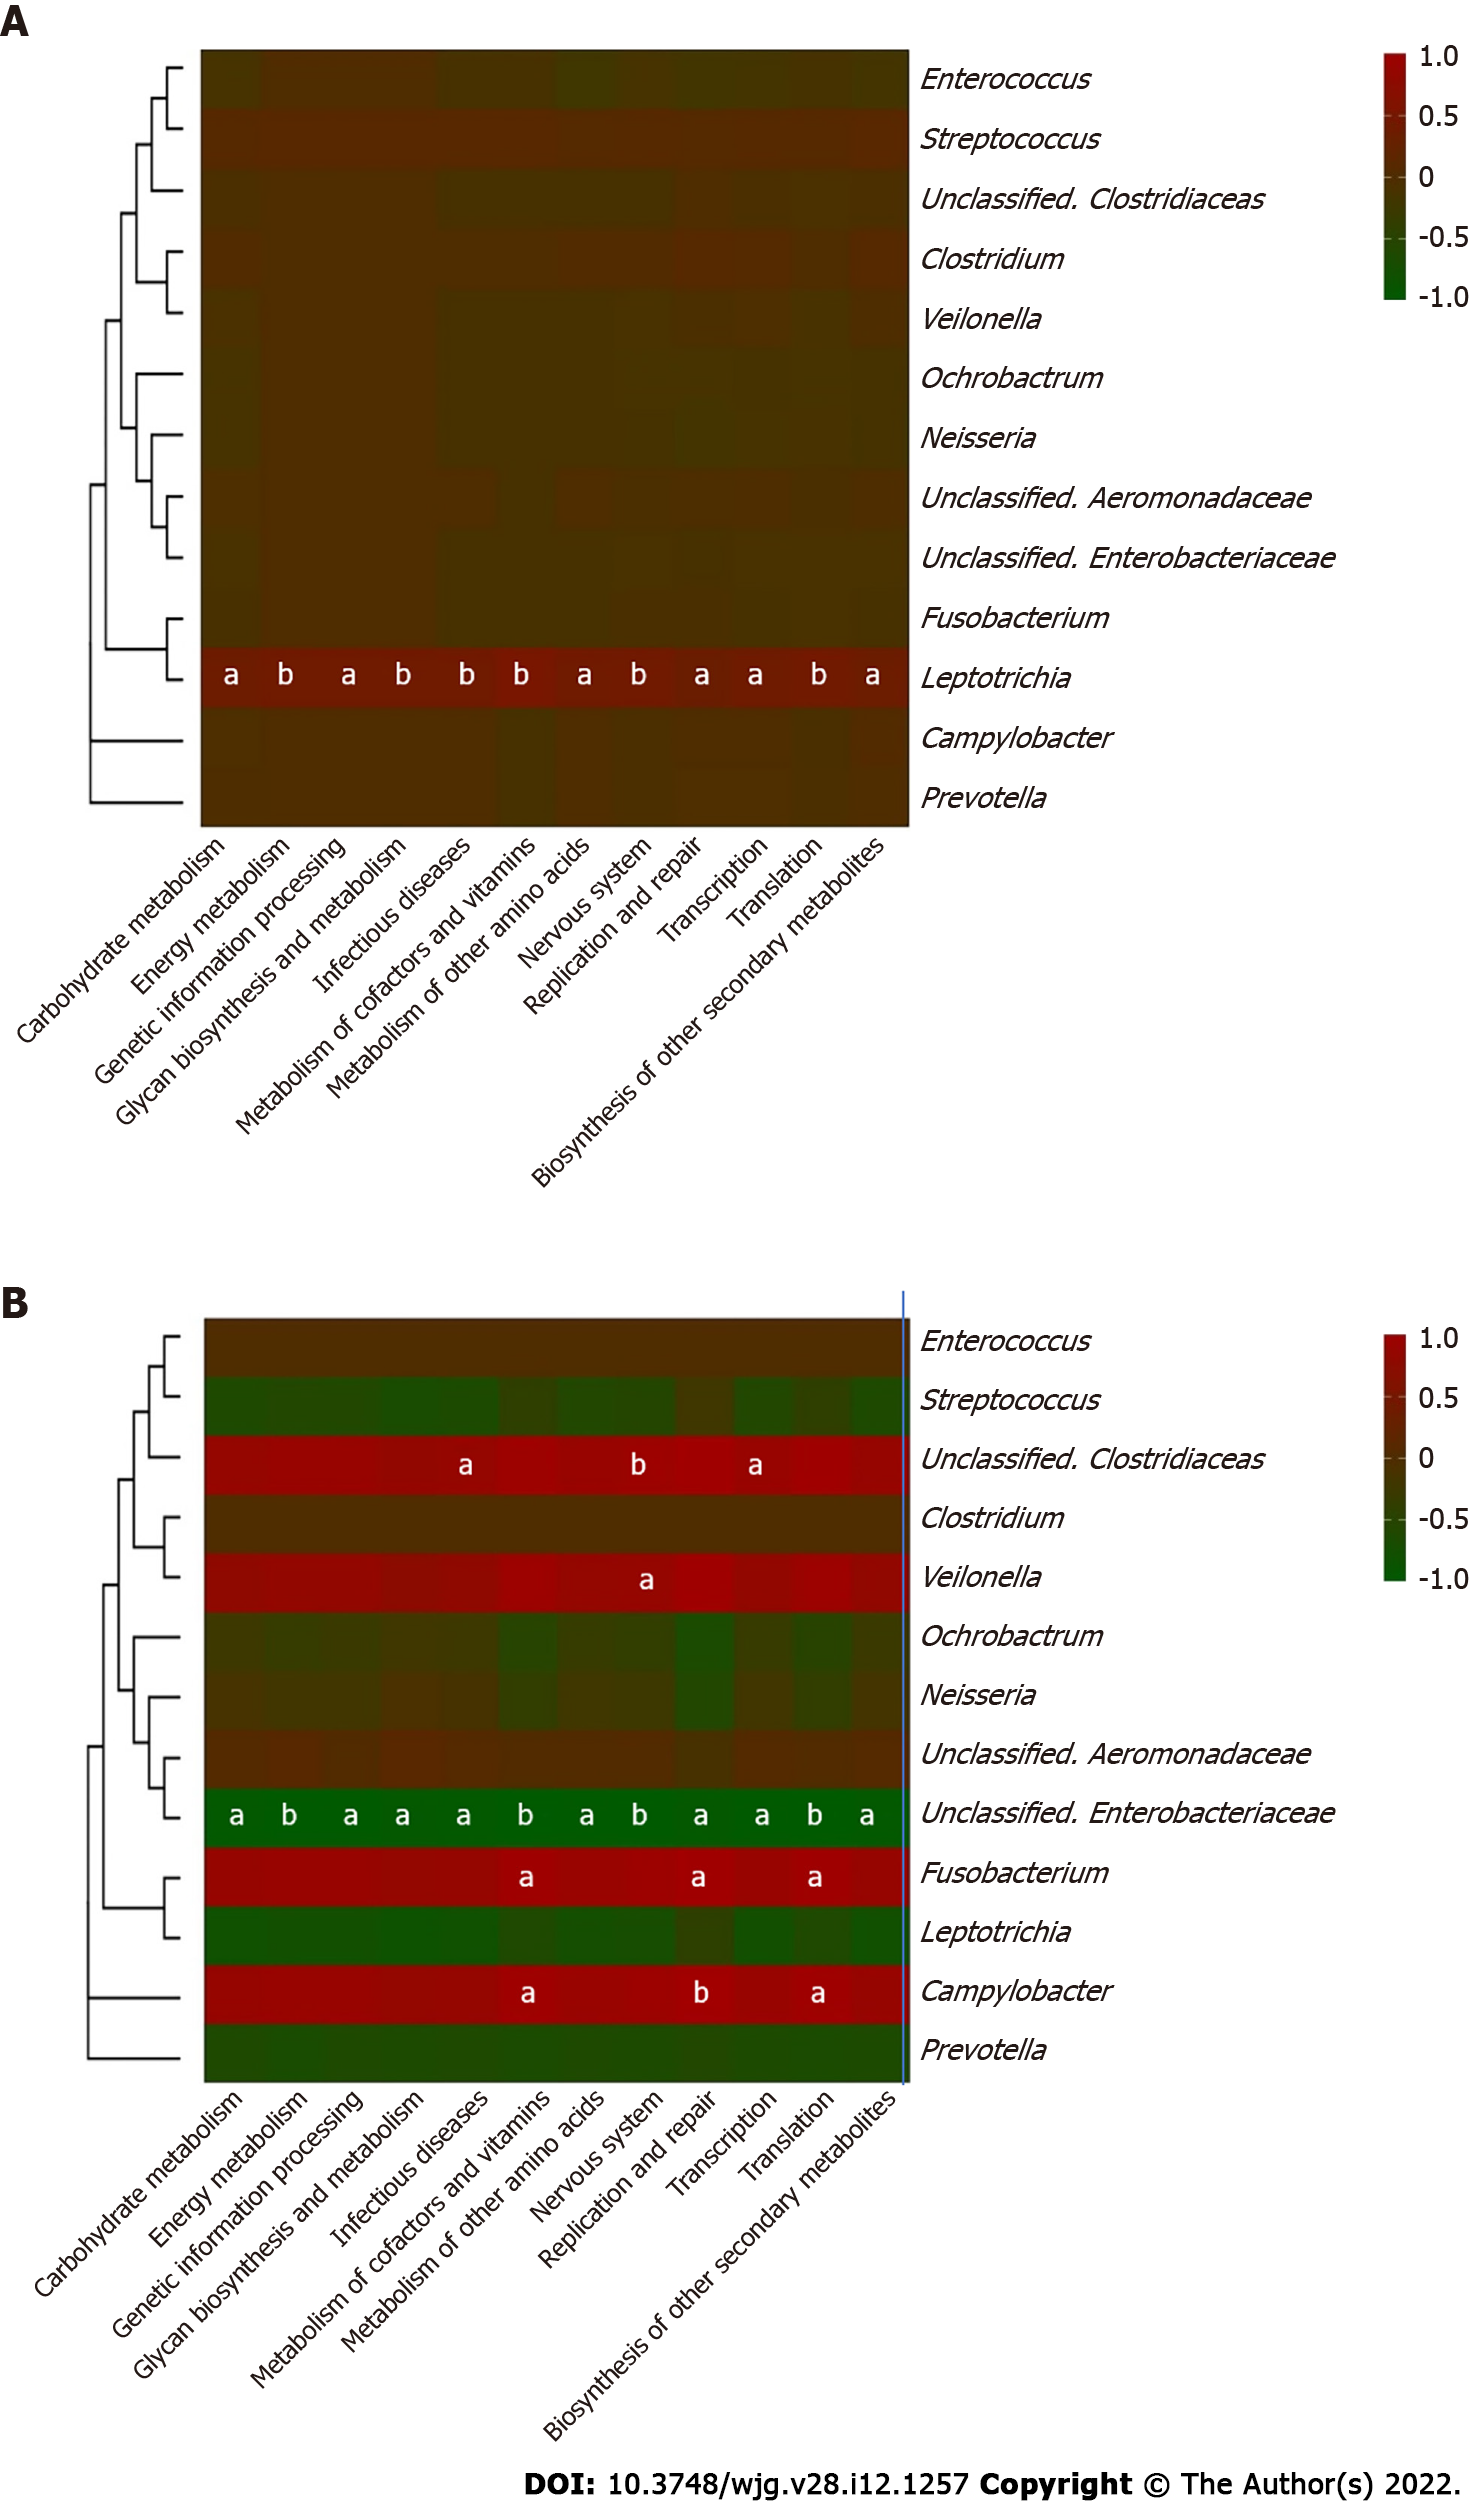
Figure 6 Heatmap of correlation between the core microbiome and key metabolic pathway in choledocholithiasis patients.
Thirteen core genera of bile microbiome and their correlations with the twelve discrepant metabolite pathways in different prognosis groups were analyzed using Pearson correlation analysis. The Pearson correlation coefficient between the genus and the metabolic pathway was calculated and shown in colored matrix; red represents a positive correlation, while green represents a negative correlation. A: Matrix heatmap shows the correlations between different genera and metabolite pathways in choledocholithiasis patients without recurrence post-endoscopic sphincterotomy (EST); B: Matrix heatmap shows the correlations between different genera and metabolite pathways in recurrent choledocholithiasis patients post-EST. Statistical significance is expressed as aP < 0.05, bP < 0.01.
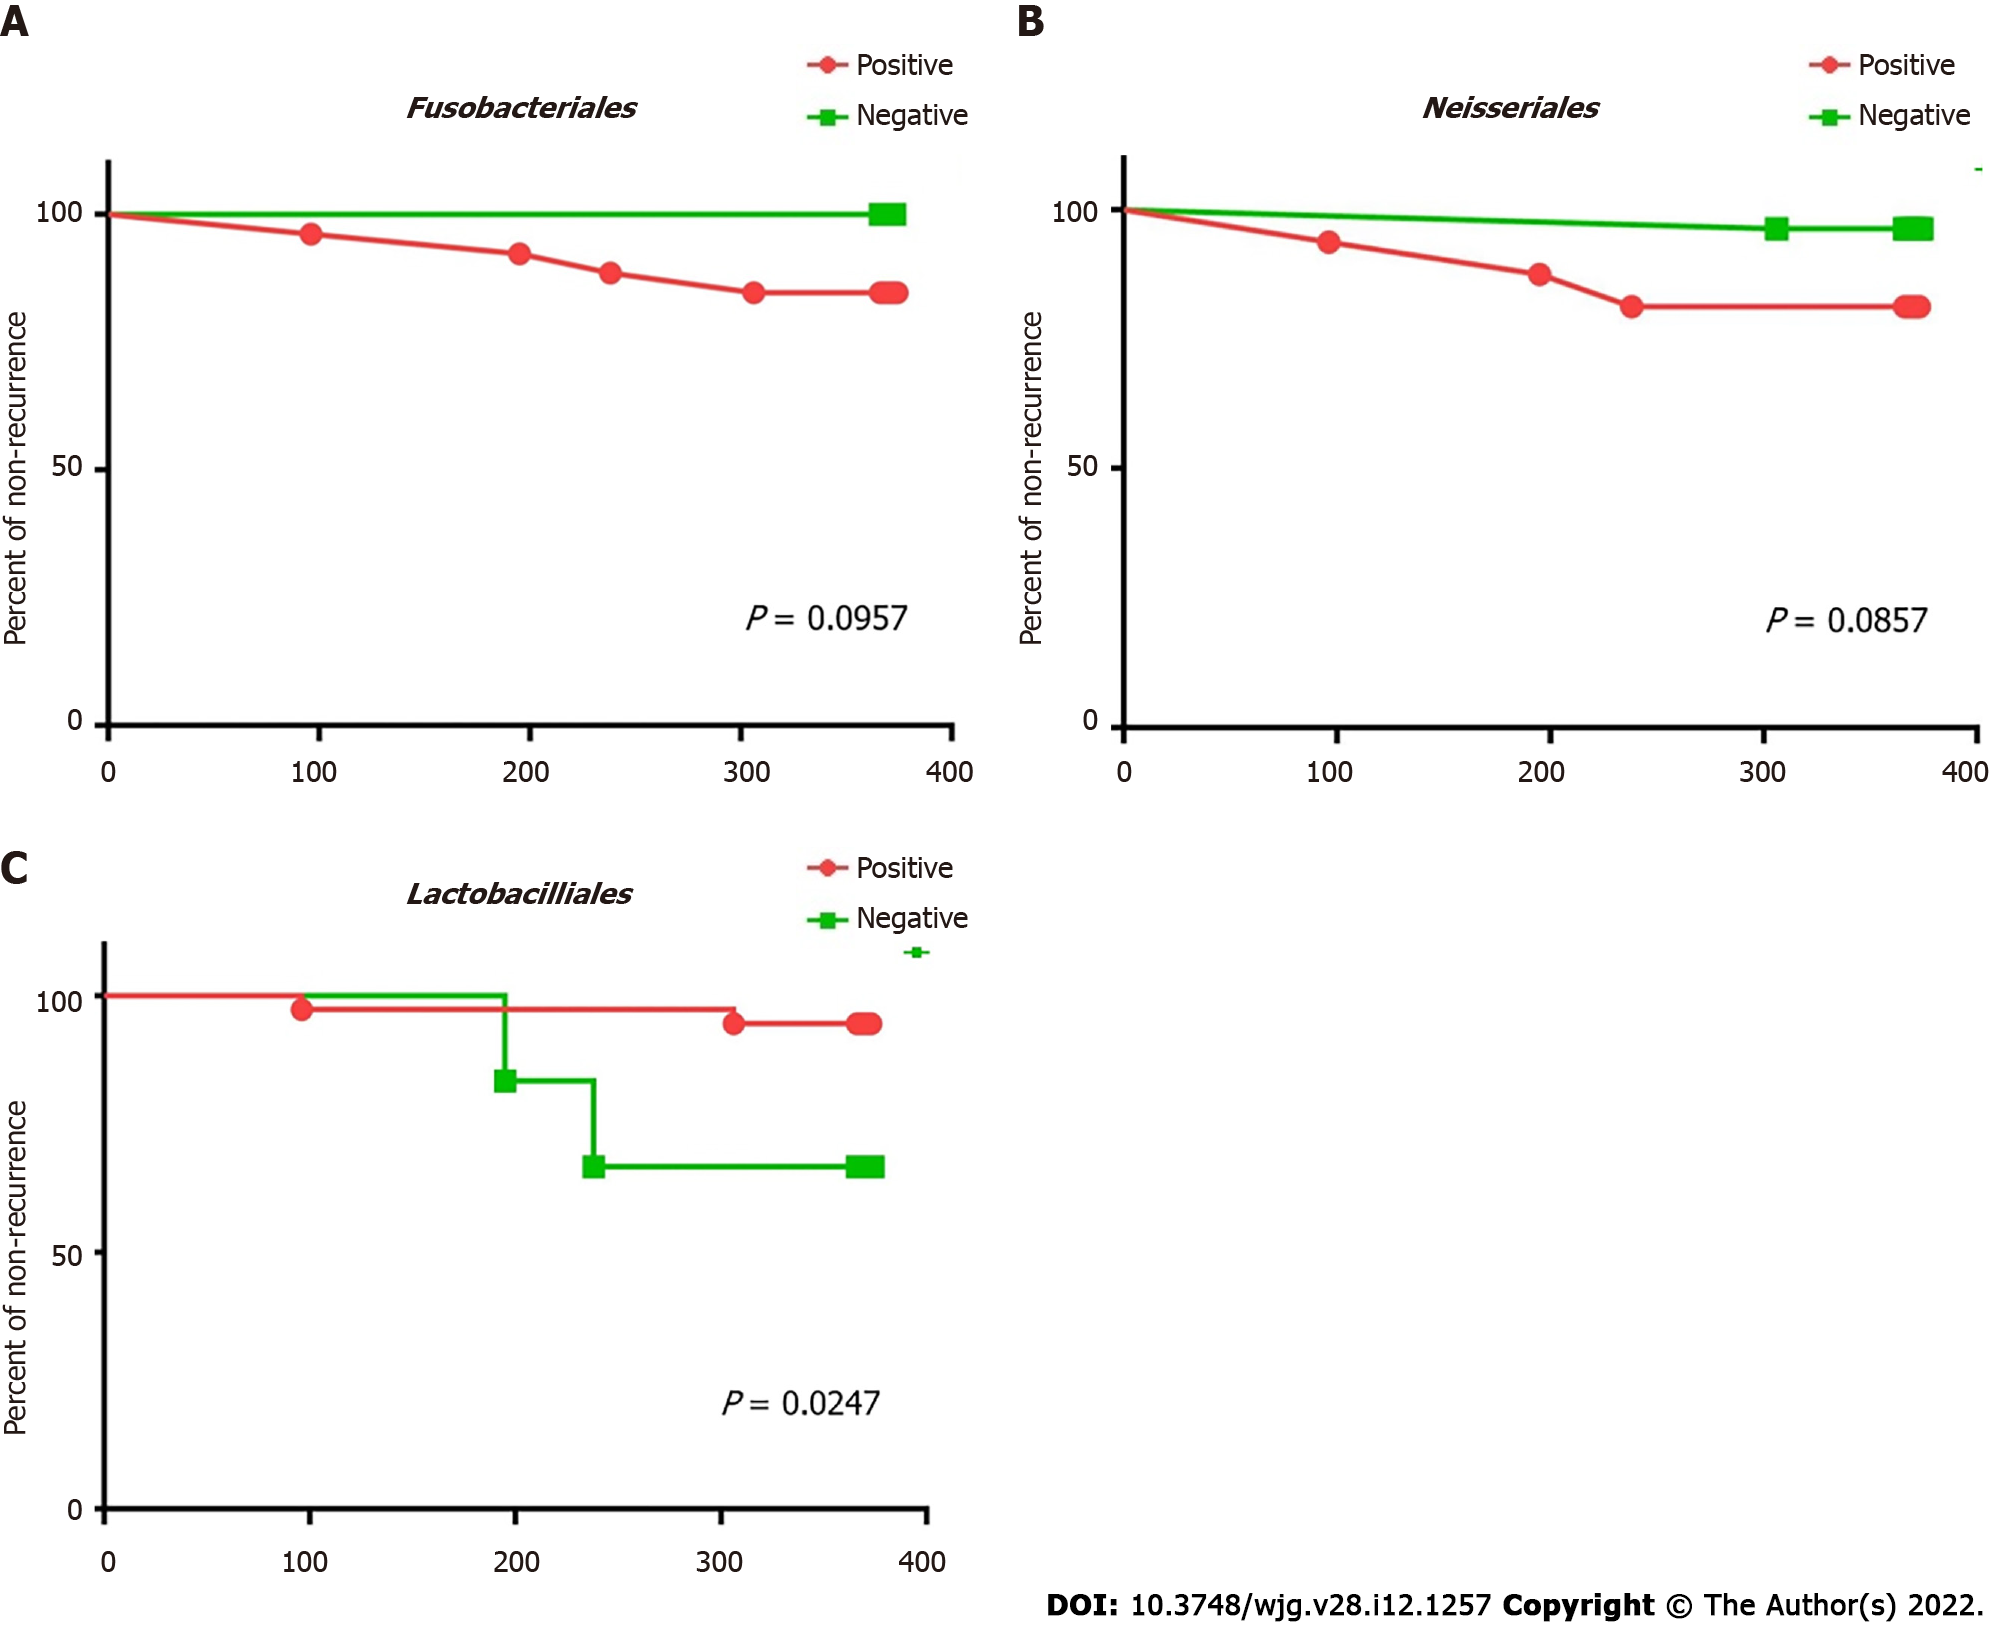
Figure 7 Kaplan-Meier analysis of recurrent time post endoscopic sphincterotomy with different microbiologic risk factors.
A: Kaplan-Meier analysis of recurrent time post-endoscopic sphincterotomy (EST) between choledocholithiasis patients with (red) and without (green) Fusobacteriales in bile; B: Kaplan-Meier analysis of recurrent time post-EST between choledocholithiasis patients with (red) and without (green) Neisseriales in bile; C: Kaplan-Meier analysis of recurrent time post-EST between choledocholithiasis patients with (red) and without (green) Lactobacillales in bile.
- Citation: Li Y, Tan WH, Wu JC, Huang ZX, Shang YY, Liang B, Chen JH, Pang R, Xie XQ, Zhang JM, Ding Y, Xue L, Chen MT, Wang J, Wu QP. Microbiologic risk factors of recurrent choledocholithiasis post-endoscopic sphincterotomy. World J Gastroenterol 2022; 28(12): 1257-1271
- URL: https://www.wjgnet.com/1007-9327/full/v28/i12/1257.htm
- DOI: https://dx.doi.org/10.3748/wjg.v28.i12.1257


