Copyright
©The Author(s) 2022.
World J Gastroenterol. Mar 28, 2022; 28(12): 1239-1256
Published online Mar 28, 2022. doi: 10.3748/wjg.v28.i12.1239
Published online Mar 28, 2022. doi: 10.3748/wjg.v28.i12.1239
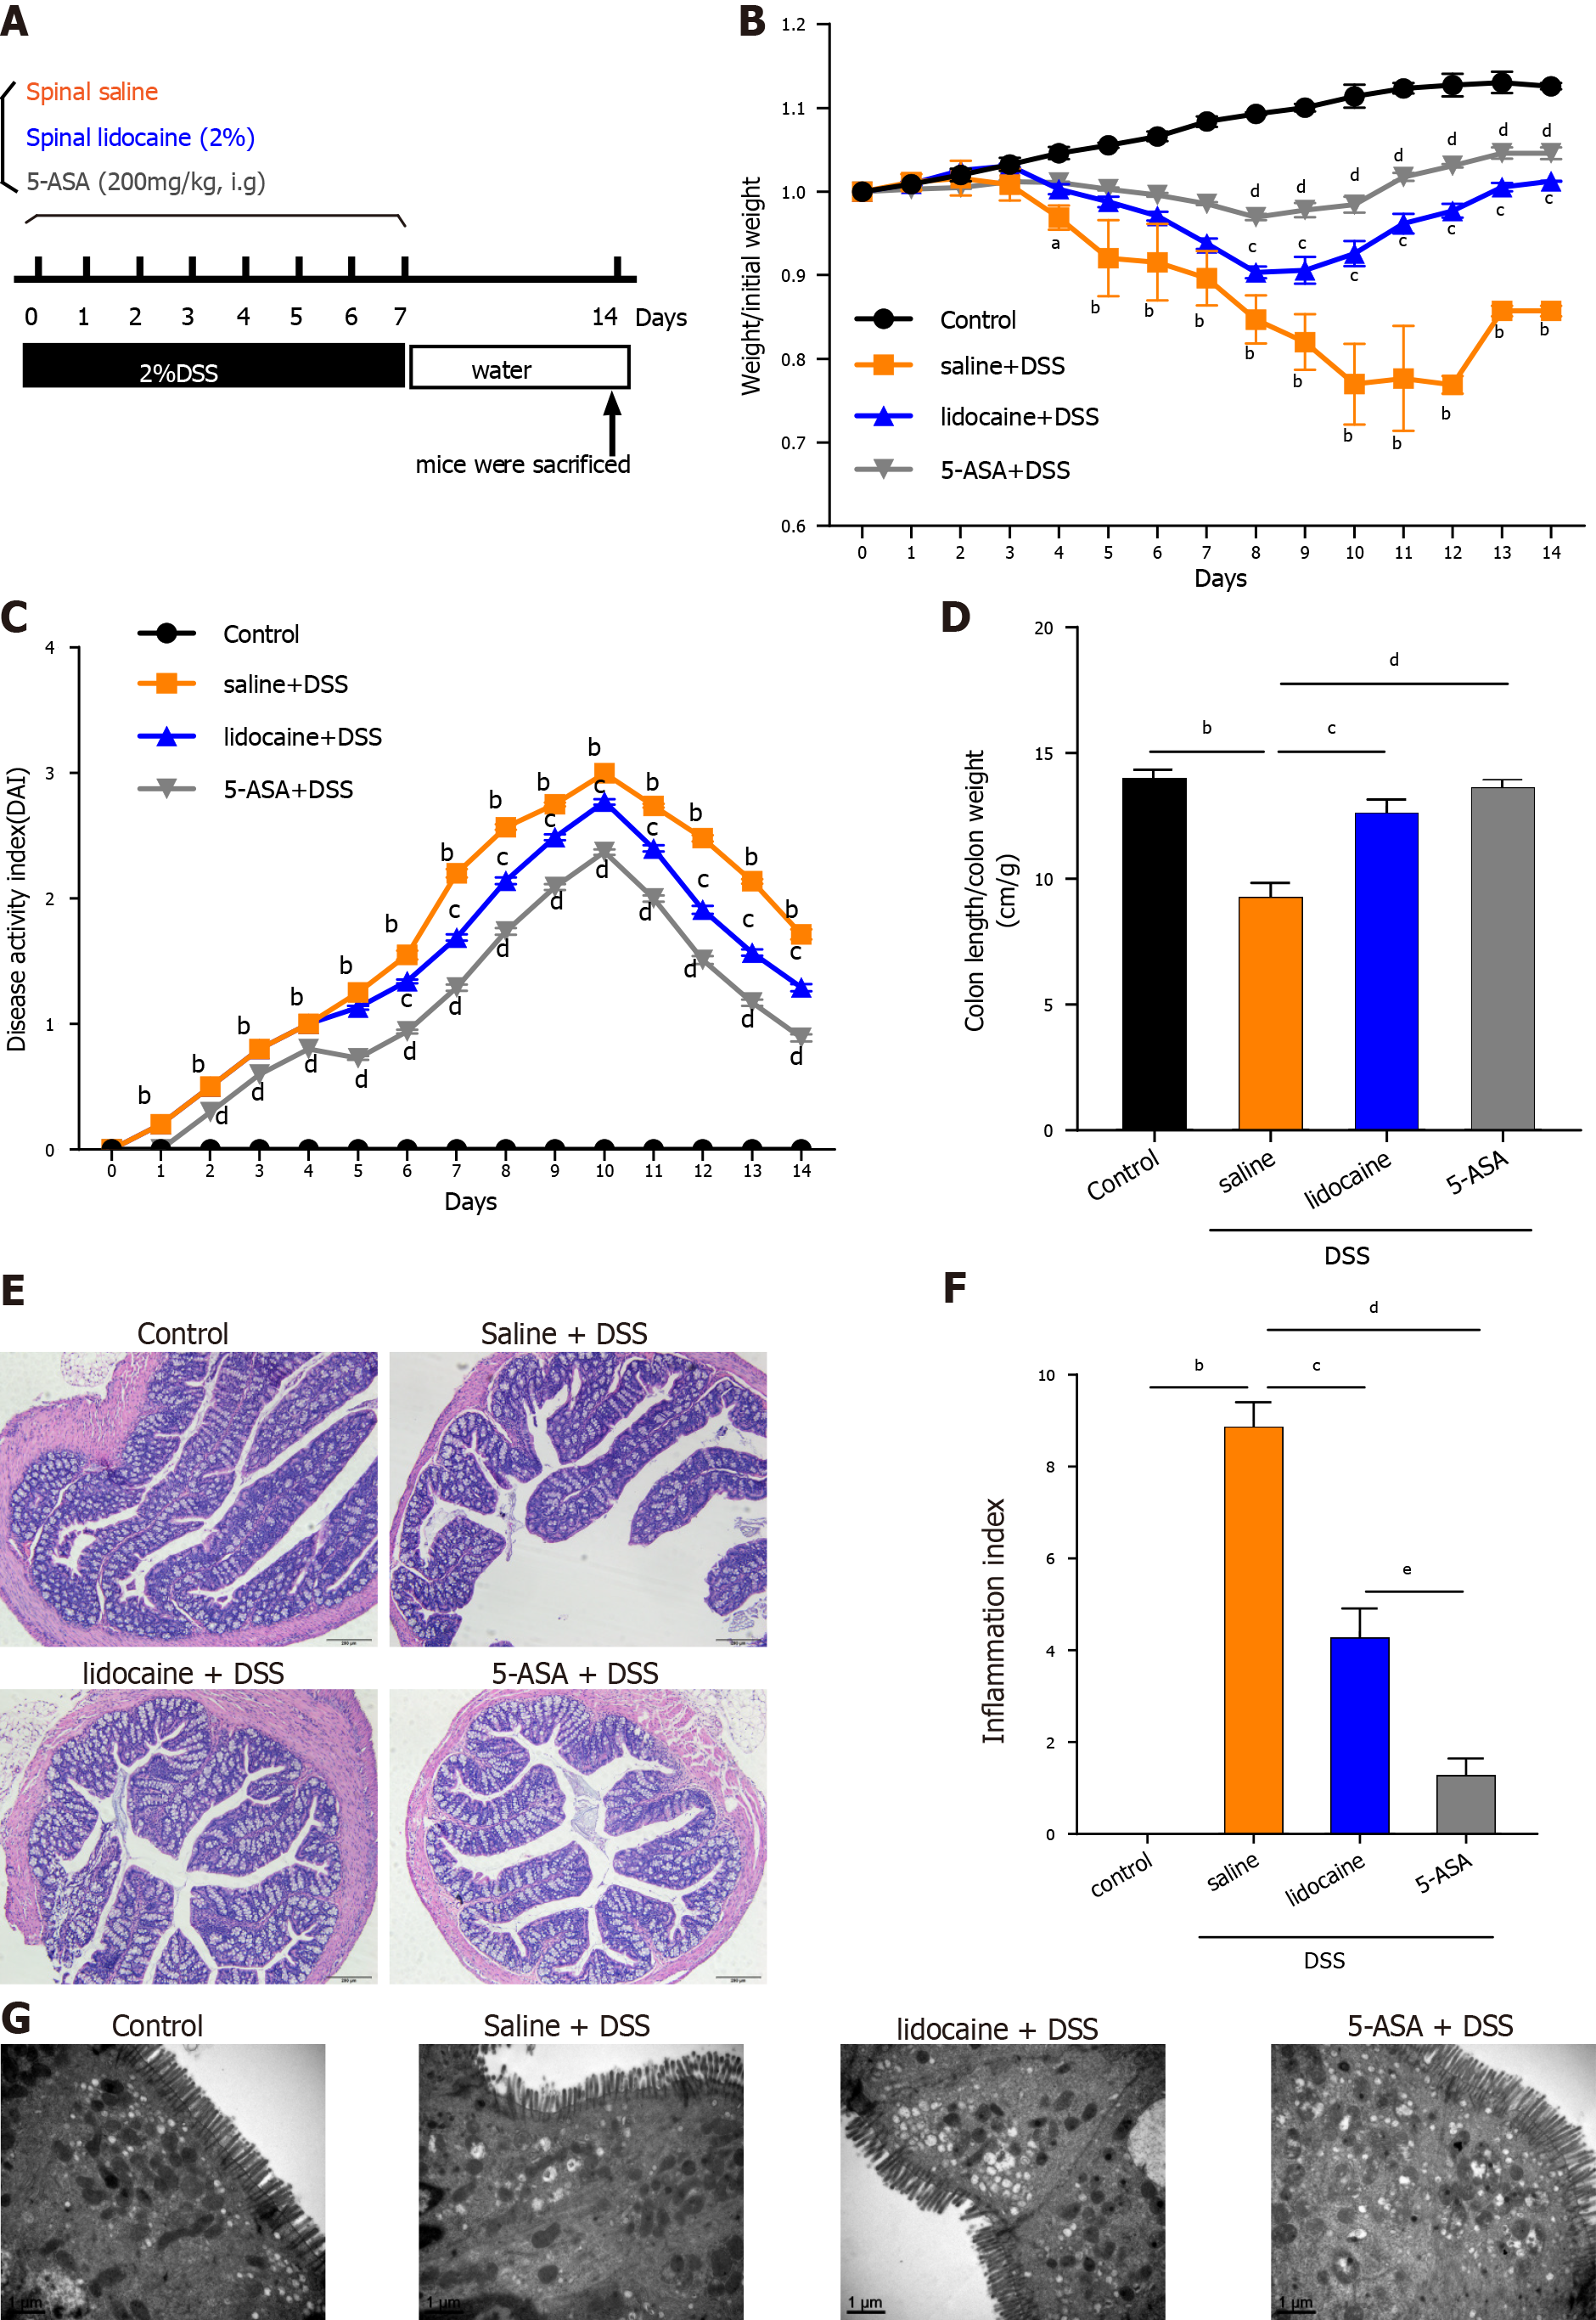
Figure 1 Spinal anesthesia alleviates dextran sodium sulfate-induced colitis.
A: Diagram of experimental design; B: Body weight; C: Disease activity index. Each group was evaluated daily (n = 10); D: Colon length of each group measured at the end of the experiment (n = 10); E: Representative images of hematoxylin and eosin staining; F: Inflammation index quantitation; G: Transmission electron microscopy. Data are presented as the mean ± SEM of three independent experiments. P-values were calculated using one-way ANOVA between different groups. aP < 0.05, control vs saline + DSS; bP < 0.01, control vs saline + DSS; cP < 0.01, saline + DSS vs lidocaine + DSS; dP < 0.01, saline + DSS vs 5-ASA + DSS; eP < 0.05, lidocaine + DSS vs 5-ASA + DSS. 5-ASA: 5-aminosalicylic acid; DSS: Dextran sodium sulfate.
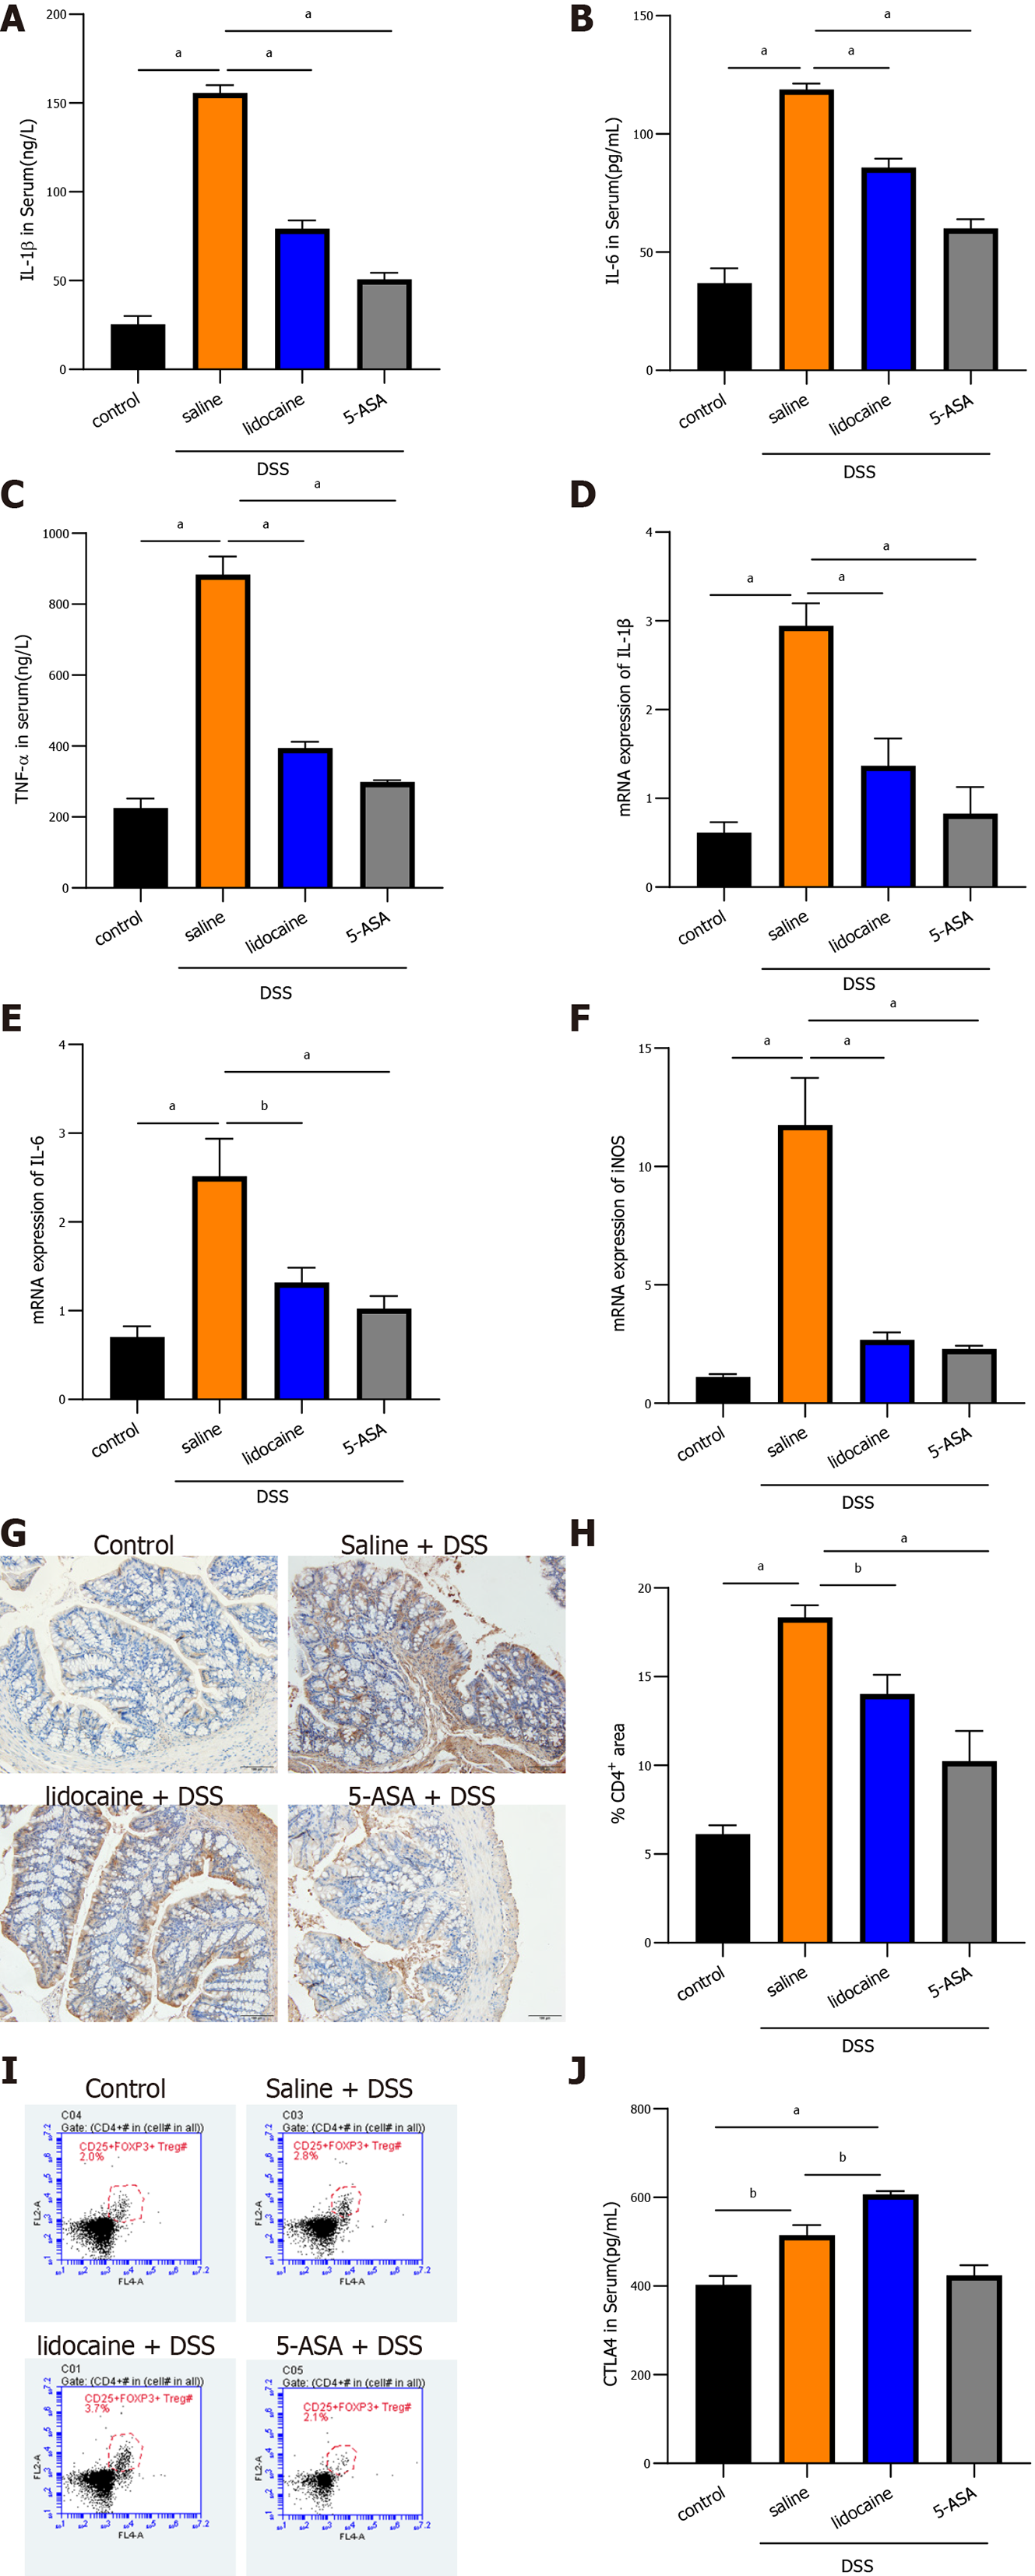
Figure 2 Spinal anesthesia relieves intestinal inflammation activated by dextran sodium sulfate.
A-C: Serum levels of interleukin (IL)-1β, IL-6, and tumor necrosis factor-alpha detected by enzyme-linked immunosorbent assay (ELISA); D-F: The mRNA expression of IL-1β, IL-6, and inducible nitric oxide synthase detected by real-time quantitative polymerase chain reaction; G: Expression of CD4 detected using immunohistochemistry; H: Quantitation of the immunohistochemistry result; I: Proportion of CD4+/CD25+/Foxp3+ Tregs analyzed by flow cytometry; J: Serum level of cytotoxic T-lymphocyte-associated protein determined by ELISA; Data are presented as the mean ± SEM of three independent experiments. P-values were calculated using one-way ANOVA between different groups. aP < 0.05, bP < 0.01. 5-ASA: 5-aminosalicylic acid; DSS: Dextran sodium sulfate; IL: Interleukin; TNF-α: Tumor necrosis factor-alpha; iNOS: Inducible nitric oxide synthase.
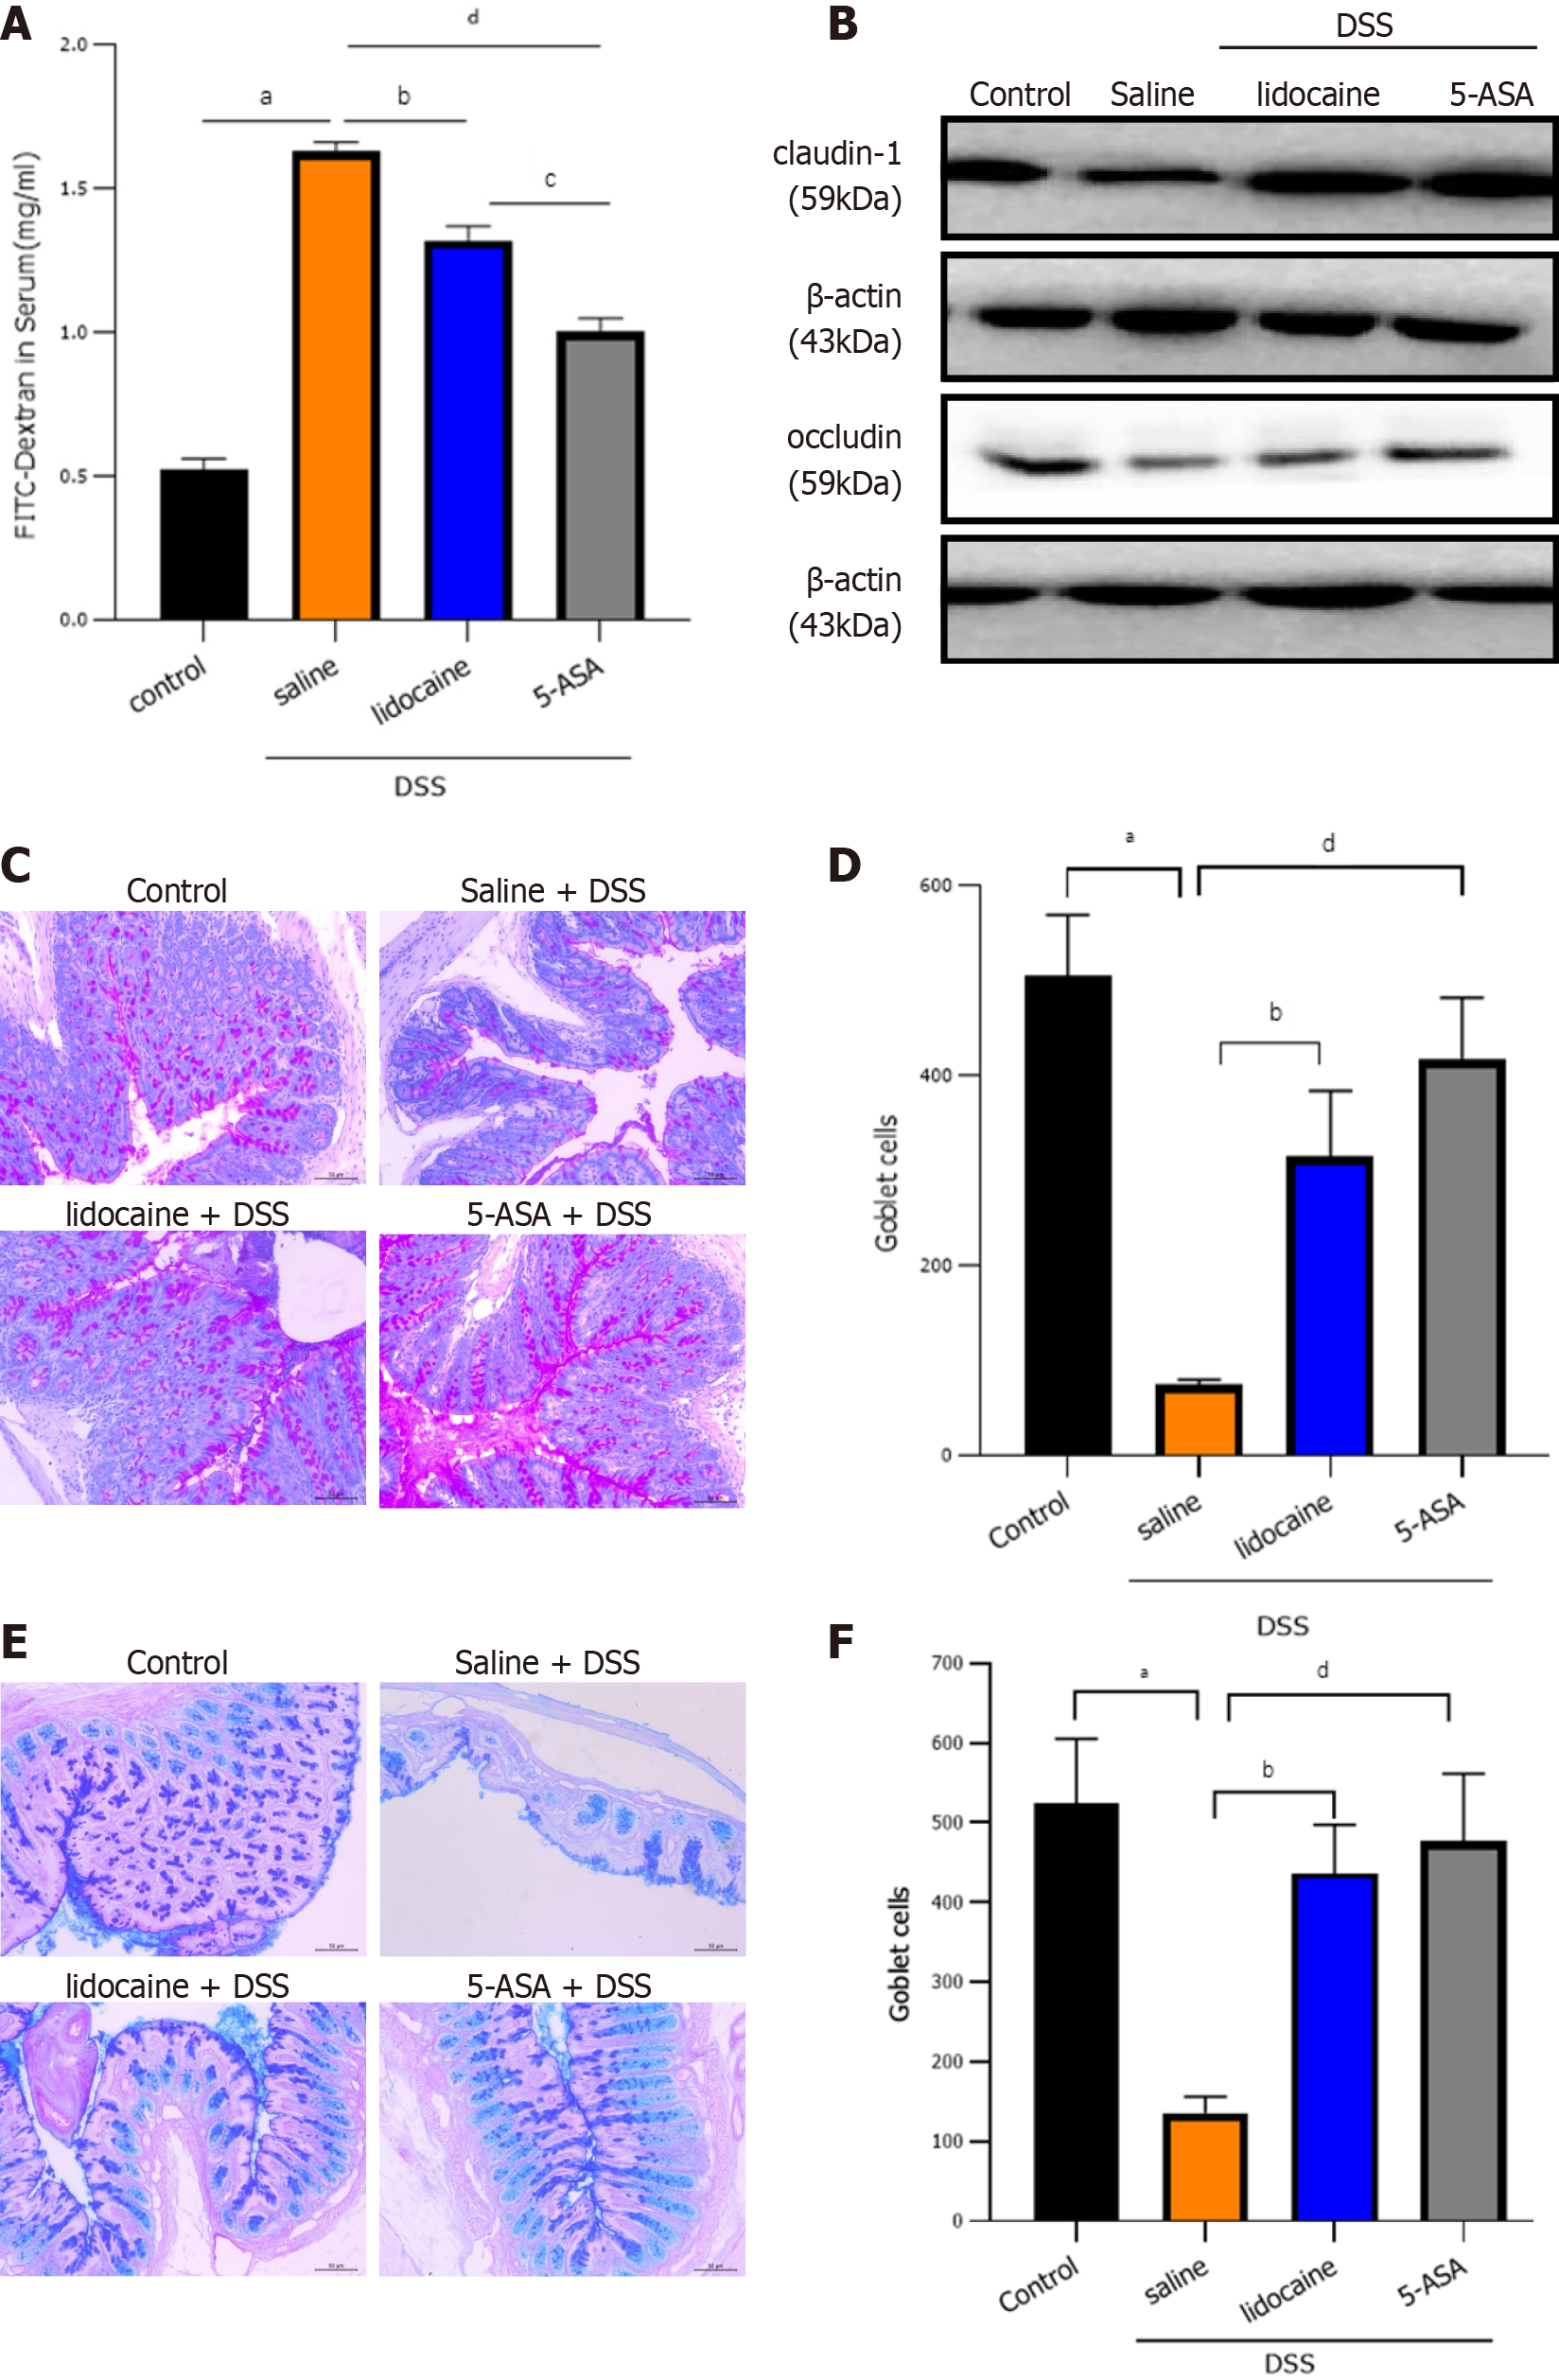
Figure 3 Spinal anesthesia with lidocaine protects the intestinal barrier.
A: Intestinal permeability tested by FITC-dextran assay; B: Western blot analysis showed the expression of claudin-1 and occludin as key tight junction proteins in each group; C: Mucins in tissue sections observed by Alcian blue staining; D: Quantitation of the Alcian blue staining result; E: Mucins in tissue sections observed by periodic acid-Schiff staining. F: Quantitation of the periodic acid-Schiff staining result. Data are presented as the mean ± SEM of three independent experiments. P-values were calculated using one-way ANOVA between different groups. aP < 0.01, control vs saline + DSS; bP < 0.01, saline + DSS vs lidocaine + DSS; cP < 0.01; lidocaine + DSS vs 5-ASA + DSS; dP < 0.01, saline + DSS vs 5-ASA + DSS. 5-ASA: 5-aminosalicylic acid; DSS: Dextran sodium sulfate.
Figure 4 Spinal anesthesia changes the intestinal microflora.
A: Cladograms (family level) of the intestinal microflora in different groups; B: Differentiating taxa (family level) of the intestinal microflora in different groups; C: Chao1 index (richness); D: Shannon index (diversity); E: Ace index; F: PCoA plots revealing specific bacterial alterations in different groups; G: Relative abundance plots showing community variation in various groups; H: Abundance of Bacteroidetes in different groups; I: Abundance of Verrucomicrobia in different groups; J: Abundance of Proteobacteria in different groups; K: Abundance of Firmicutes in different groups. Statistical significance and variance of Bray-Curtis dissimilarity data were assessed using PERMANOVA; alpha diversity data are represented as the mean ± SEM, and statistical significance was assessed using t tests. n = 3 mice per group. P values were calculated using one-way ANOVA between different groups. aP < 0.01, saline + DSS vs lidocaine + DSS; bP < 0.01, control vs saline + DSS. 5-ASA: 5-aminosalicylic acid; DSS: Dextran sodium sulfate.
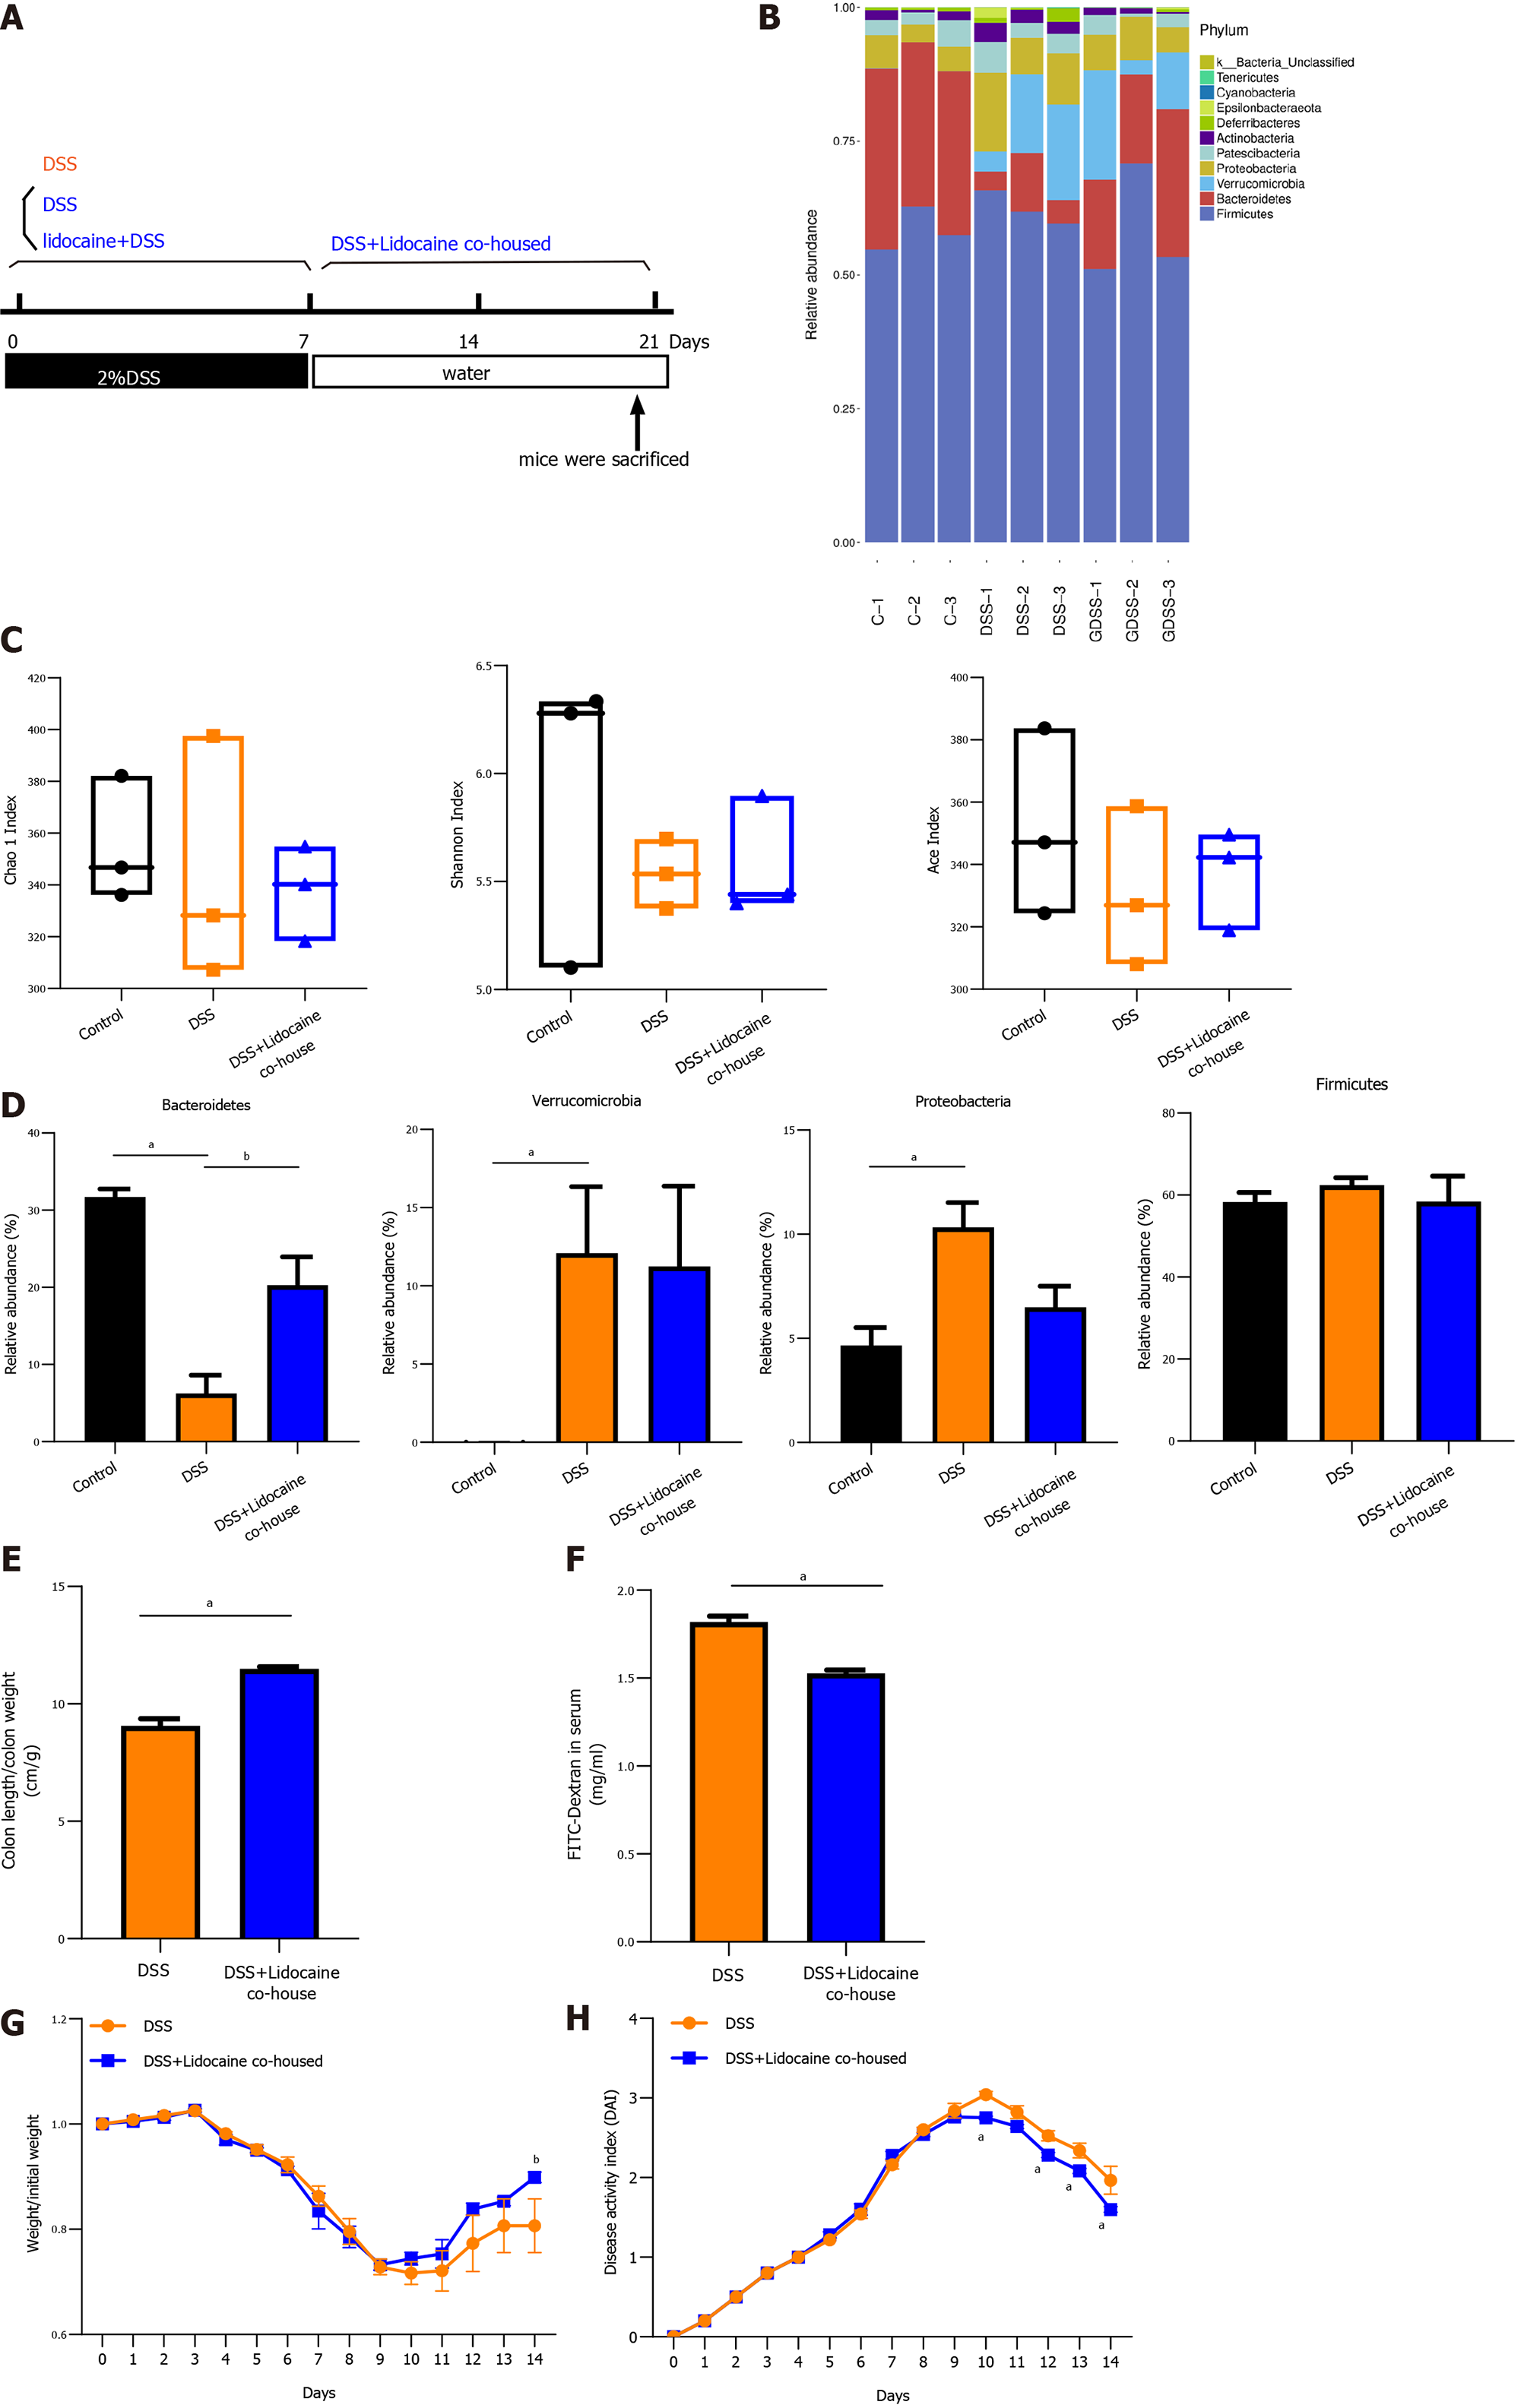
Figure 5 Cohousing alleviates dextran sodium sulfate-induced colitis in mice.
C57BL/6 mice were divided into four groups: A normal control group (n = 3), a no-cohousing dextran sodium sulfate (DSS) group (n = 3), a cohousing DSS group (n = 3), and a cohousing lidocaine + DSS group (n = 3). The DSS group and lidocaine + DSS group were treated with DSS. The cohousing DSS group and the cohousing lidocaine group were transferred to fresh cages. A: Diagram of experimental design; B: Relative abundance plots showing community variation in various groups; C: Alpha diversity calculated using Chao1 index (richness), Shannon index (diversity), and Ace index; D: Abundance of Bacteroidetes, Verrucomicrobia, Proteobacteria, and Firmicutes in different groups; E: Colon length; F: Intestinal permeability compared between cohousing DSS mice (n = 6) and no-cohousing DSS mice (n = 6); G: Body weight; H: Disease activity index compared between cohousing DSS mice (n = 6) and no-cohousing DSS mice (n = 6). Data are presented as the mean ± SEM of three independent experiments. P-values were calculated using one-way ANOVA between different groups. aP < 0.05, bP < 0.01. Statistical significance and variance of Bray-Curtis dissimilarity data were assessed using PERMANOVA; alpha diversity data are represented as the mean ± SEM, and statistical significance was assessed using t tests. n = 3 mice per group. 5-ASA: 5-aminosalicylic acid; DSS: Dextran sodium sulfate.
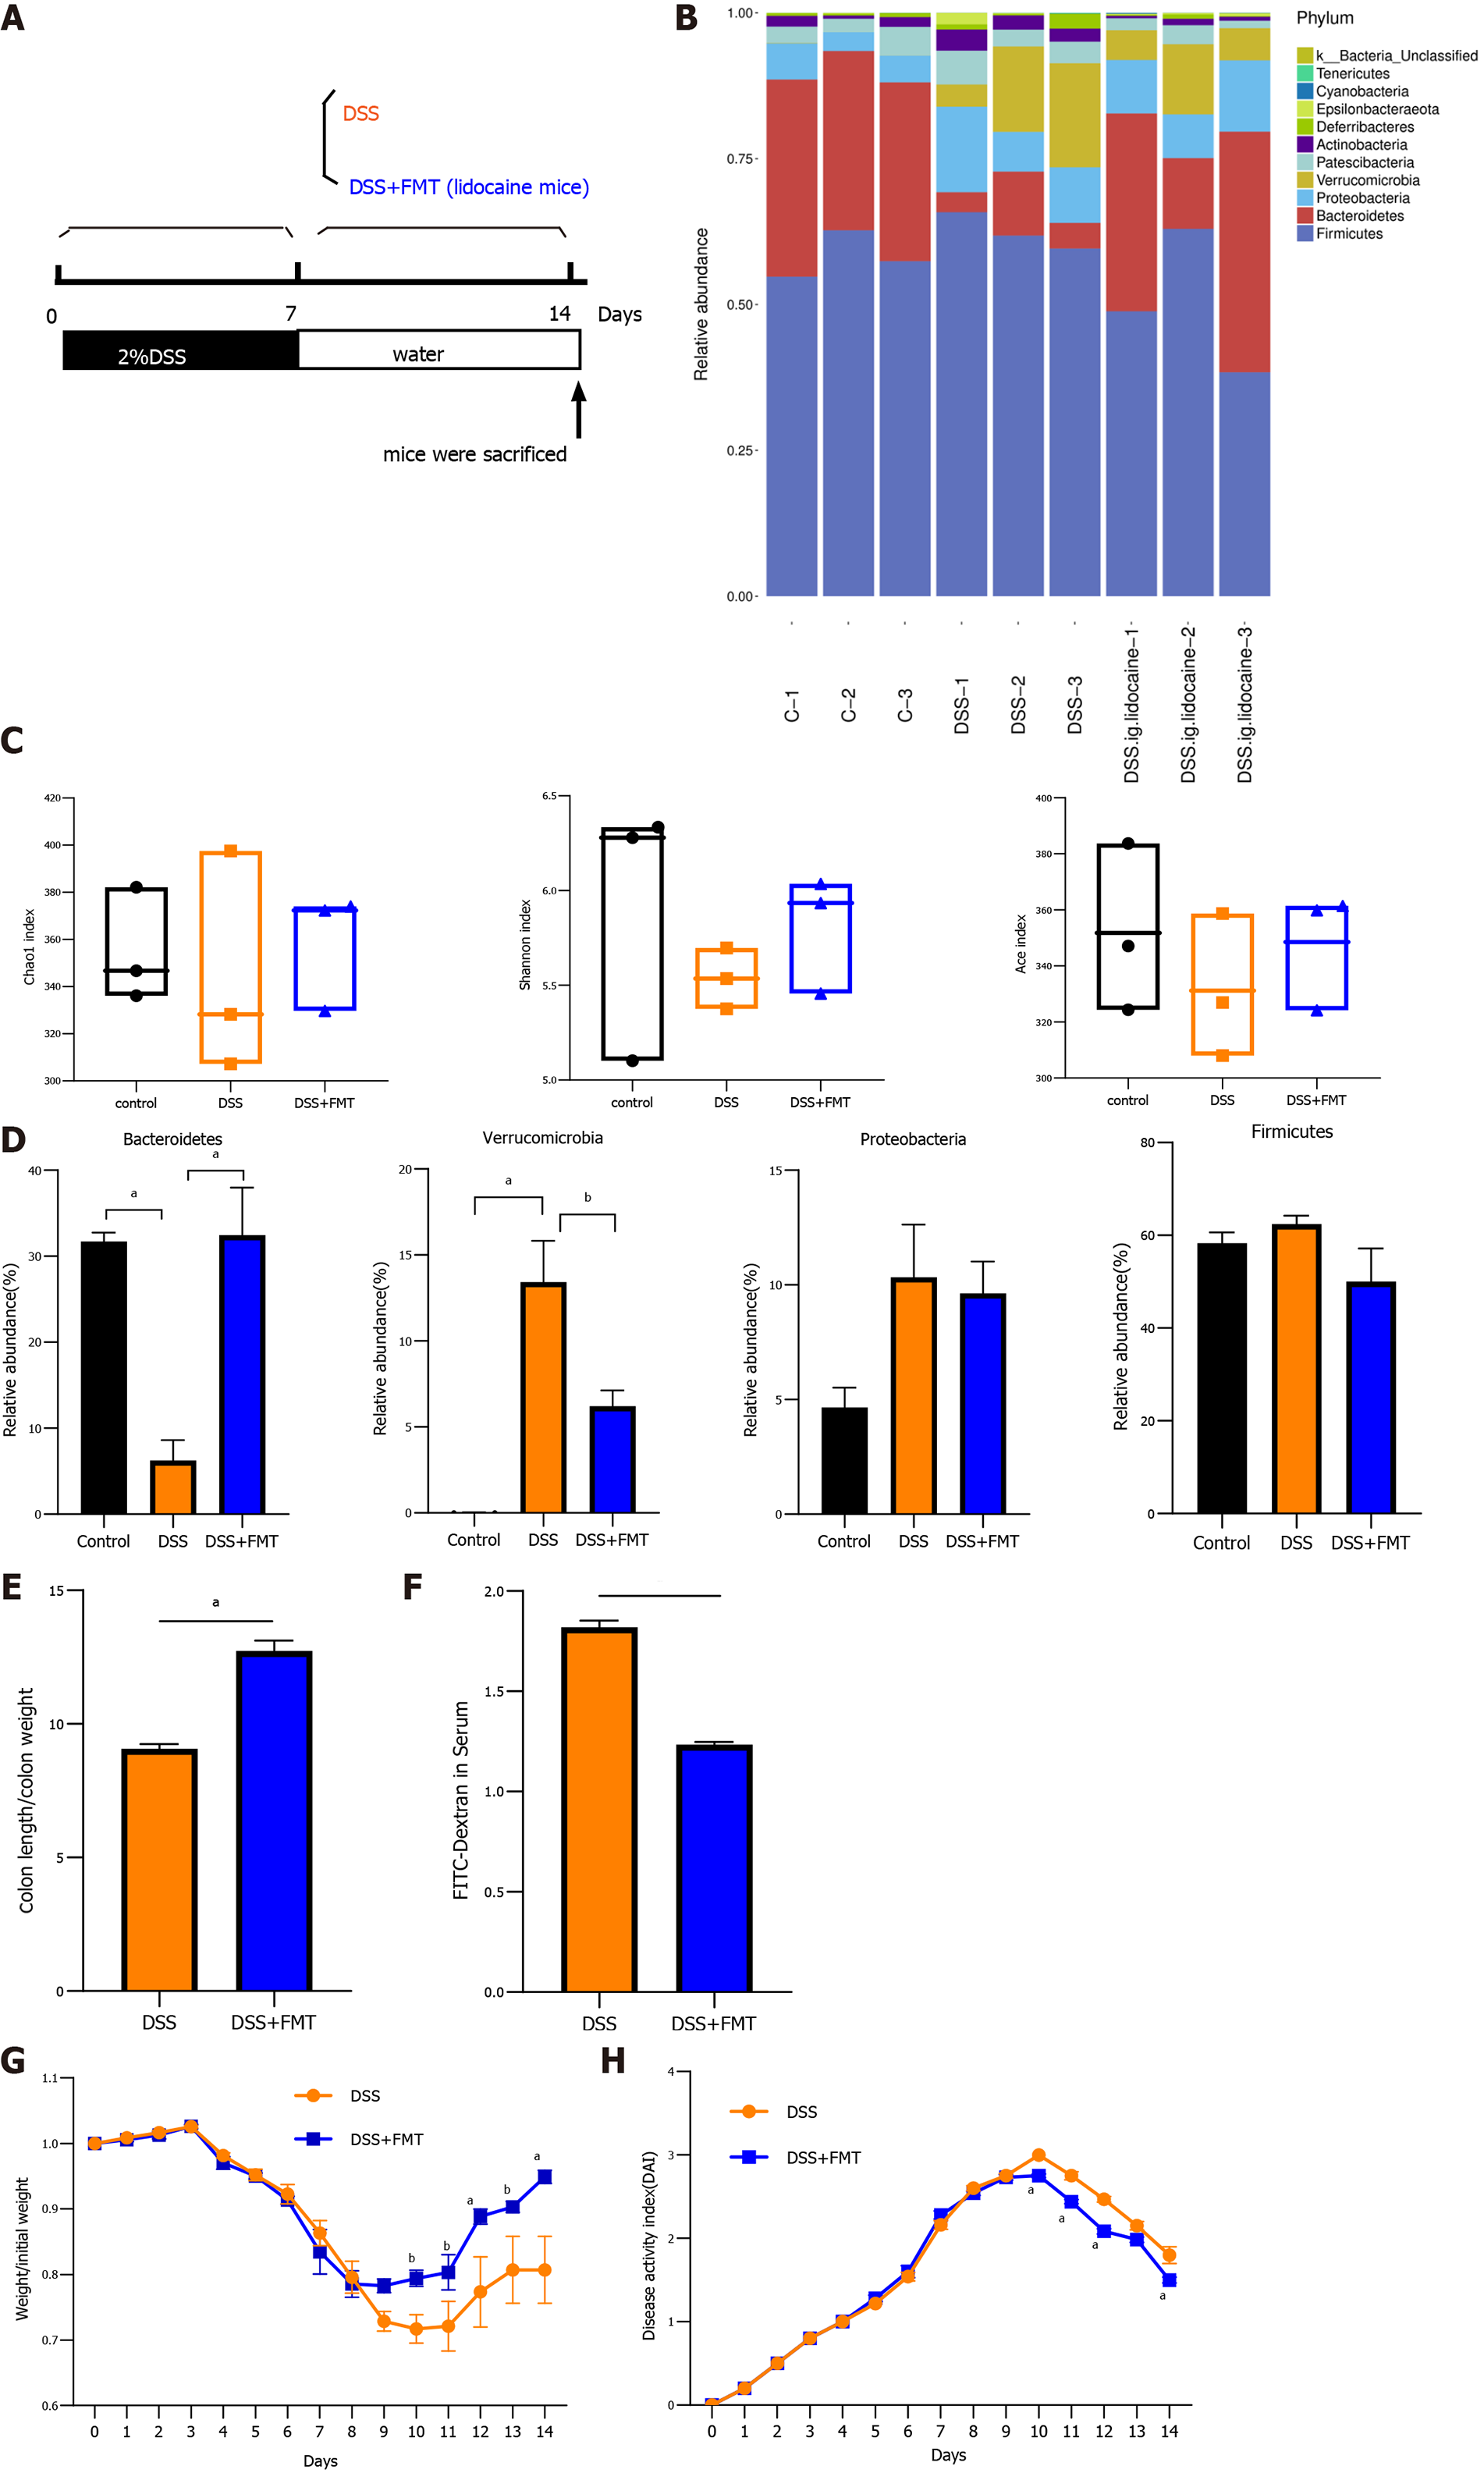
Figure 6 Transplantation of fecal microbiota from lidocaine-treated mice alleviates dextran sodium sulfate-induced colitis.
C57BL/6 mice were exposed to dextran sodium sulfate (DSS) for 7 d and then randomly separated into either a fecal microbiota transplantation (FMT) group or a DSS group. The FMT and DSS groups were gavaged with fecal microbiota (from lidocaine mice) and phosphate-buffered saline, respectively. A: Diagram of experimental design; B: Relative abundance plots showing community variation in various groups; C: Alpha diversity calculated using Chao1 index (richness), Shannon index (diversity), and Ace index ; D: Abundance of Bacteroidetes, Verrucomicrobia, Proteobacteria, and Firmicutes in different groups; E: Colon length compared between DSS mice (n = 6) and FMT + DSS mice (n = 6); F: Permeability compared between DSS mice (n = 6) and FMT + DSS mice (n = 6); G: Body weight compared between DSS mice (n = 6) and FMT + DSS mice (n = 6); H: Disease activity index compared between DSS mice (n = 6) and FMT + DSS mice (n = 6). Data are presented as the mean ± SEM of three independent experiments. P-values were calculated using one-way ANOVA between different groups. aP < 0.05, bP < 0.01. Statistical significance and variance of Bray-Curtis dissimilarity data were assessed using PERMANOVA; alpha diversity data are represented as the mean ± SEM, and statistical significance was assessed using t tests, n = 3 mice per group. 5-ASA: 5-aminosalicylic acid; DSS: Dextran sodium sulfate.
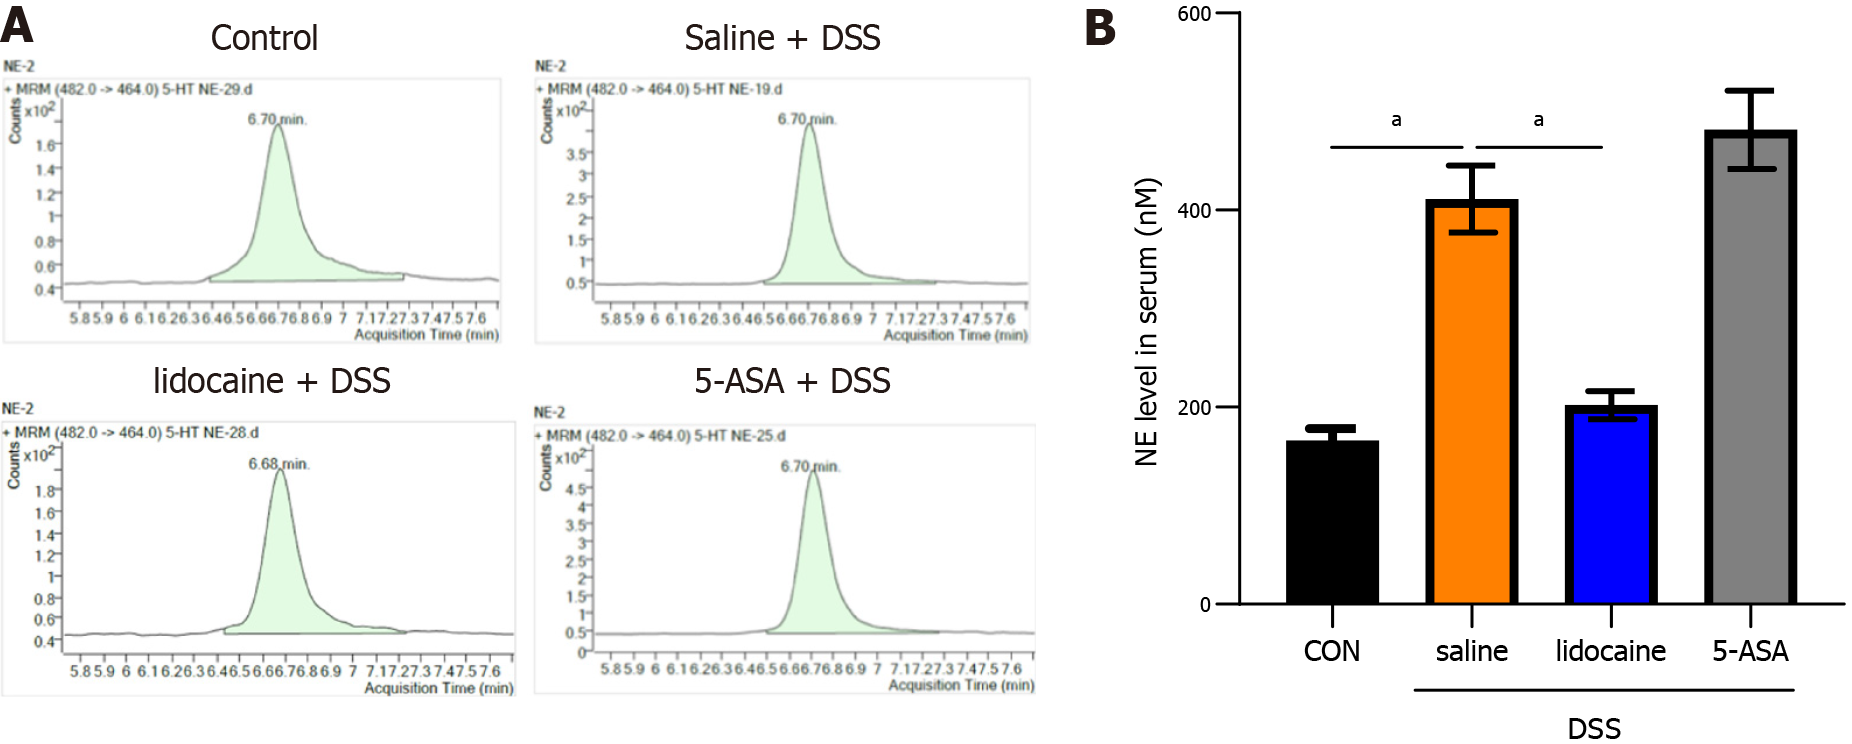
Figure 7 Spinal anesthesia decreases the noradrenaline level induced by dextran sodium sulfate.
At the end of the experiment, according to Figure 1A, the serum of mice in each group was collected. A: Noradrenaline level measured by high performance liquid chromatography (HPLC); B: Quantitation of the HPLC result. Data are presented as the mean ± SEM of three independent experiments. P values were calculated using one-way ANOVA between different groups. aP < 0.05. 5-ASA: 5-aminosalicylic acid; DSS: Dextran sodium sulfate.
- Citation: Hong Y, Zhao J, Chen YR, Huang ZH, Hou LD, Shen B, Xin Y. Spinal anesthesia alleviates dextran sodium sulfate-induced colitis by modulating the gut microbiota. World J Gastroenterol 2022; 28(12): 1239-1256
- URL: https://www.wjgnet.com/1007-9327/full/v28/i12/1239.htm
- DOI: https://dx.doi.org/10.3748/wjg.v28.i12.1239


