Copyright
©The Author(s) 2022.
World J Gastroenterol. Jan 7, 2022; 28(1): 123-139
Published online Jan 7, 2022. doi: 10.3748/wjg.v28.i1.123
Published online Jan 7, 2022. doi: 10.3748/wjg.v28.i1.123
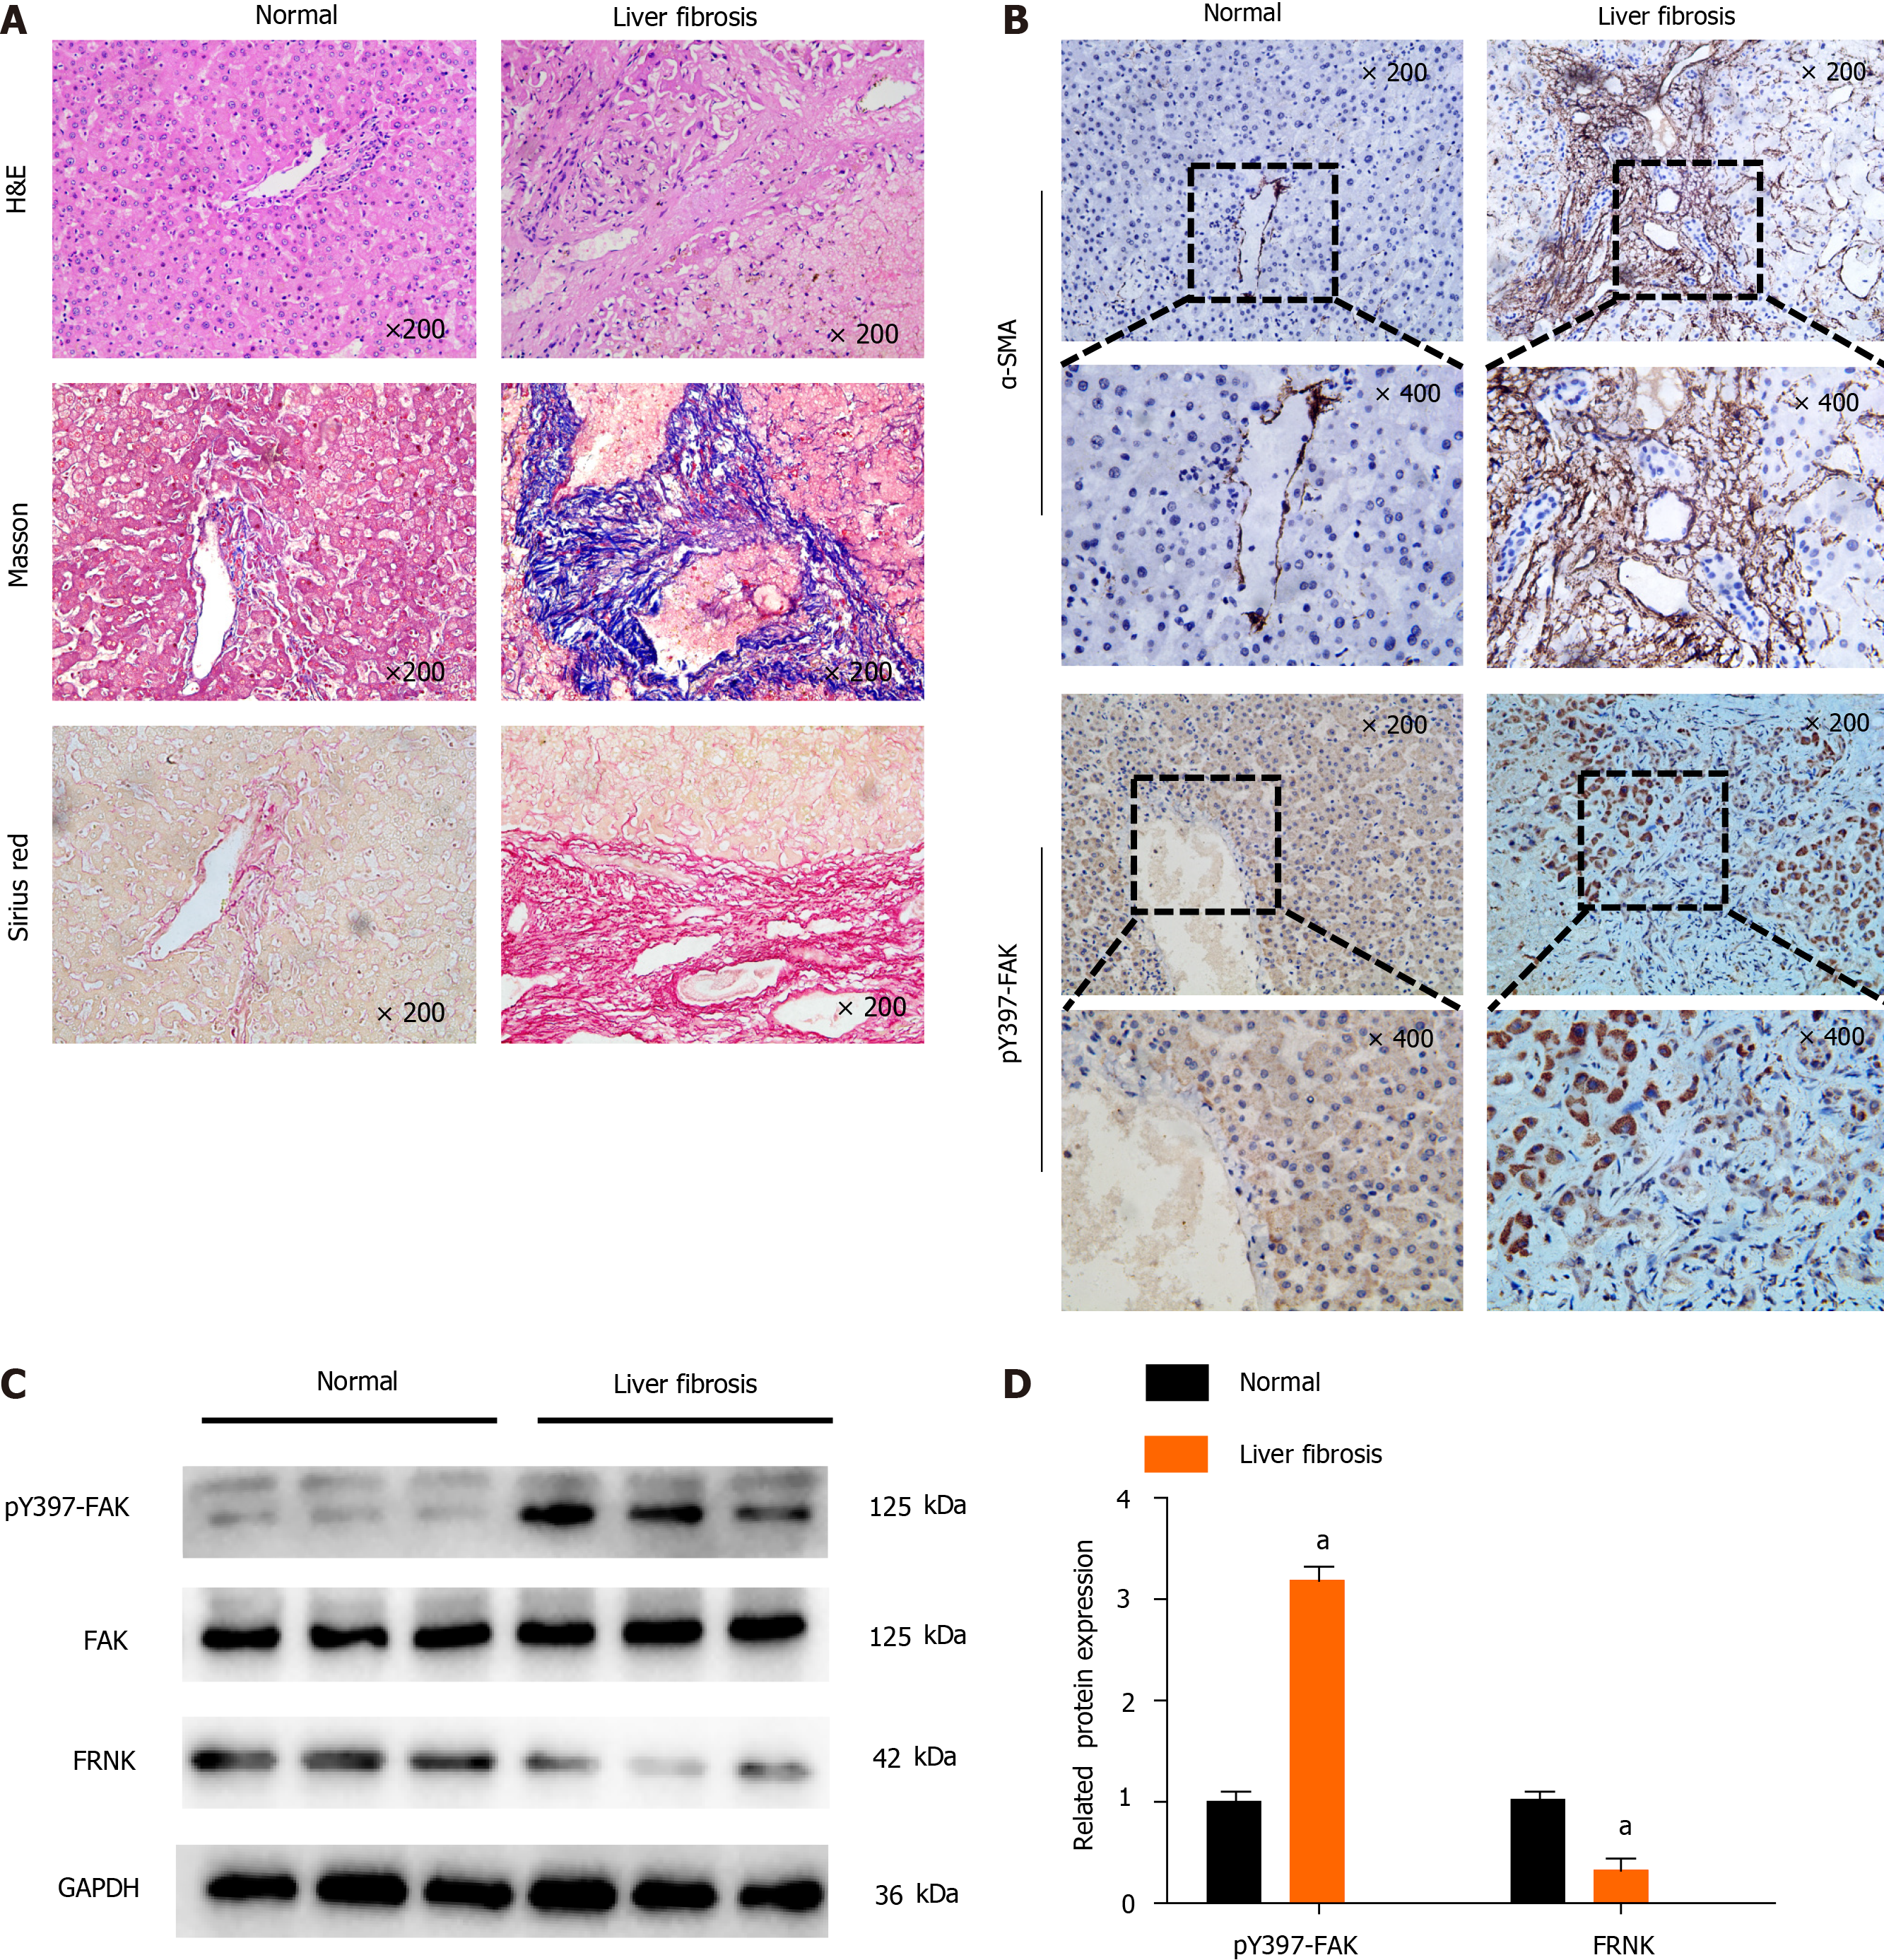
Figure 1 Tyrosine phosphorylation at position 397 of FAK is upregulated, while FRNK expression is downregulated in human fibrotic liver tissue.
A: H&E, Masson’s trichrome and Sirius Red staining were performed after liver biopsy to assess the tissues of normal subjects and patients with liver fibrosis under a light microscope at 200× magnification; B: Immunohistochemistry showed changes in the expression of α-smooth muscle actin (α-SMA) and tyrosine phosphorylation at position 397 of FAK(pY397-FAK) in the livers of normal subjects compared with patients with liver fibrosis under a light microscope at 200× or 400× magnification; C and D: Protein expression in biopsy tissues was analyzed using Western blotting. Representative results from three independent replicate assays are shown. aP < 0.05. Data are presented as the mean ± SD. FAK: Focal adhesion kinase; FRNK: Focal adhesion kinase-related non-kinase; GAPDH: Glyceraldehyde 3-phosphate dehydrogenase.
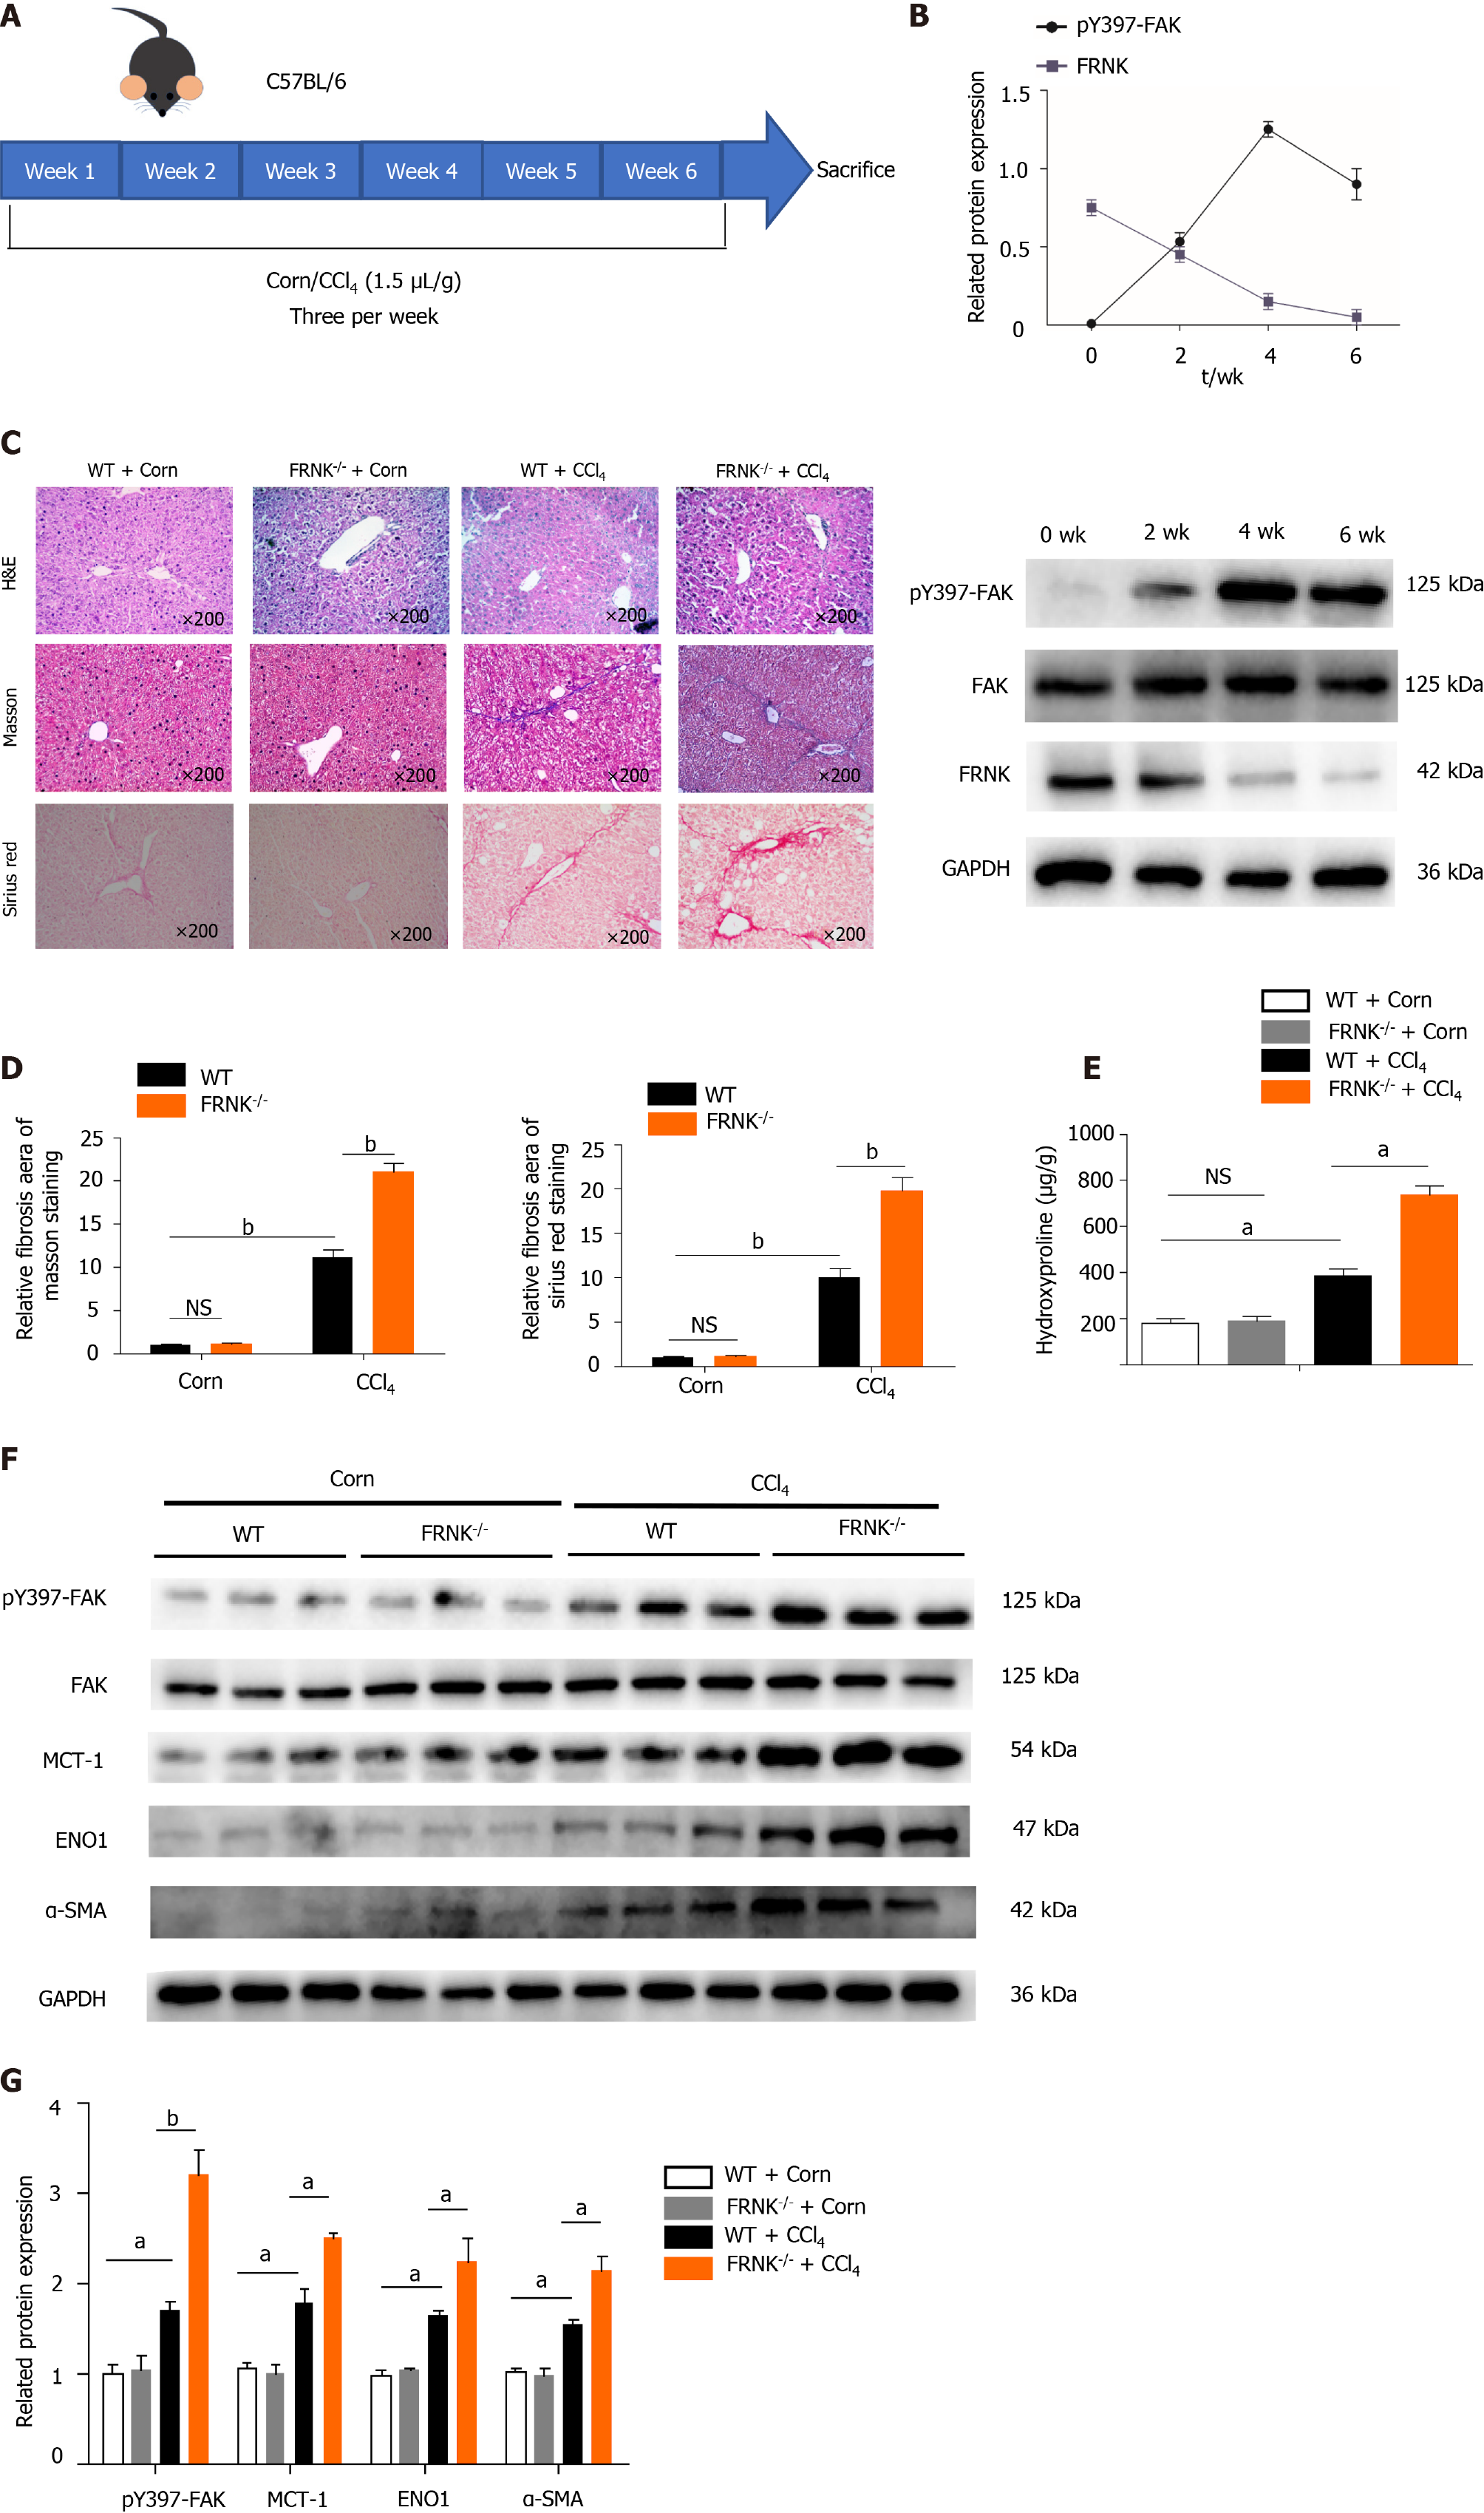
Figure 2 Liver fibrosis in mice was aggravated after FRNK knockout.
A and B: WT mice were modeled for 6 wk, pY397-FAK and FRNK protein expression levels in vivo was measured using Western blotting every fortnight; C and D: FRNK-/- and WT mice were used to establish a liver fibrosis model by administering CCl4 (1.5 μL/g), and liver tissues from these mice were stained with H&E, Masson’s trichrome, and Sirius Red after 4 wk and observed under a light microscope × 200 magnification. The relative fibrotic areas were analyzed; E: The hydroxyproline content in liver tissues from the liver fibrosis model was also measured; F and G: Western blotting was used to detect the relative expression of proteins in the liver fibrosis model established with FRNK-/- mice and WT mice. Representative results from three independent replicate assays are shown (n = 6). aP < 0.05 and bP < 0.01. Data are presented as the mean ± SD. MCT-1: Monocarboxylate transporter-1; ENO1: Enolase1.
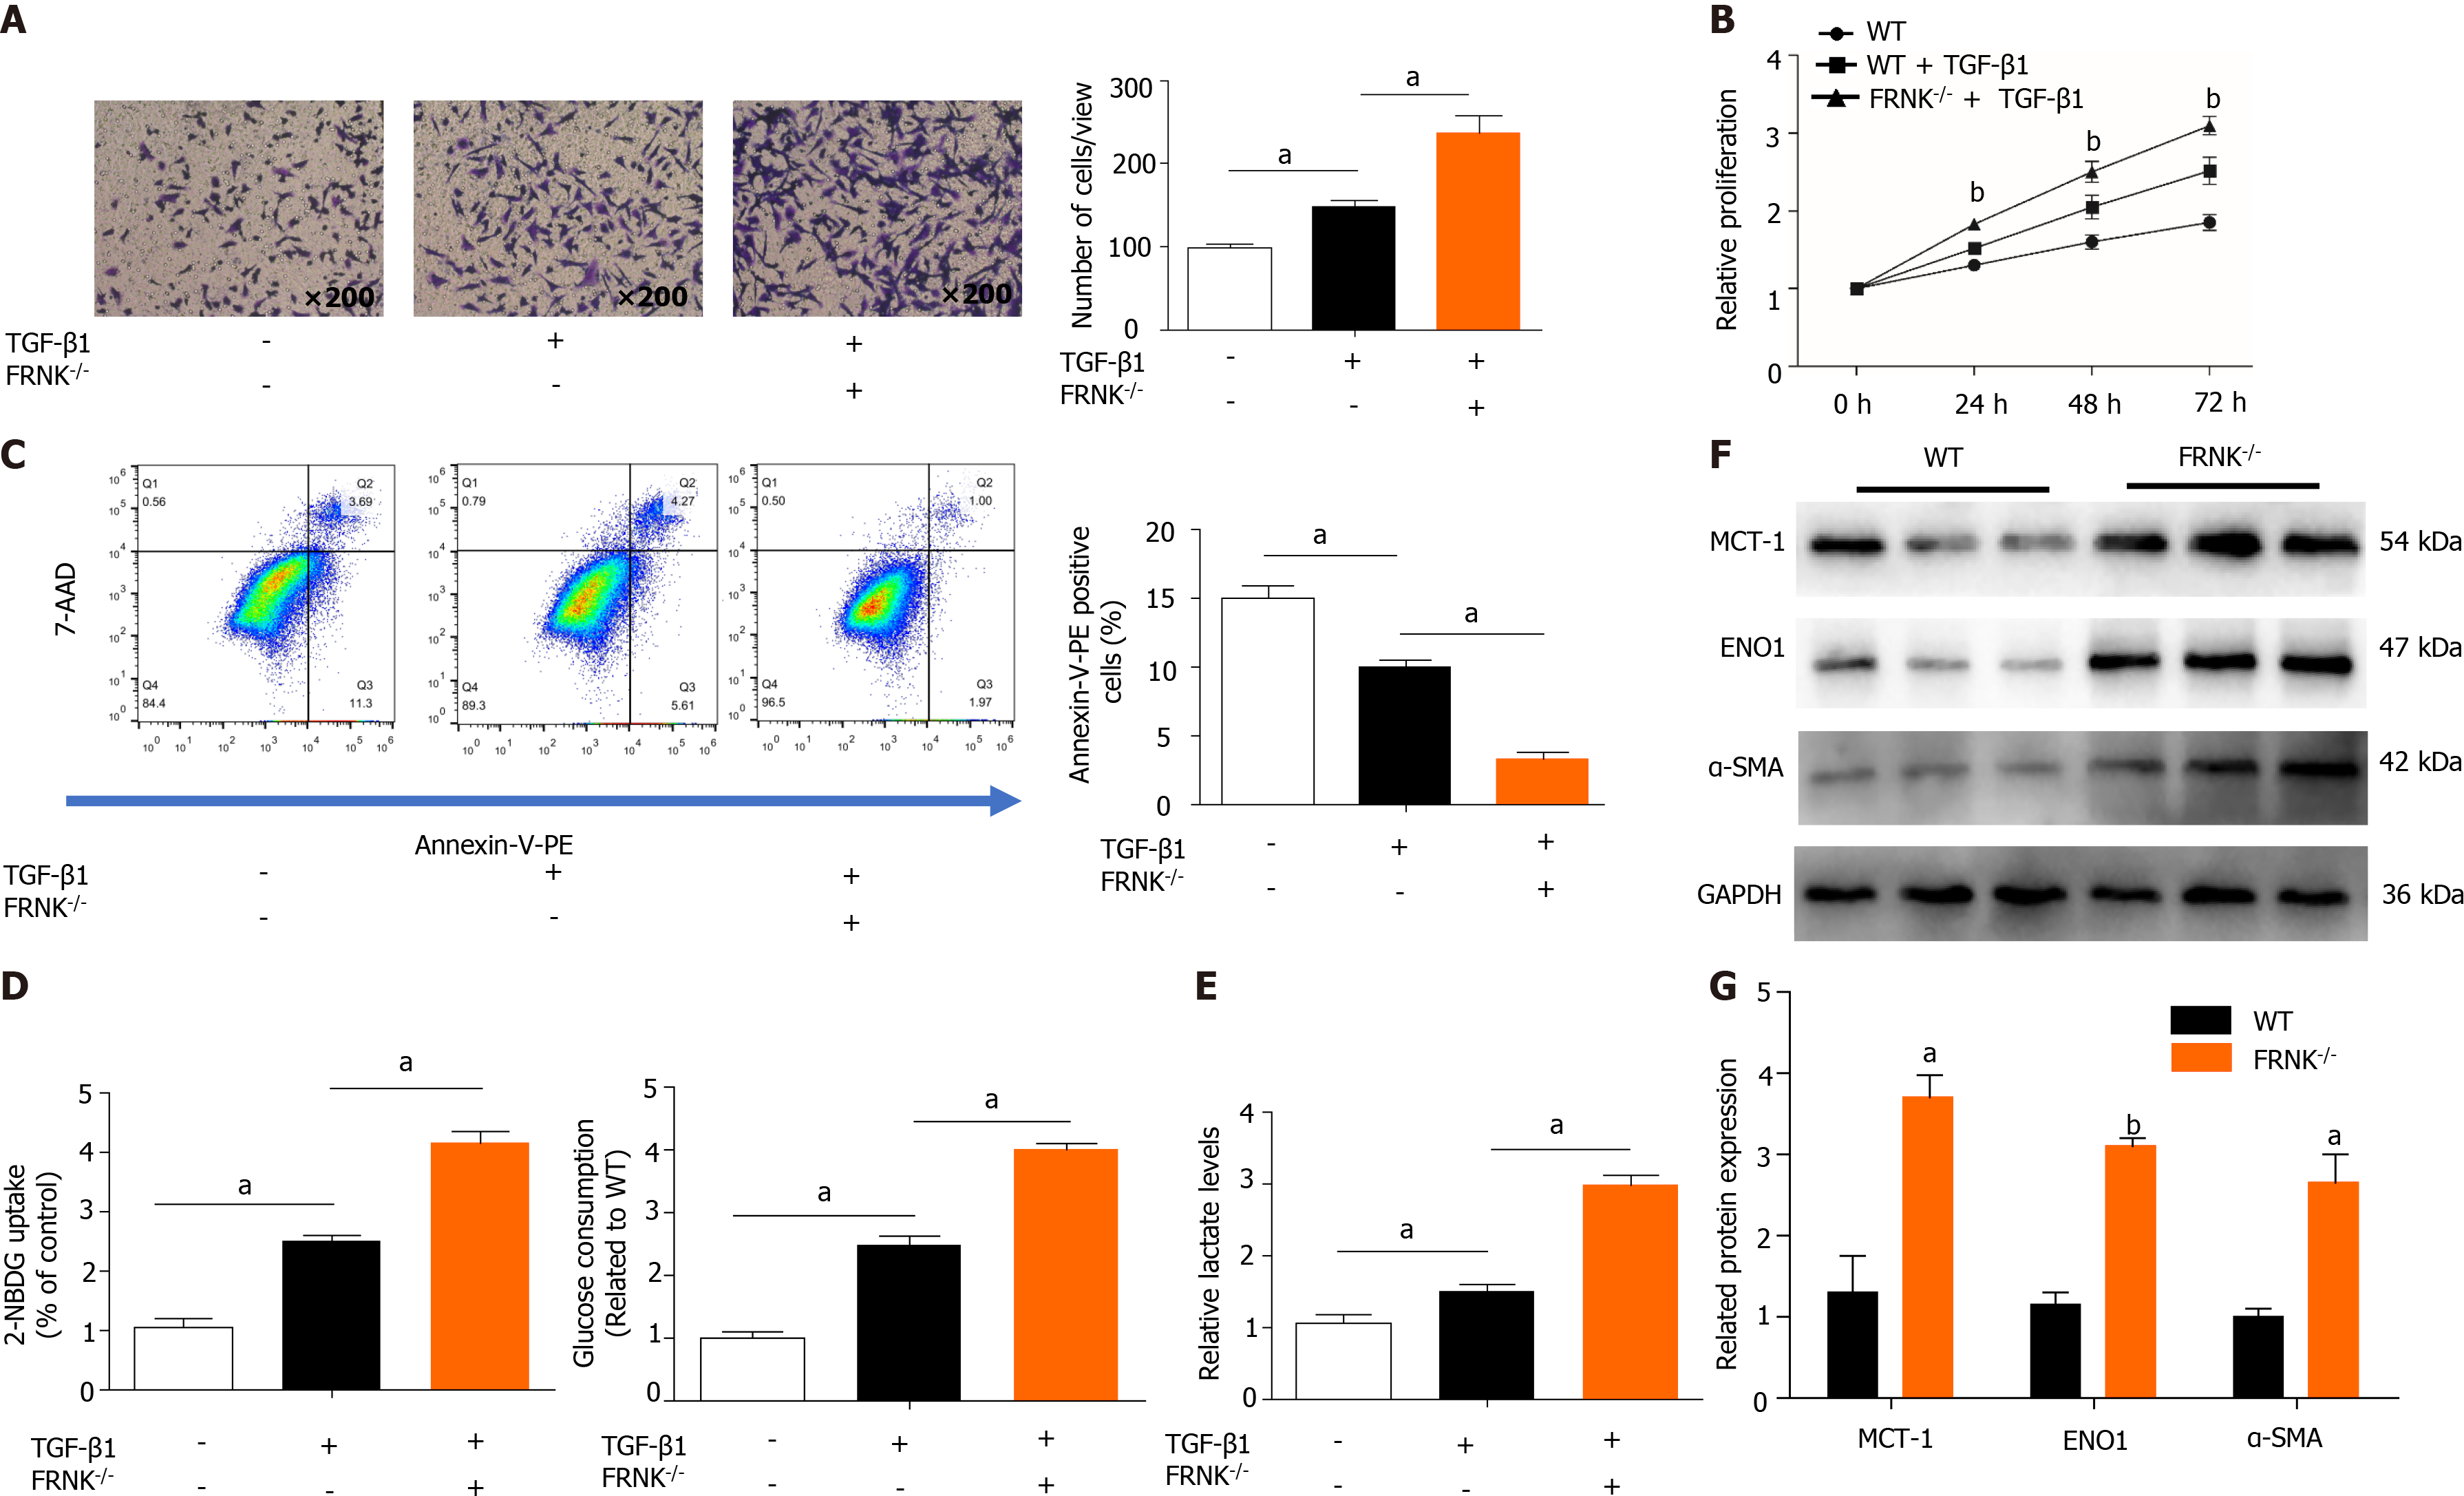
Figure 3 Knockout of FRNK promotes liver fibrosis and aerobic glycolysis in vitro.
A: After 36 h of culture with TGF-β1 (2 ng/mL), the migratory ability of primary hepatic stellate cells(pHSCs) was measured under a light microscope at × 200 magnification (105 cells per well); B: The proliferation of pHSCs was assessed with a CCK-8 assay; C: The apoptosis of pHSCs was analyzed using flow cytometry after 36 h of intervention; D and E: pHSCs cultured under the same intervention conditions were examined for glucose uptake and consumption, and lactate levels in the cell culture medium were also assessed; F and G: MCT-1, ENO1 and α-SMA levels in pHSCs were assessed using Western blotting. Representative results from three independent replicate assays are shown. aP < 0.05 and bP < 0.01 Results are presented as the mean ± SD.
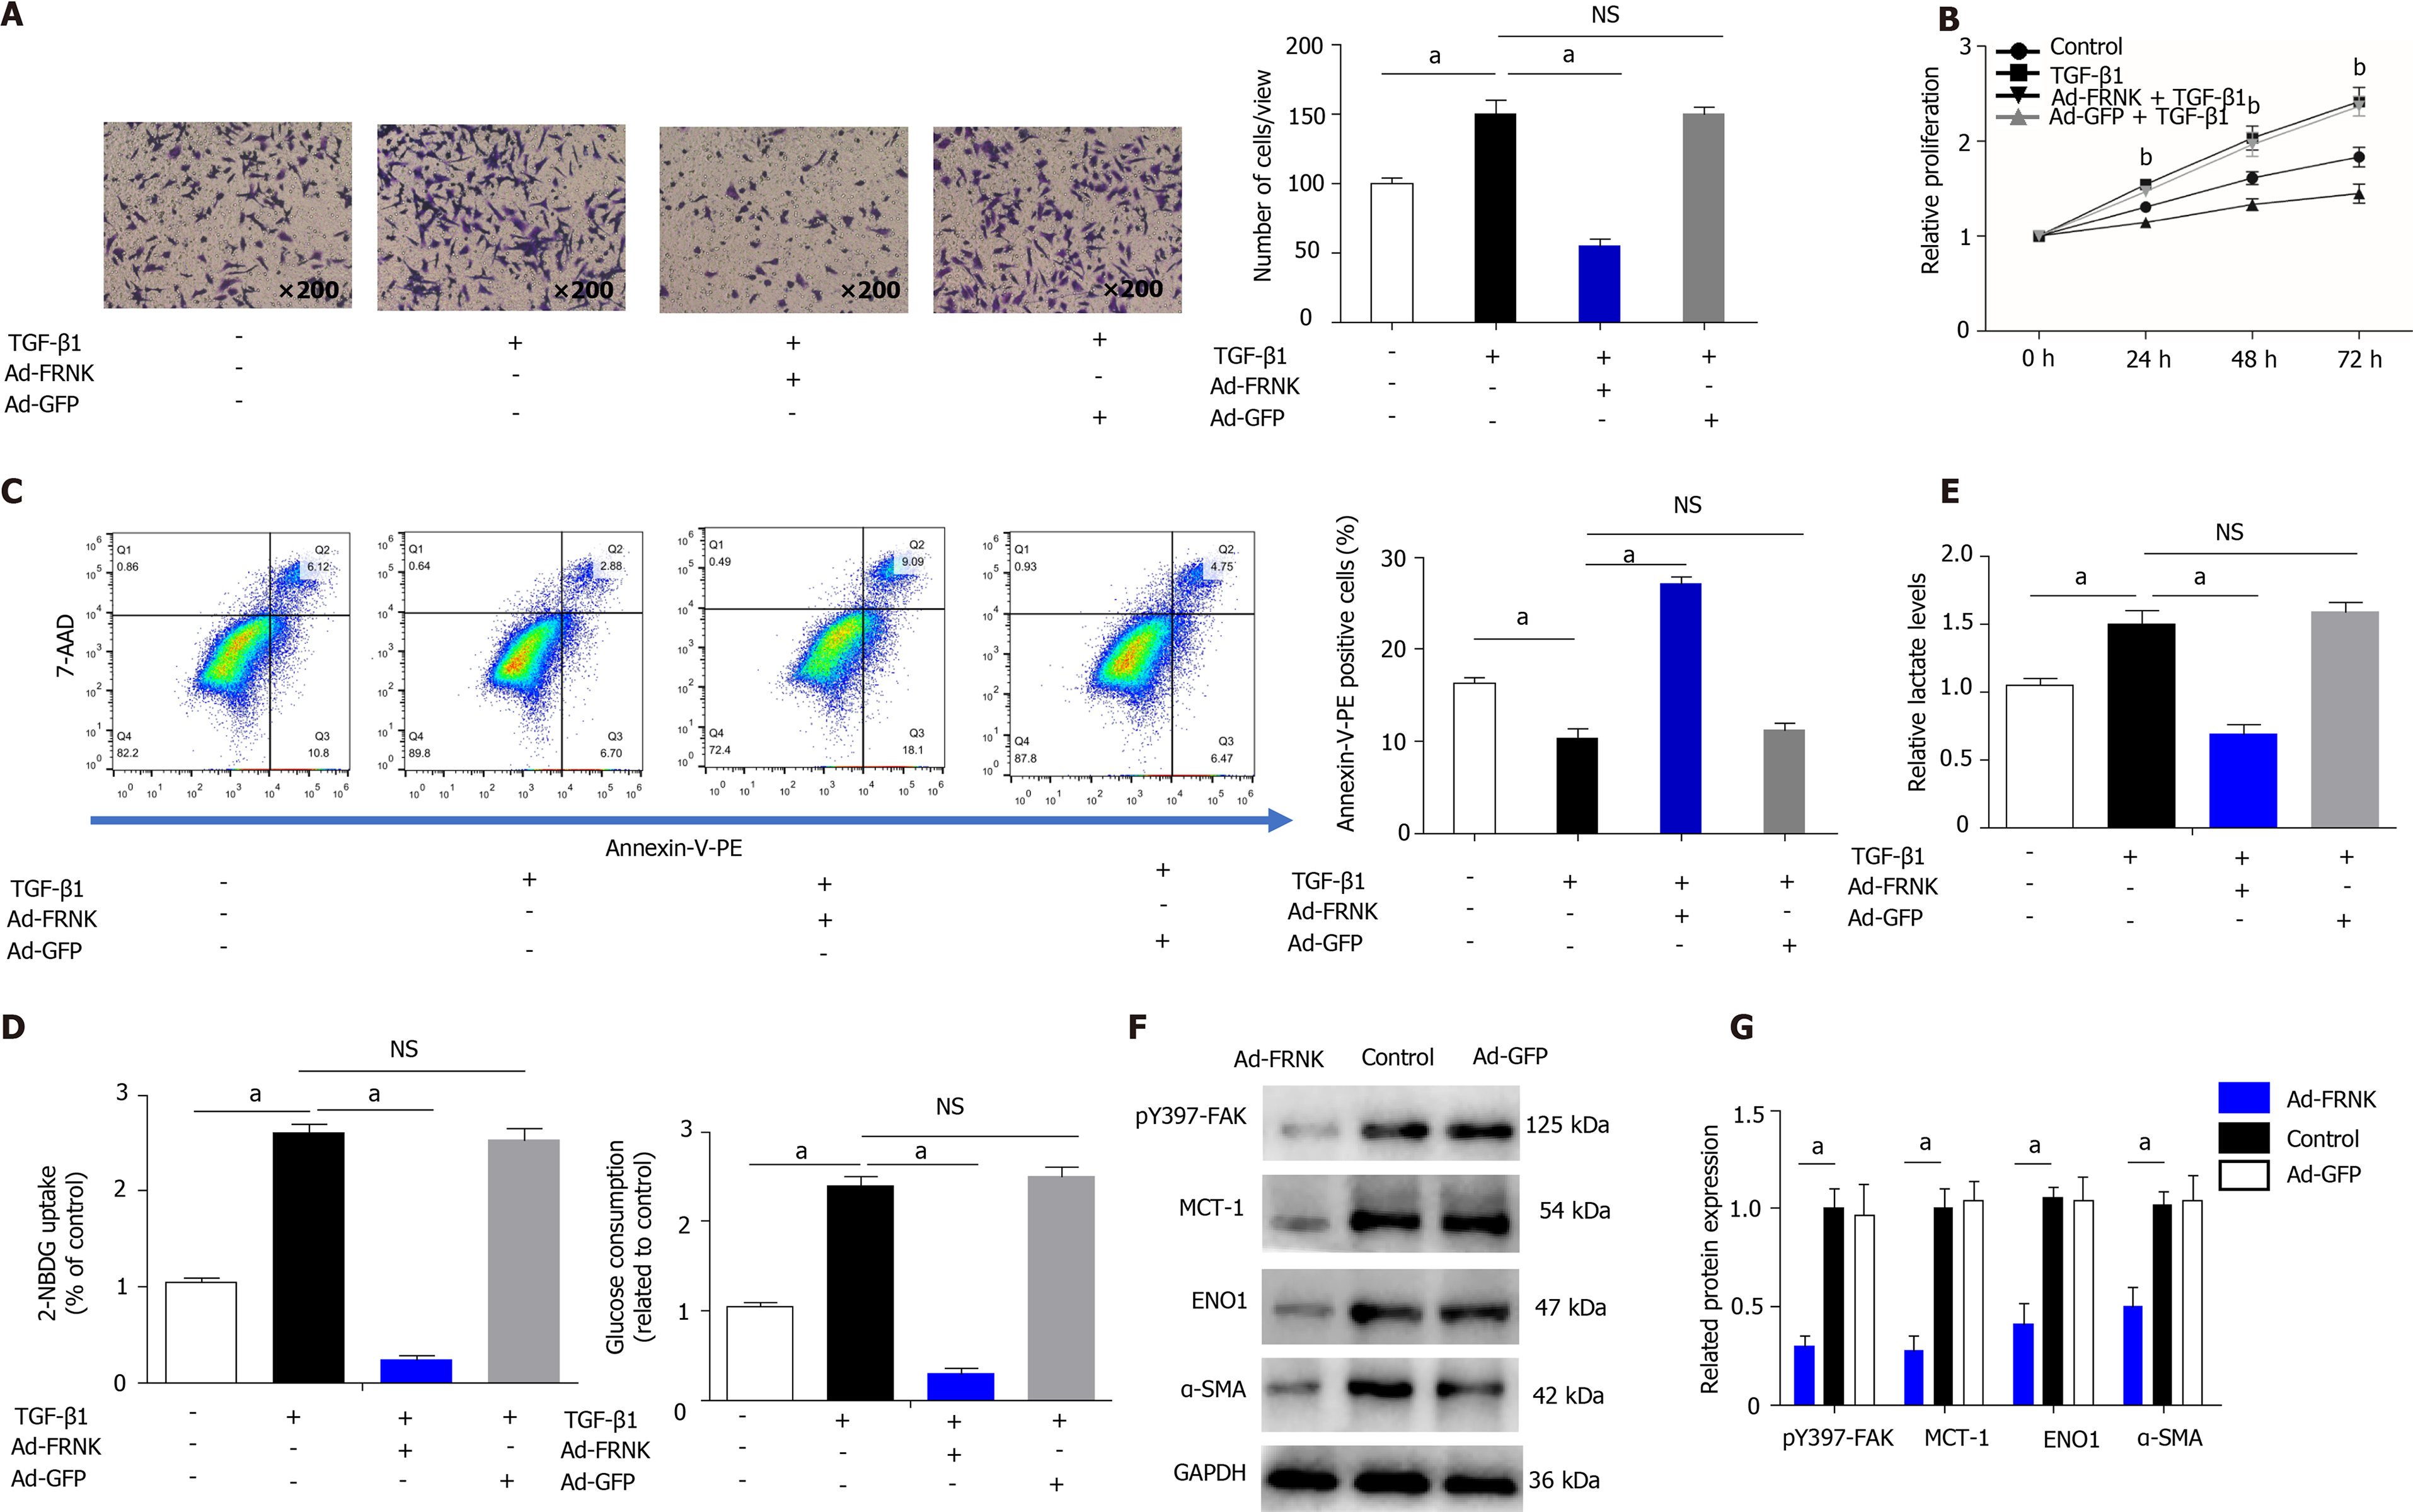
Figure 4 Exogenous FRNK ameliorates experimental liver fibrosis and aerobic glycolysis in vitro.
LX-2 cells were transfected with a green fluorescent protein-carrying adenoviral vector (Ad-GFP) also encoding the FRNK gene. A: Cultured with TGF-β1 (2 ng/mL) for 36 h (105 cells per well). Migration was measured by analyzing cells under a light microscope × 200 magnification; B: The proliferation of LX-2 cells cultured under the intervention conditions is presented; C: The apoptosis of LX-2 cells was analyzed after 36 h of intervention using flow cytometry; D and E: LX-2 cells cultured under the same intervention conditions were examined for glucose consumption and uptake abilities, and lactate levels in the cell culture medium were also assessed; F and G: Levels of pY397-FAK, MCT-1, ENO1 and α-SMA in LX-2 cells were detected using Western blotting. Representative results from three independent replicate assays are shown . aP < 0.05 and bP < 0.01. Results are presented as the mean ± SD.
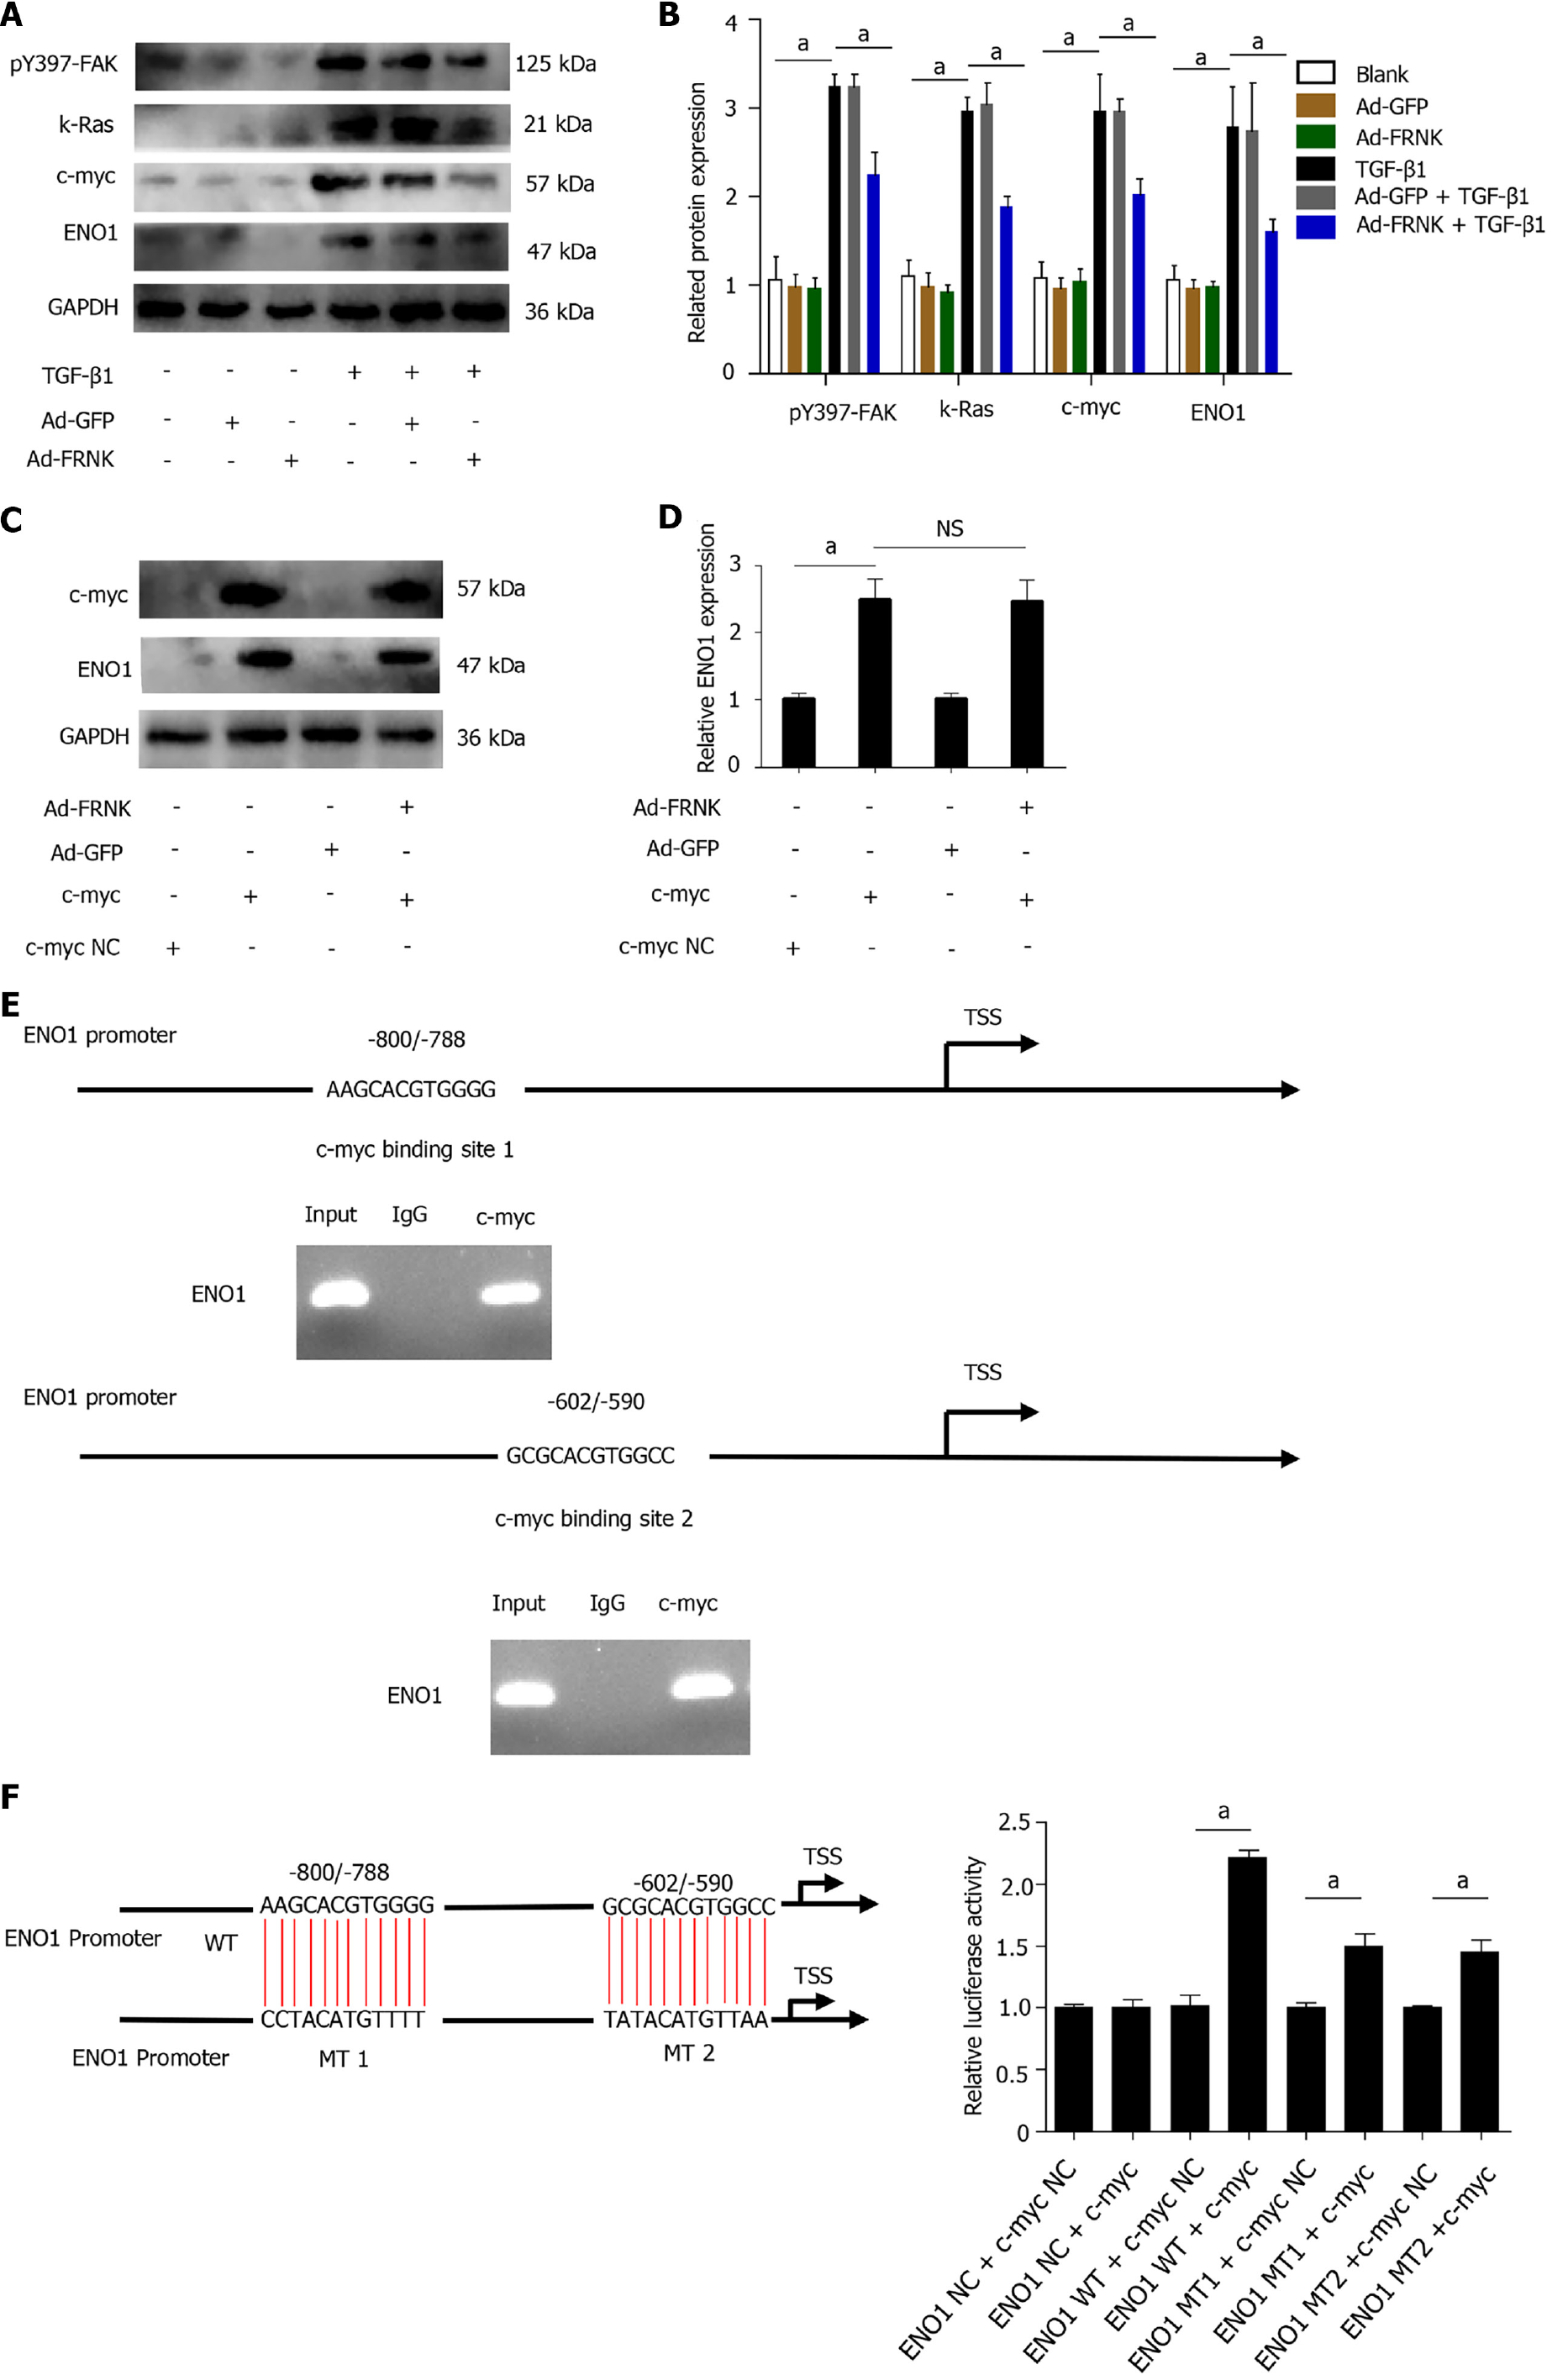
Figure 5 FRNK does not directly target ENO1.
A and B: Proteins were extracted from LX-2 cells, and relative levels of the pY397-FAK, K-Ras, c-myc and ENO1 proteins were determined; C and D: After transfection of LX-2 cells with pcDNA-c-myc or pcDNA-vector (NC), adenoviral vectors containing the FRNK gene (Ad-FRNK) or the negative control (Ad-GFP) were transfected, and the extracted protein was used to evaluate ENO1 expression through Western blotting; E: Schematic representation of the structure of the putative c-myc binding site in the human ENO1 promoter and chromatin immunoprecipitation (ChIP) assays with anti-c-myc or IgG; F: A dual-luciferase reporter assay showed the luciferase activity of WT, mutation (MT)1 and MT2 ENO1 promoters in LX-2 cells transfected with the c-myc or NC plasmid. Representative results from three independent replicate assays are shown. aP < 0.05 and bP < 0.01. Results are presented as the mean ± SD.
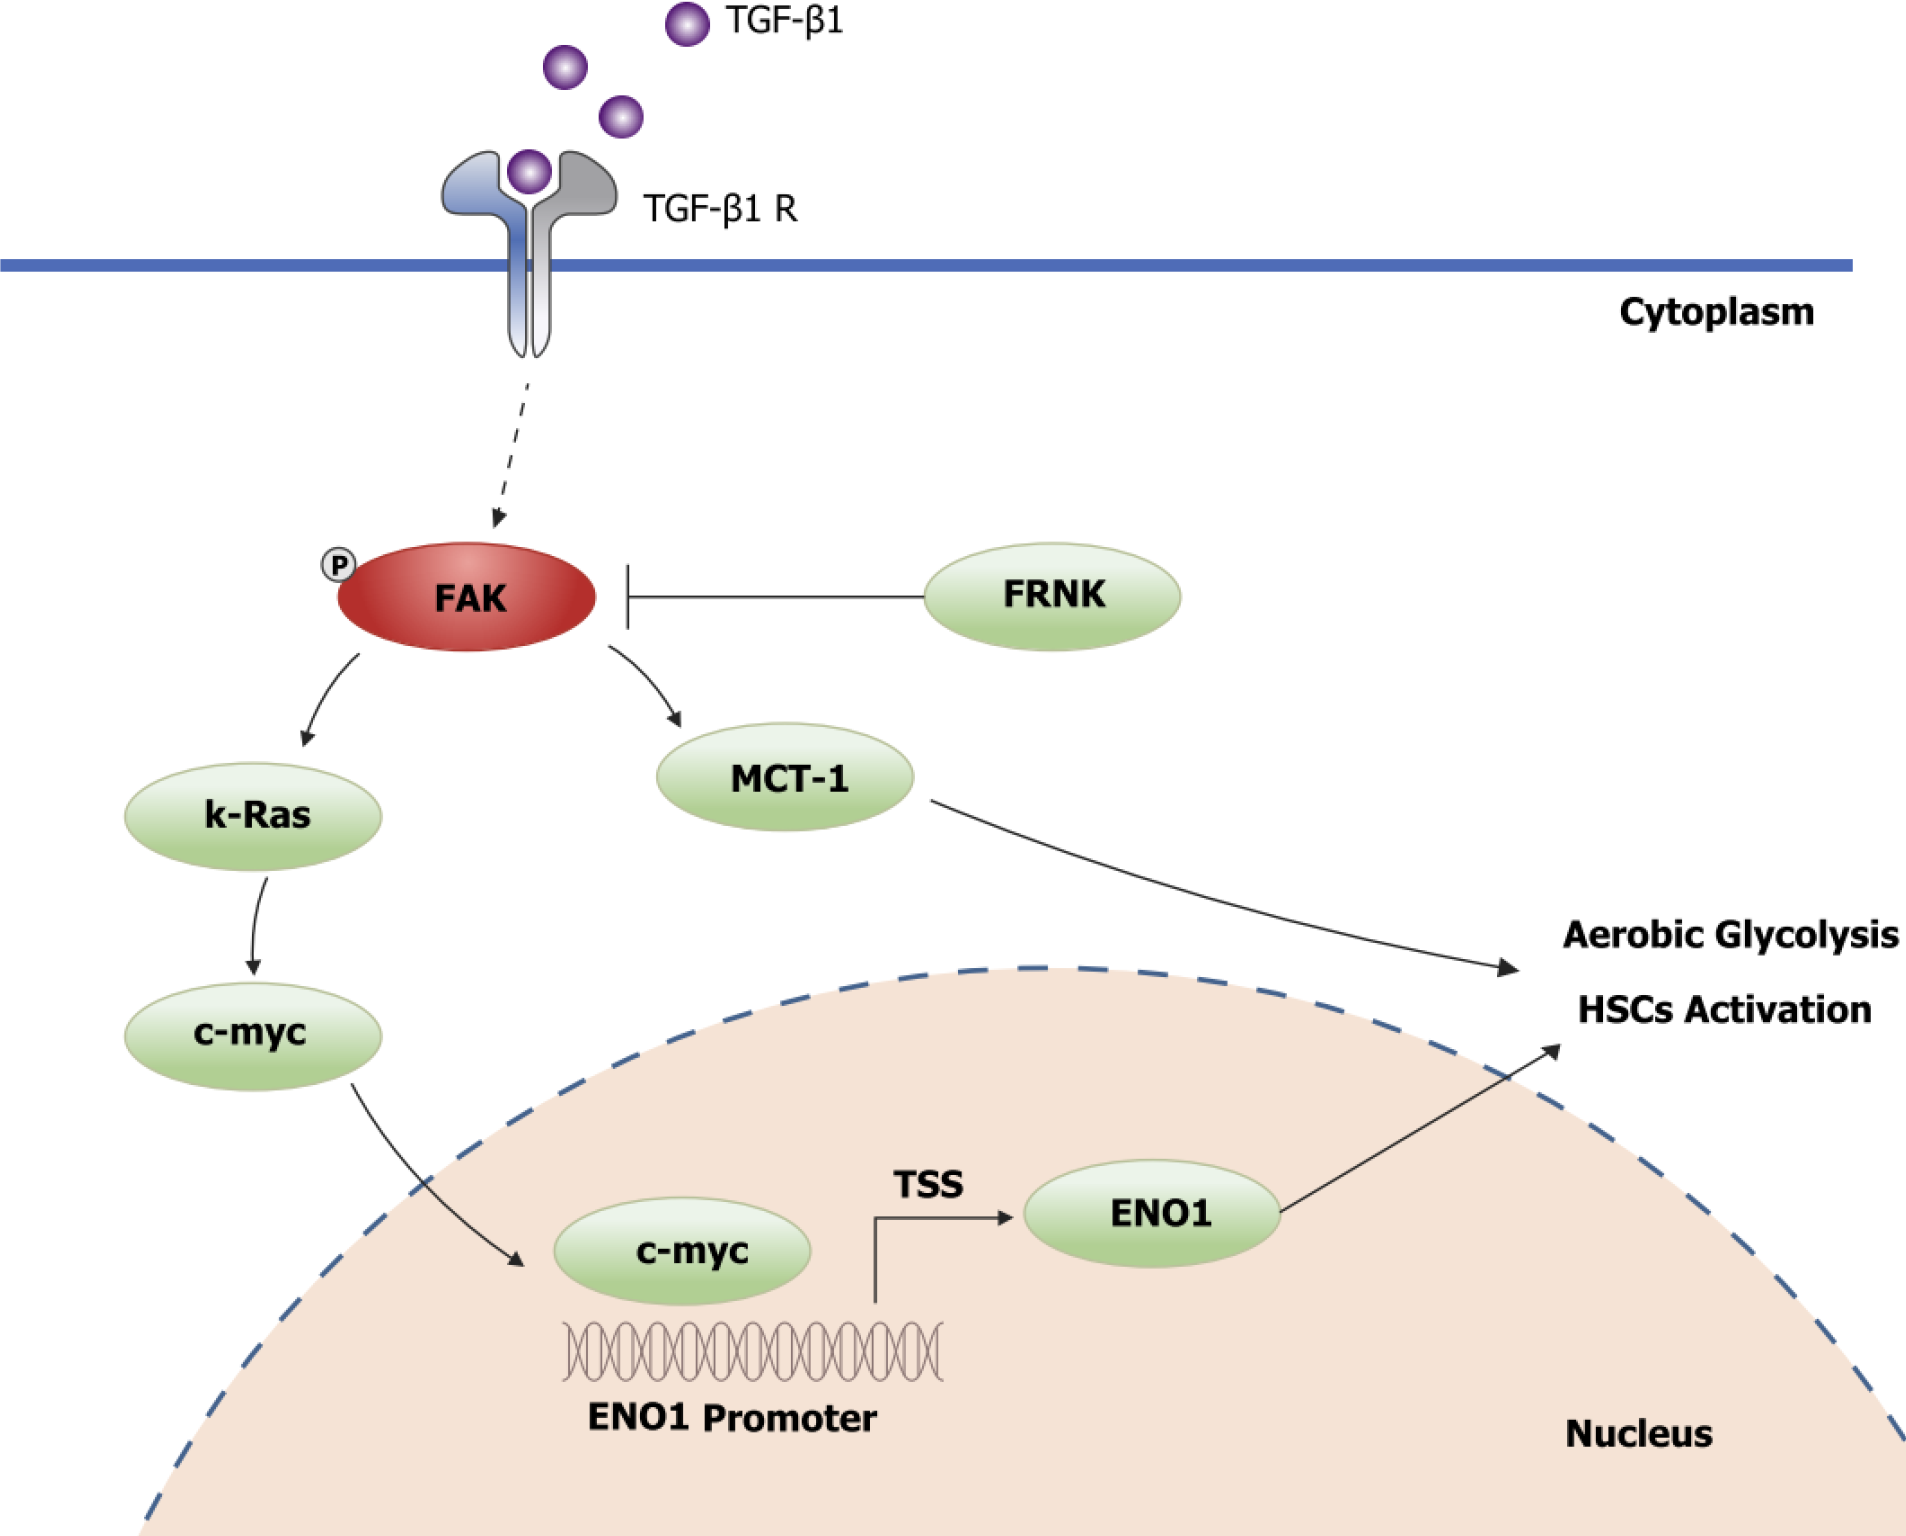
Figure 6 Schematic diagram of FRNK inhibition of the FAK/Ras/c-myc/ENO1 pathway to ameliorate liver fibrosis.
- Citation: Huang T, Li YQX, Zhou MY, Hu RH, Zou GL, Li JC, Feng S, Liu YM, Xin CQ, Zhao XK. Focal adhesion kinase-related non-kinase ameliorates liver fibrosis by inhibiting aerobic glycolysis via the FAK/Ras/c-myc/ENO1 pathway. World J Gastroenterol 2022; 28(1): 123-139
- URL: https://www.wjgnet.com/1007-9327/full/v28/i1/123.htm
- DOI: https://dx.doi.org/10.3748/wjg.v28.i1.123


