Copyright
©The Author(s) 2021.
World J Gastroenterol. Mar 7, 2021; 27(9): 866-885
Published online Mar 7, 2021. doi: 10.3748/wjg.v27.i9.866
Published online Mar 7, 2021. doi: 10.3748/wjg.v27.i9.866
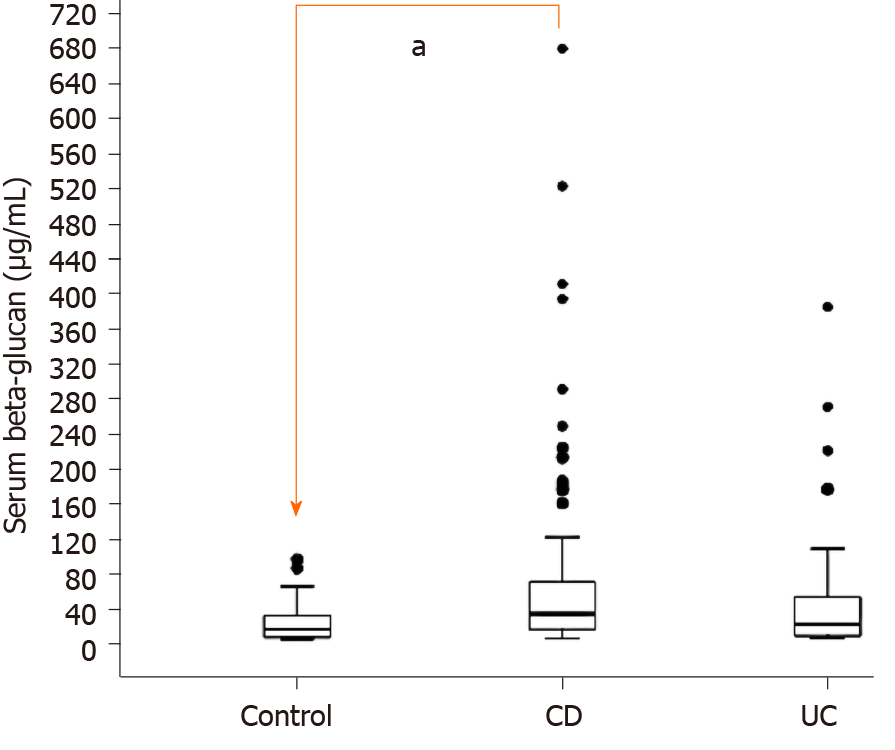
Figure 1 Serum beta-glucan concentrations in patients with Crohn’s disease, ulcerative colitis, and controls.
The analysis was performed by the Kruskal-Wallis on ranks test, in which multiple comparisons were performed using Dunn’s test. The horizontal bars represent the medians, and the boxes represent the 25th and 75th percentiles. Significant results are depicted (aP < 0.0001).
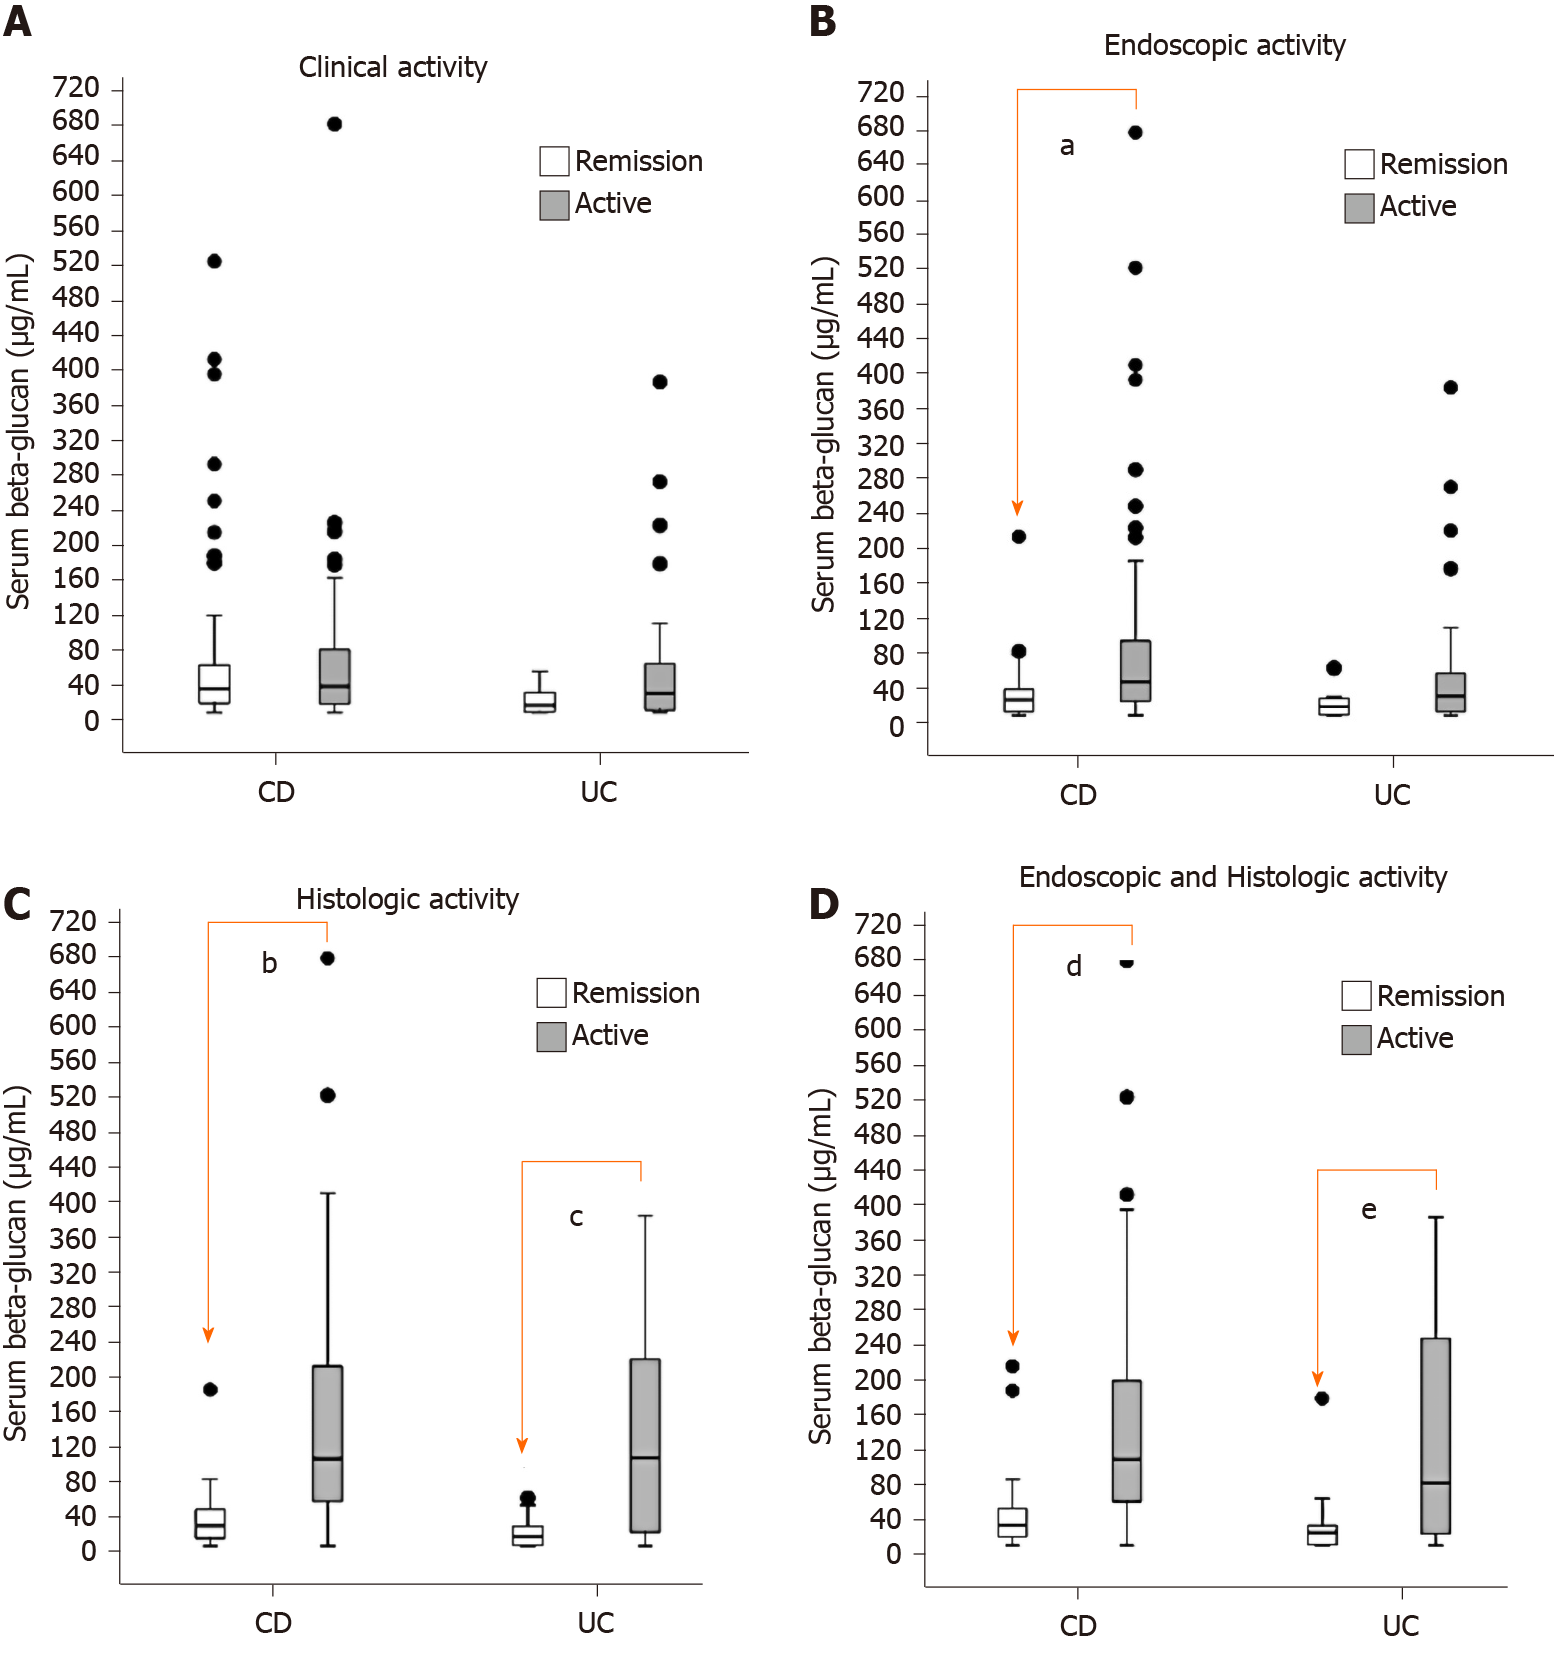
Figure 2 Although no difference was found in the beta-glucan levels regarding clinical activity, significant differences were shown for the endoscopic activity in the Crohn’s disease group and for histologic activity and combined endoscopic and histologic activity for both the Crohn’s disease and ulcerative colitis groups.
Serum beta-glucan concentrations are stratified in Crohn’s disease and ulcerative colitis according to (A) clinical; (B) endoscopic; (C) histologic; and (D) combined endoscopic and histologic indexes. The analysis was performed by the Mann-Whitney rank-sum test. The horizontal bars represent medians, and the boxes represent the 25th and 75th percentiles. Significant results are depicted (aP = 0.002; bP < 0.001; cP = 0.013; dP < 0.001; eP = 0.047).
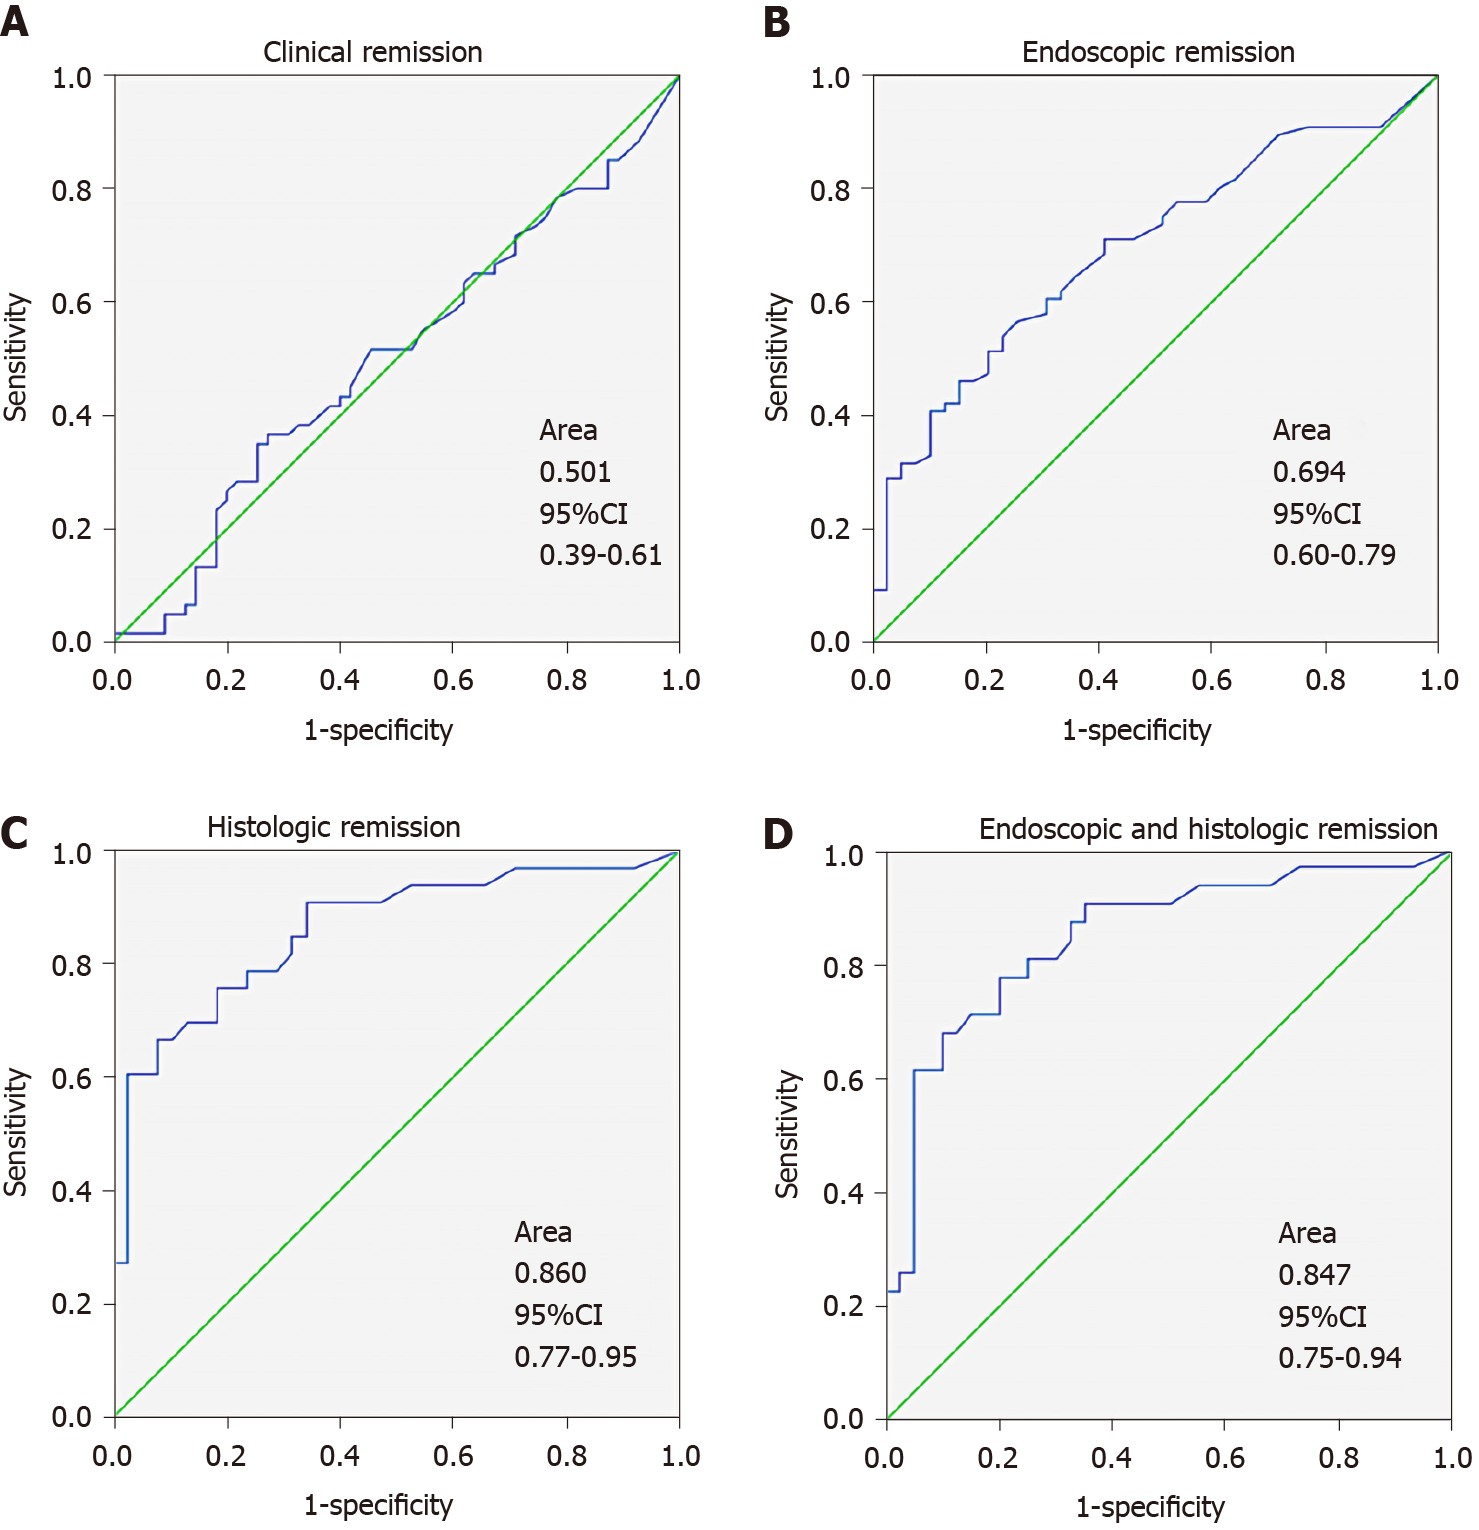
Figure 3 Receiver operating characteristic curves illustrating the diagnostic ability of serum beta-glucan for detecting disease activity in patients with Crohn’s disease.
Receiver operating characteristic curves are shown in relation to the (A) clinical; (B) endoscopic; (C) histologic; and (D) combined endoscopic and histologic criteria. Diagonal segments are produced by ties. The area under the curve with standard error and the 95% confidence interval (95%CI) are shown in each plot.
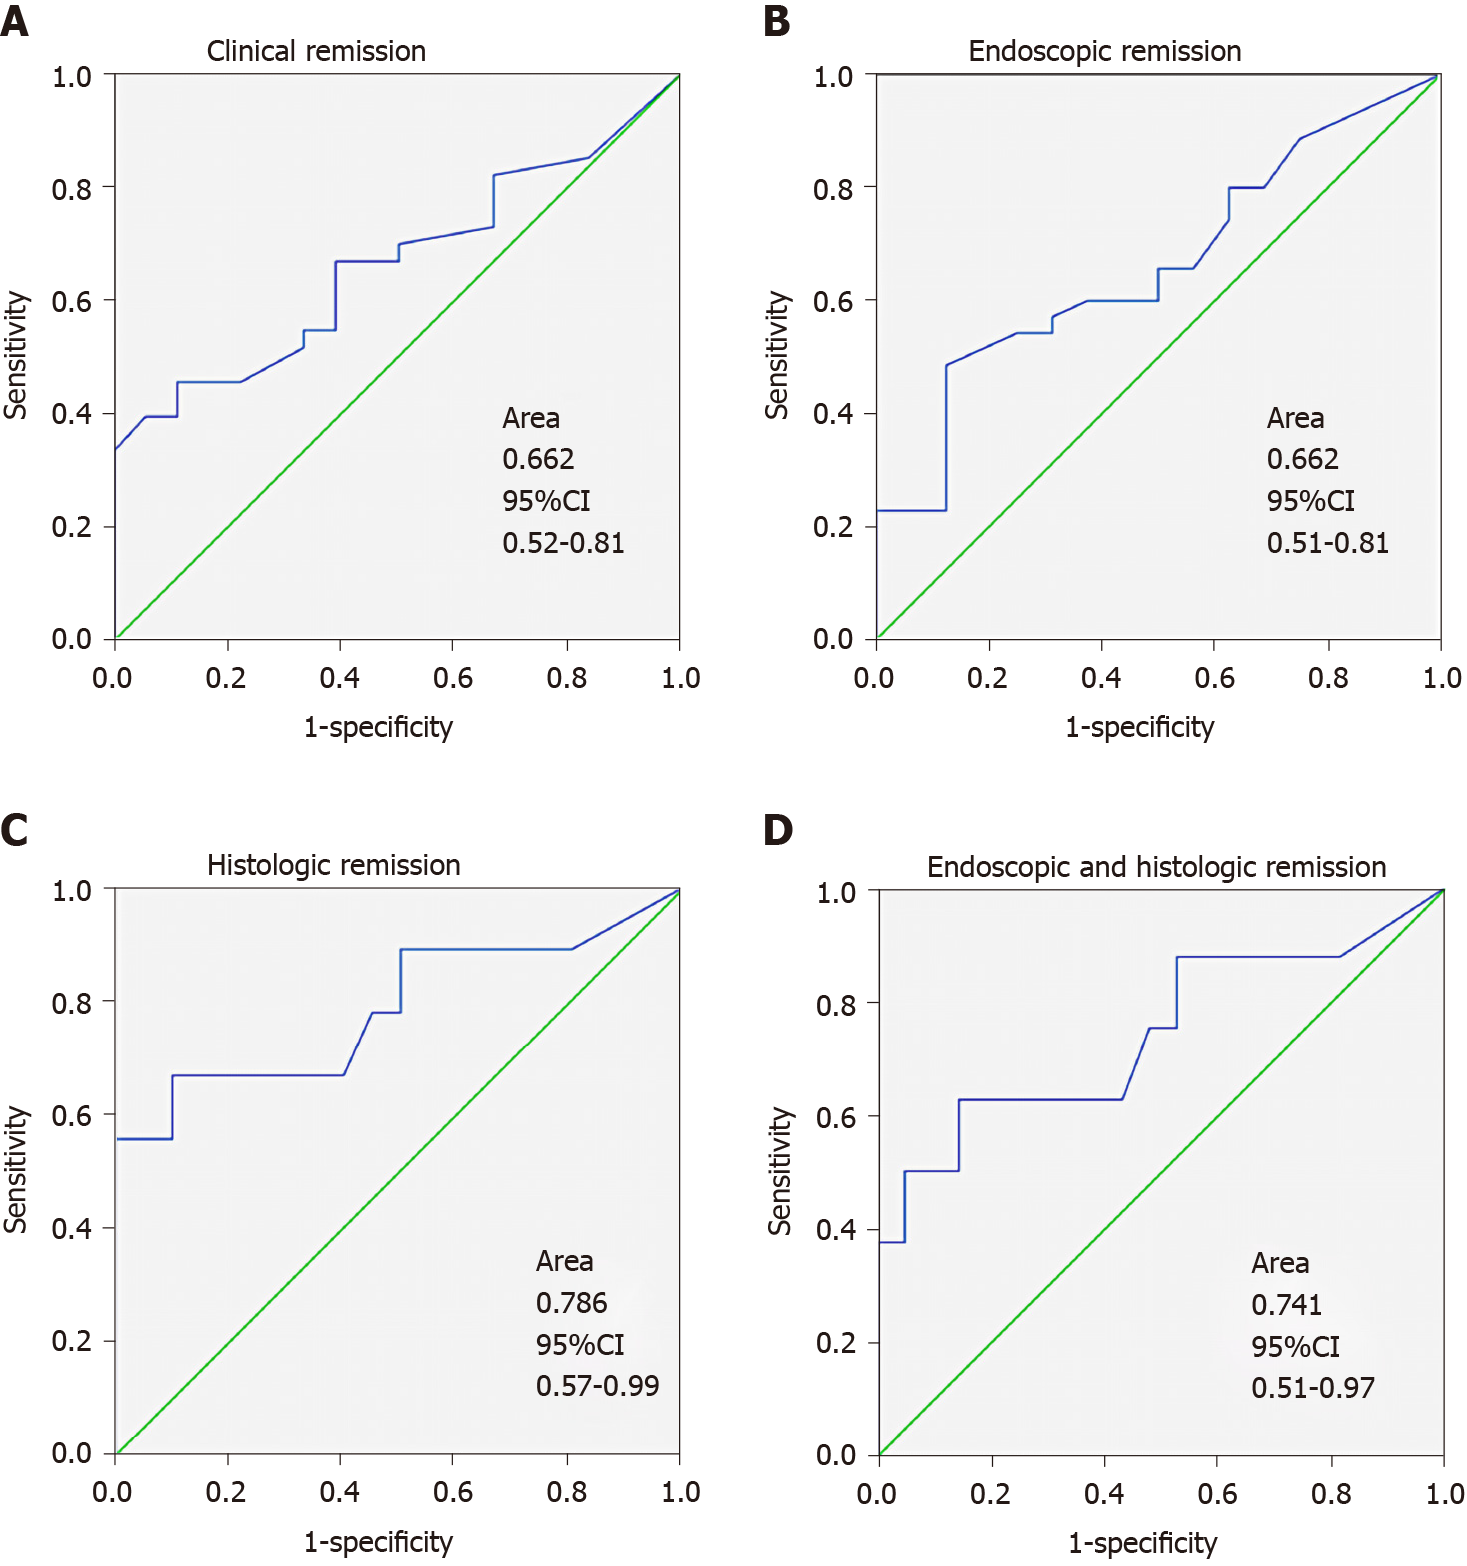
Figure 4 Receiver operating characteristic curves illustrating the diagnostic ability of serum beta-glucan for detecting disease activity in patients with ulcerative colitis.
Receiver operating characteristic curves are shown in relation to the (A) clinical; (B) endoscopic; (C) histologic; and (D) combined endoscopic and histologic criteria. Diagonal segments are produced by ties. The area under the curve with standard error and the 95% confidence interval (95%CI) are shown in each plot.
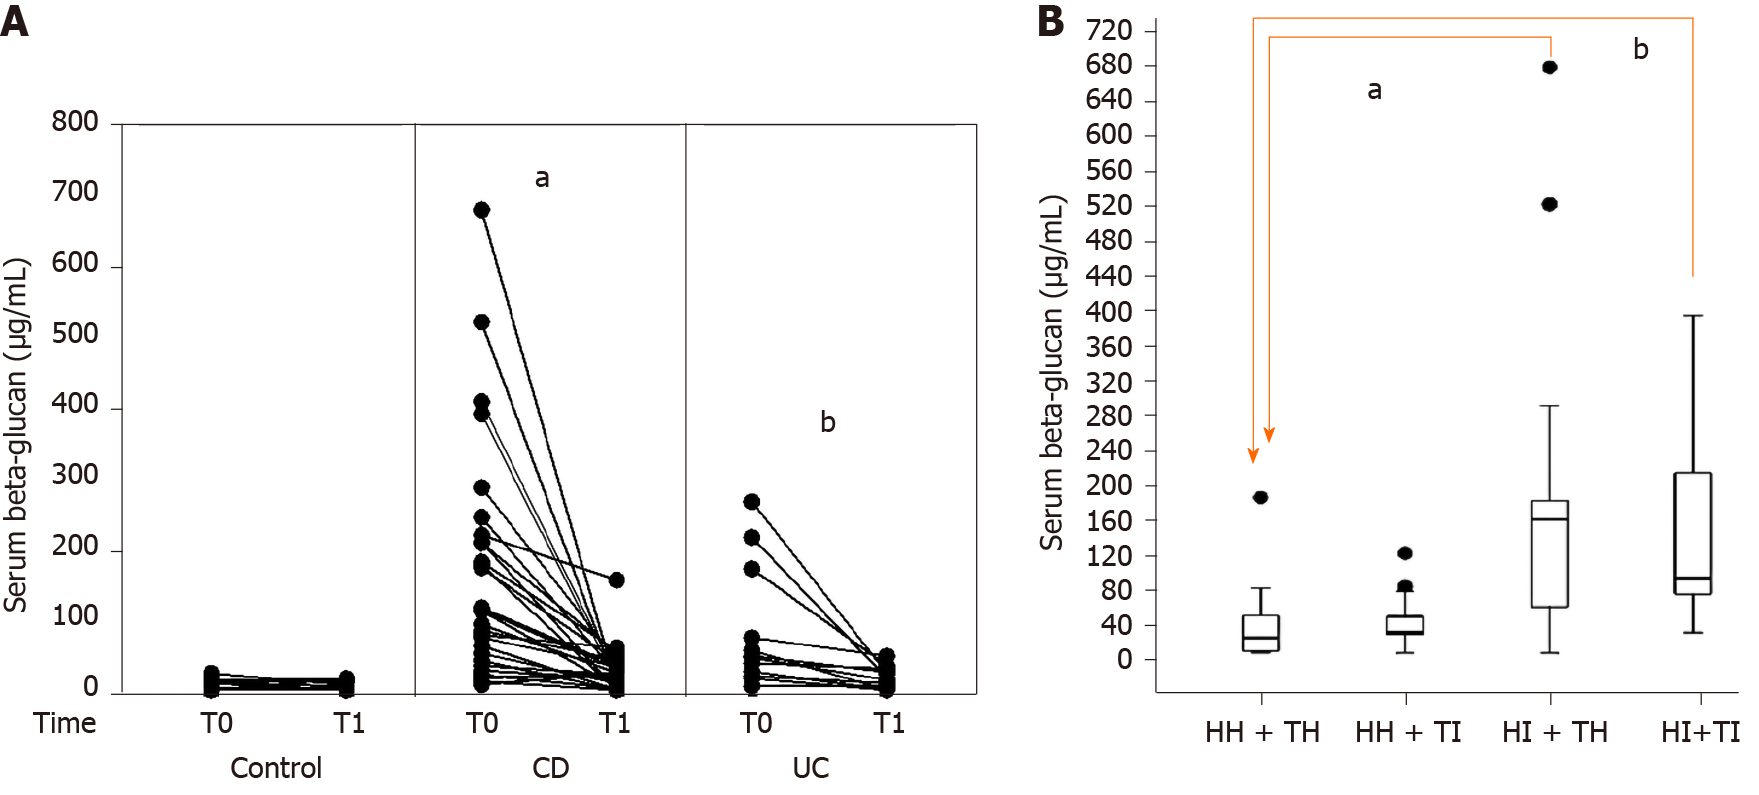
Figure 5 Analysis of serum beta-glucan in response to therapeutic intervention in inflammatory bowel diseases, and in relation to histologic and transmural inflammation in Crohn’s disease.
A: Serial concentrations of serum beta-glucan are shown at week 0 (T0) and between weeks 12 and 16 (T1) in controls and after therapeutic interventions in patients with Crohn’s disease and ulcerative colitis. The analysis was performed by the pairwise Wilcoxon rank-sum test. Significant results are depicted (aP < 0.0001; bP = 0.003); B: Serum beta-glucan concentrations of patients with Crohn’s disease are stratified according to histologic healing or inflammation, and transmural healing or inflammation, based on magnetic resonance enterography. The analysis was performed by the Kruskal-Wallis on ranks test, in which multiple comparisons were performed using Dunn’s test. The horizontal bars represent medians, and the boxes represent the 25th and 75th percentiles. Significant results are depicted (aP = 0.0018; bP = 0.011).
- Citation: Farias e Silva K, Nanini HF, Cascabulho CM, Rosas SLB, Santana PT, Carneiro AJV, Anaissie E, Nucci M, de Souza HSP. Serum 1,3-beta-D-glucan as a noninvasive test to predict histologic activity in patients with inflammatory bowel disease. World J Gastroenterol 2021; 27(9): 866-885
- URL: https://www.wjgnet.com/1007-9327/full/v27/i9/866.htm
- DOI: https://dx.doi.org/10.3748/wjg.v27.i9.866


