Copyright
©The Author(s) 2021.
World J Gastroenterol. Mar 7, 2021; 27(9): 794-814
Published online Mar 7, 2021. doi: 10.3748/wjg.v27.i9.794
Published online Mar 7, 2021. doi: 10.3748/wjg.v27.i9.794
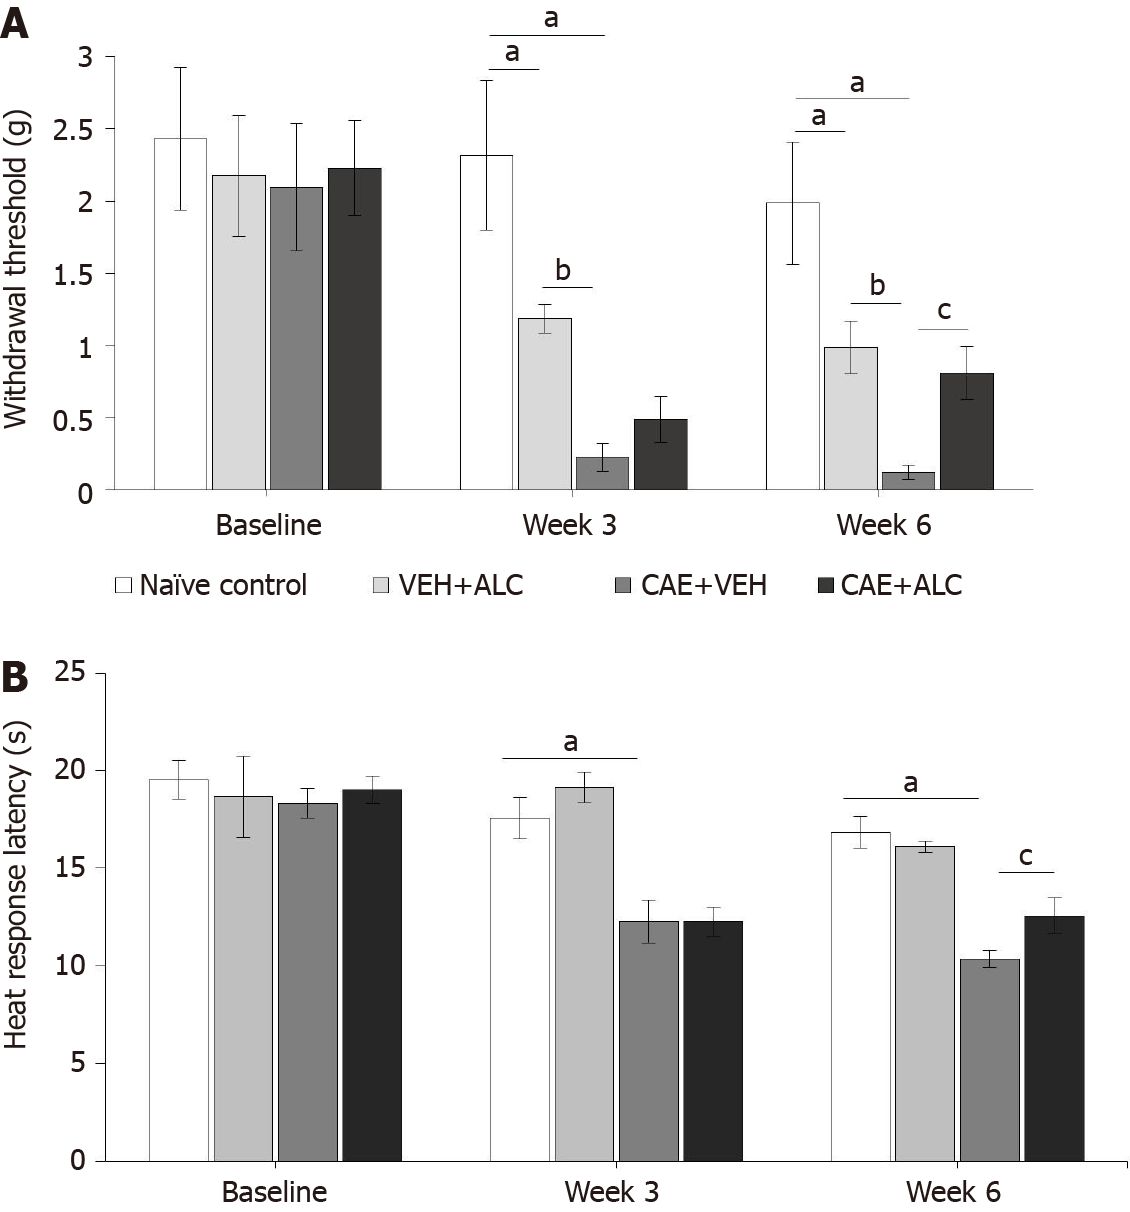
Figure 1 Caerulein-induced pancreatitis produced secondary hypersensitivity of the hindpaws that was attenuated by treatment with acetyl-L-carnitine.
A: Mechanical withdrawal thresholds were significantly reduced after 3 wk of caerulein (CAE) injections indicating hypersensitivity and remained reduced after 6 wk of CAE injections; B: Response latencies to heat stimulation in the hotplate test were significantly reduced after 3 and 6 wk of CAE injections. Concurrent treatment with acetyl-L-carnitine (ALC) during the last 3 wk attenuated mechanical and heat hypersensitivity. n = 6/group; aP < 0.05 compared to naïve control; bP < 0.05 compared to VEH + ALC; cP < 0.05 compared to CAE + ALC; two-way ANOVA with Newman-Keuls post hoc test. ALC: Acetyl-L-carnitine; CAE: Caerulein; VEH: Vehicle.
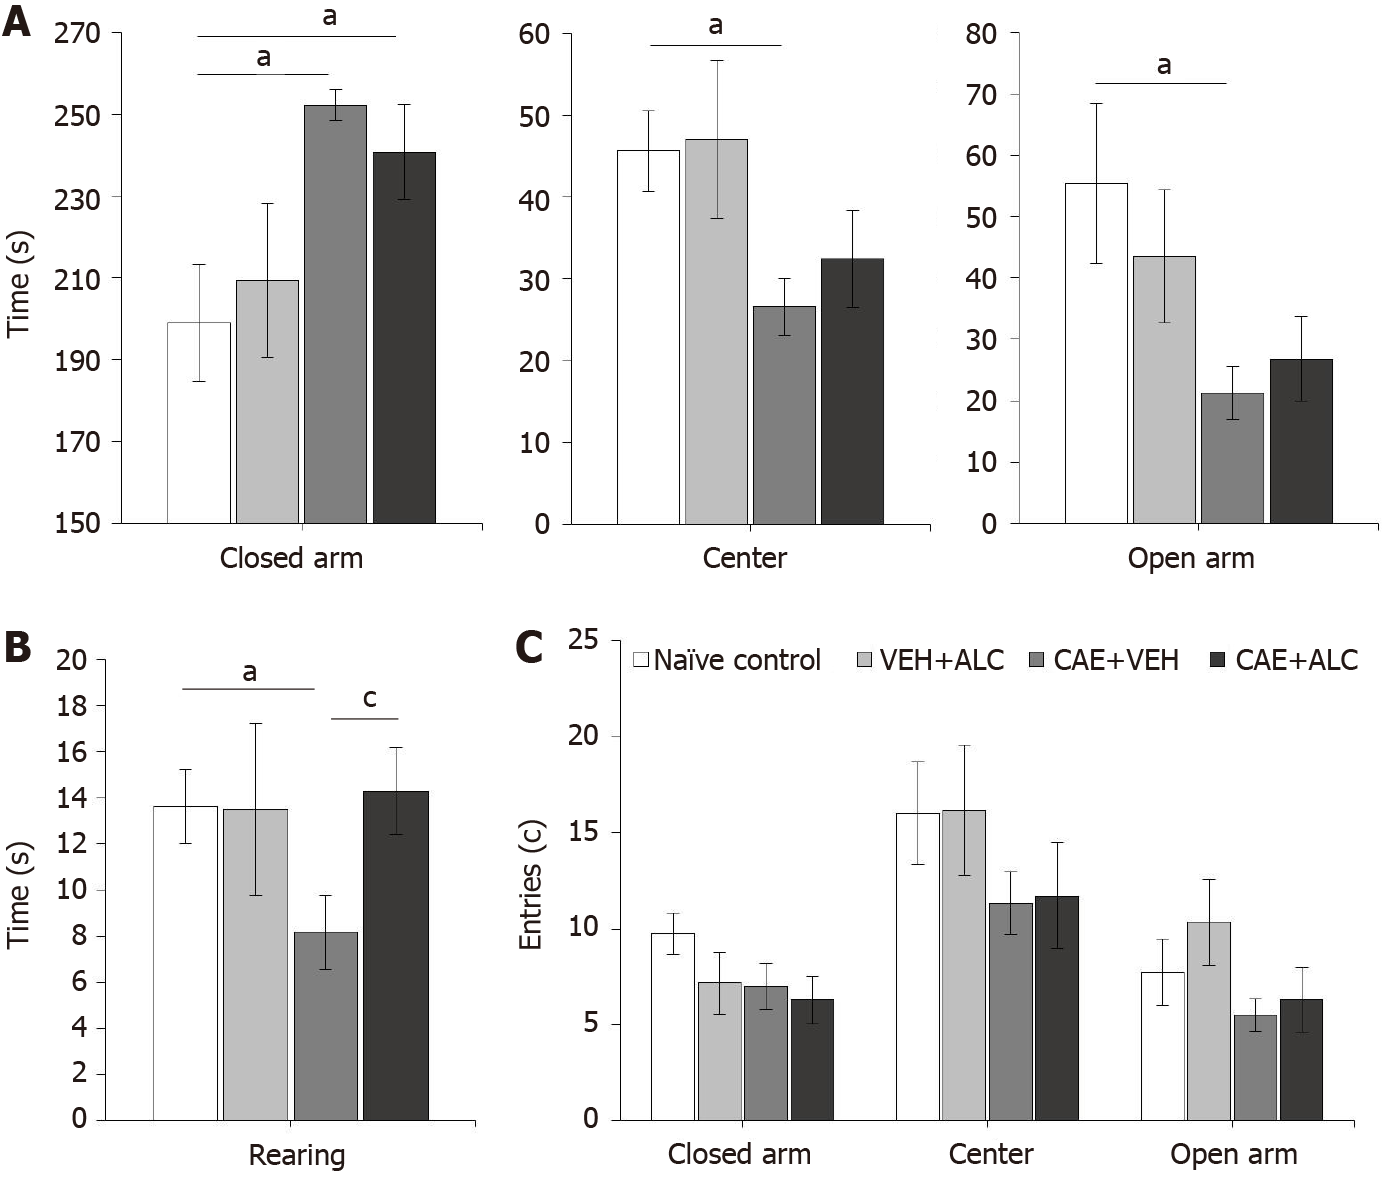
Figure 2 Anxiety-like behavior was measured in week 6 of caerulein-induced pancreatitis but acetyl-L-carnitine treatment only increased the number of rearing events.
A: Mice with caerulein- (CAE) induced pancreatitis spent significantly more time in the closed arm, and less in the center and open arm of the plus maze compared to naïve control animals. Treatment with acetyl-L-carnitine (ALC) had no effect; B: Mice with CAE-induced pancreatitis reared significantly less compared to naïve control animals. This was alleviated after 3 wk of treatment with ALC; C: No differences were detected between groups in the number of entries to the different zones of the elevated plus maze. n = 6/group; aP < 0.05 compared to naïve control; cP < 0.05 compared to CAE + ALC; two-way ANOVA with Newman-Keuls post hoc test. ALC: Acetyl-L-carnitine; CAE: Caerulein; VEH: Vehicle.
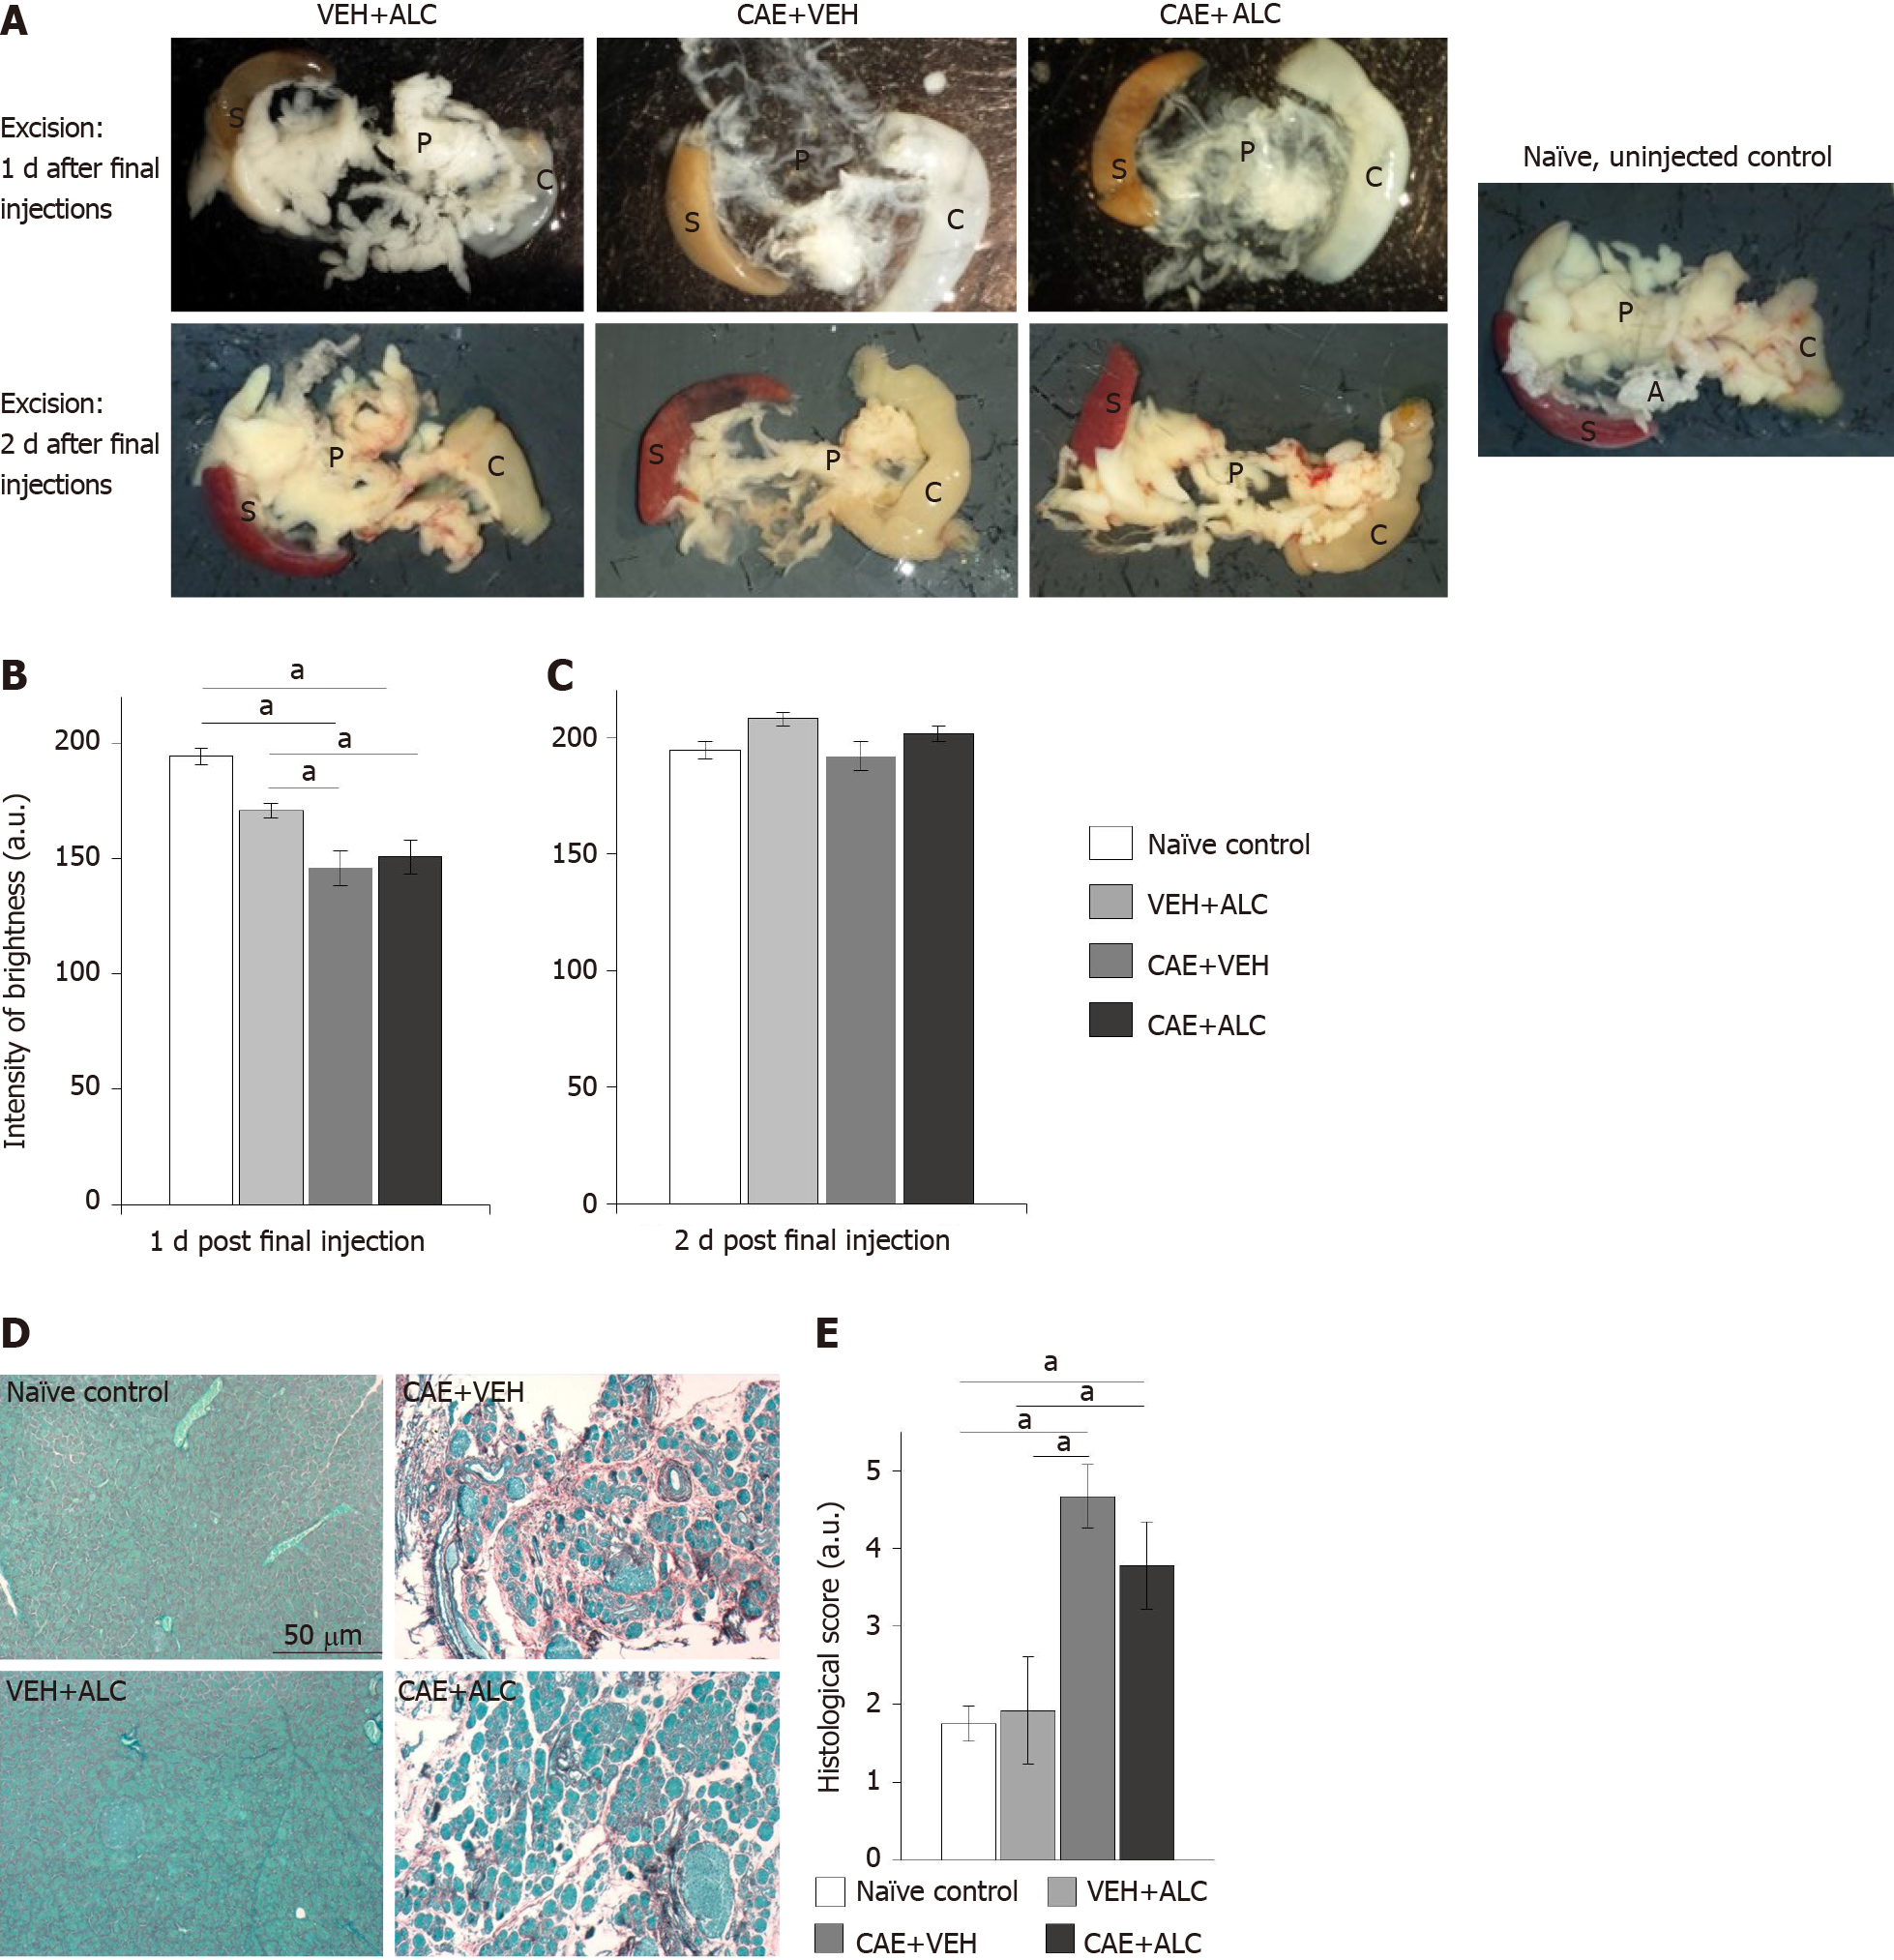
Figure 3 Caerulein-induced pancreatitis caused tissue translucence of the pancreas that was reversed within 2 d in the absence of pharmacological intervention as well fibrosis and acinar cell atrophy.
A: Top row shows pancreata excised at experiments end in week 6, one day after the final injections. Bottom row shows pancreata excised at experiments end two days after final injections. On the far right is an opaque pancreas from a naïve control animal that was never injected; B: Tissue from caerulein (CAE) + vehicle (VEH) and CAE + acetyl-L-carnitine (ALC) were significantly darker, revealing the charcoal stained Sylgard in the dissection dish below, shining through the translucent pancreas compared to naïve controls when excised 1 d after the last injection days in week 6. Naïve control n = 6; VEH + ALC n = 3/timepoint; CAE + VEH n = 3/timepoint; CAE + ALC n = 3/timepoint; C: No group differences were noted on day 2 post final injection day in week 6; D: Pancreatic tissue sections stained with Sirius Red and Fast Green identified wide-spread fibrosis (red) and atrophy of the acinar parenchymal tissue only in CAE + VEH and CAE + ALC samples. Scale bar 50 μm; E: Average scores (1 = no damage to 5 = severe damage) of Sirius Red and Fast Green-stained pancreatic tissue sections were significantly higher in CAE + VEH and CAE + ALC samples compared to both control groups. Naïve control n = 4; VEH + ALC n = 4; CAE + VEH n = 3; CAE + ALC n = 3; aP < 0.05; two-way ANOVA with Newman-Keuls post hoc test. A: Adiposita; C: Colon; P: Pancreas; S: Spleen; ALC: Acetyl-L-carnitine; CAE: Caerulein; VEH: Vehicle.
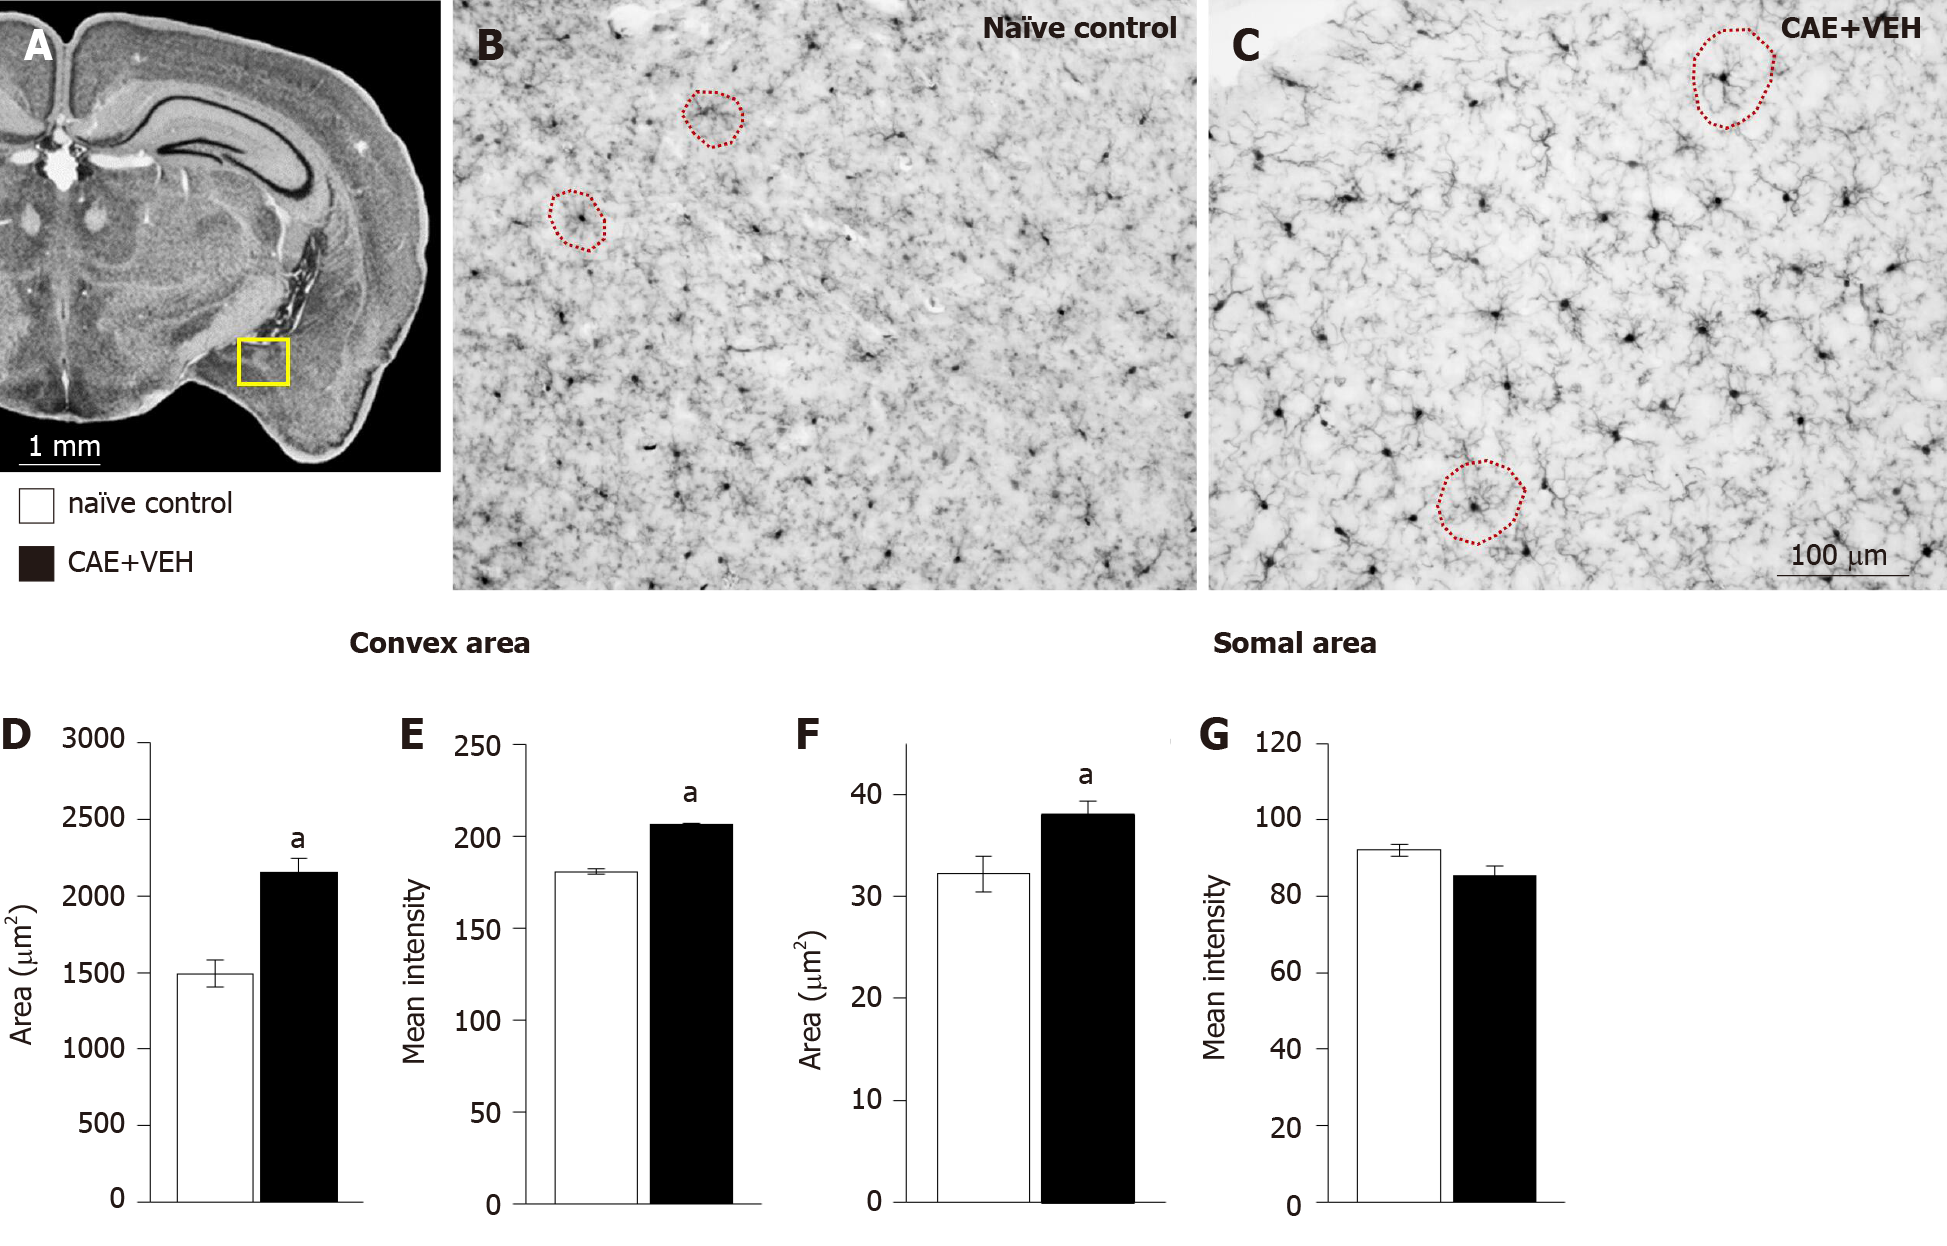
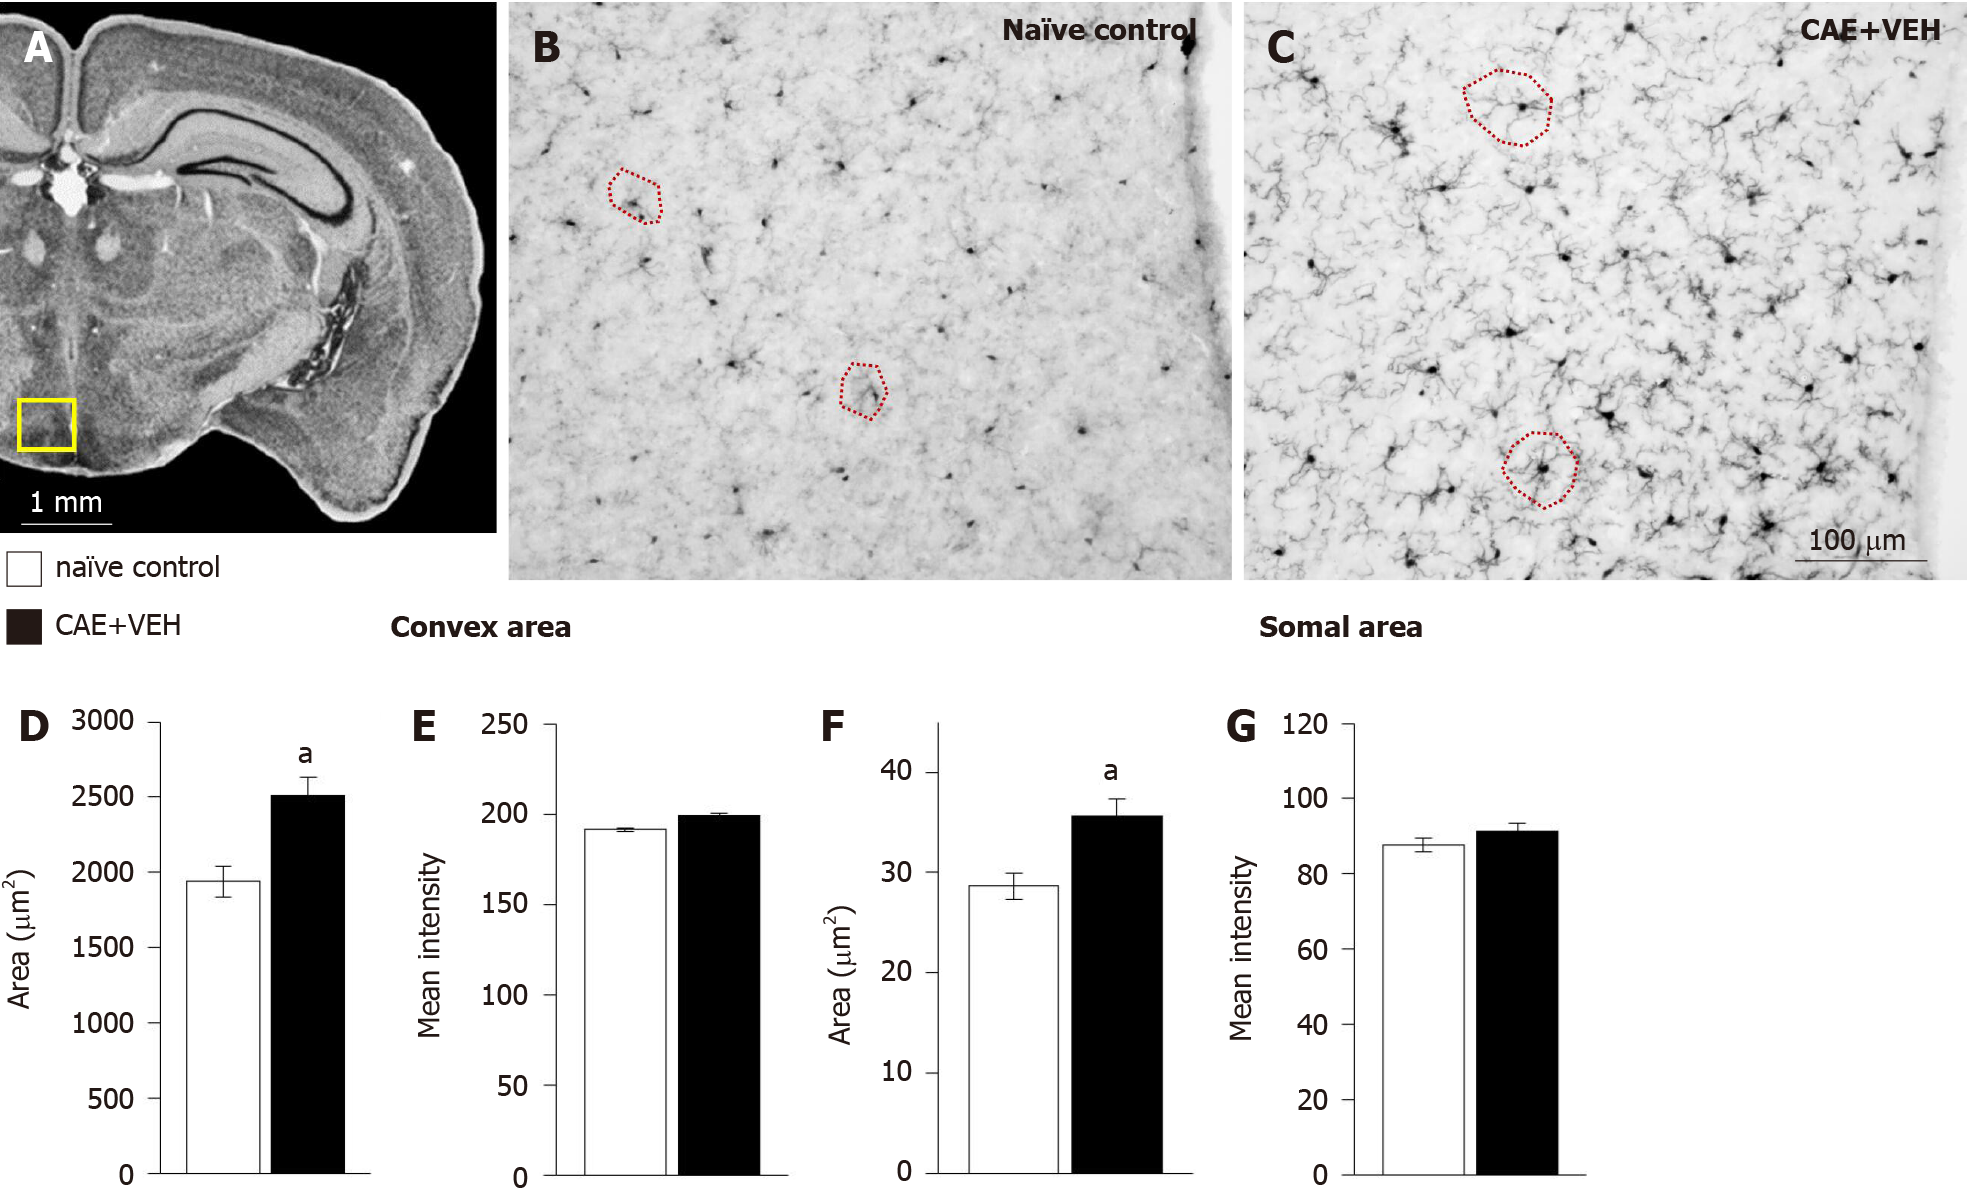
Figure 4 Microglia in the basolateral amygdala were activated only in mice with caerulein-induced pancreatitis.
A: Overview of the mouse brain shown at bregma -2.18 mm, interaural 1.62 mm[50,51]. The quantified area, the basolateral amygdala (BLA), is outlined in yellow; B and C: Examples of BLA from naïve control and vehicle treated caerulein- (CAE) induced pancreatitis mice were stained for ionized calcium-binding adaptor molecule 1; D and E: The convex area, the hull region of the microglia (samples outlined in red in B and C), was significantly enlarged and more intensely stained in mice with CAE-induced pancreatitis; F and G: Similarly, the somal area was significantly enlarged in tissue from mice with CAE-induced pancreatitis, though, the intensity of staining was not different. Naïve control n = 4, CAE + VEH n = 5, aP < 0.05 Student’s t-test. CAE: Caerulein; VEH: Vehicle.
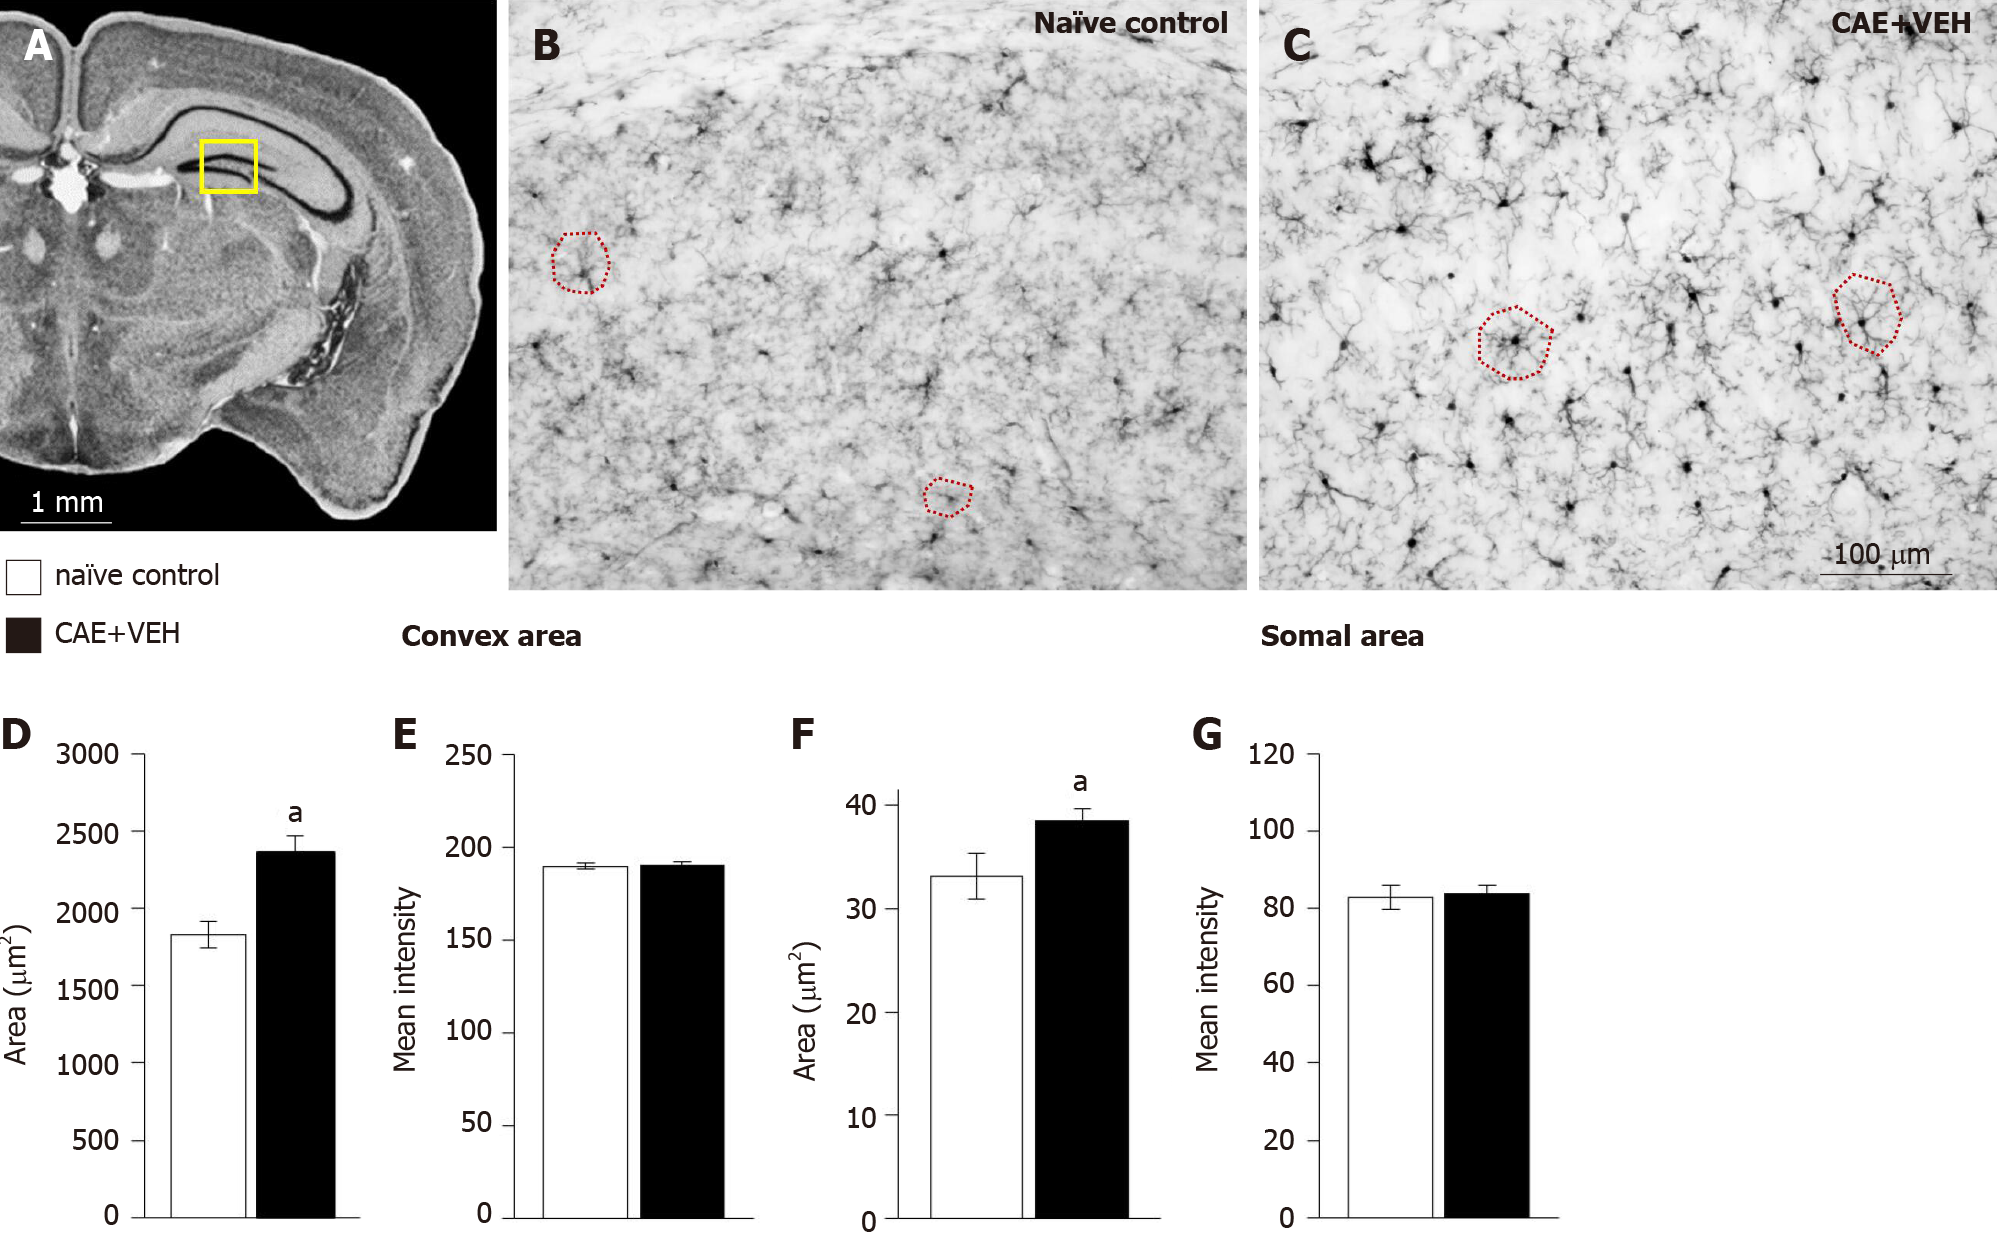
Figure 5 Enlarged microglial cells were measured in the dentate gyrus of mice with caerulein-induced pancreatitis compared to control samples.
A: The analyzed area is outlined in yellow in an overview of the mouse brain at bregma -2.18 mm, interaural 1.62 mm[50,51]; B and C: Microglia in the dentate gyrus of naïve control and in the caerulein- (CAE) induced pancreatitis mice were measured; D-G: Microglial convex (examples circled in red in B and C) and (F) somal area were significantly enlarged after 6 wk of CAE-induced pancreatitis while (E and G) intensity of ionized calcium-binding adaptor molecule 1 (Iba1) immunoreactivity was unchanged. Naïve control n = 4, CAE + VEH n = 5, aP < 0.05 Student’s t-test. CAE: Caerulein; VEH: Vehicle.
Figure 6 In the central lateral and paraventricular thalamic nuclei, microglial areas in mice with caerulein-induced pancreatitis were enlarged.
A: An overview of the mouse brain at bregma -2.18 mm, interaural 1.62 mm[50,51] is shown with the analyzed central lateral and paraventricular thalamic nuclei thalamic area analyzed outlined in yellow. B and C: Examples of microglia of naïve control and caerulein- (CAE) induced pancreatitis mice with sample convex areas circled in red; D and E: Microglial convex area and ionized calcium-binding adaptor molecule 1 (Iba1) staining intensity were significantly enhanced in animals with CAE-induced pancreatitis; F and G: Similarly, somal areas were significantly enlarged, yet, their Iba1 staining intensity was decreased. Naïve control n = 4, CAE + VEH n = 5, aP < 0.05 Student’s t-test. CAE: Caerulein; VEH: Vehicle.
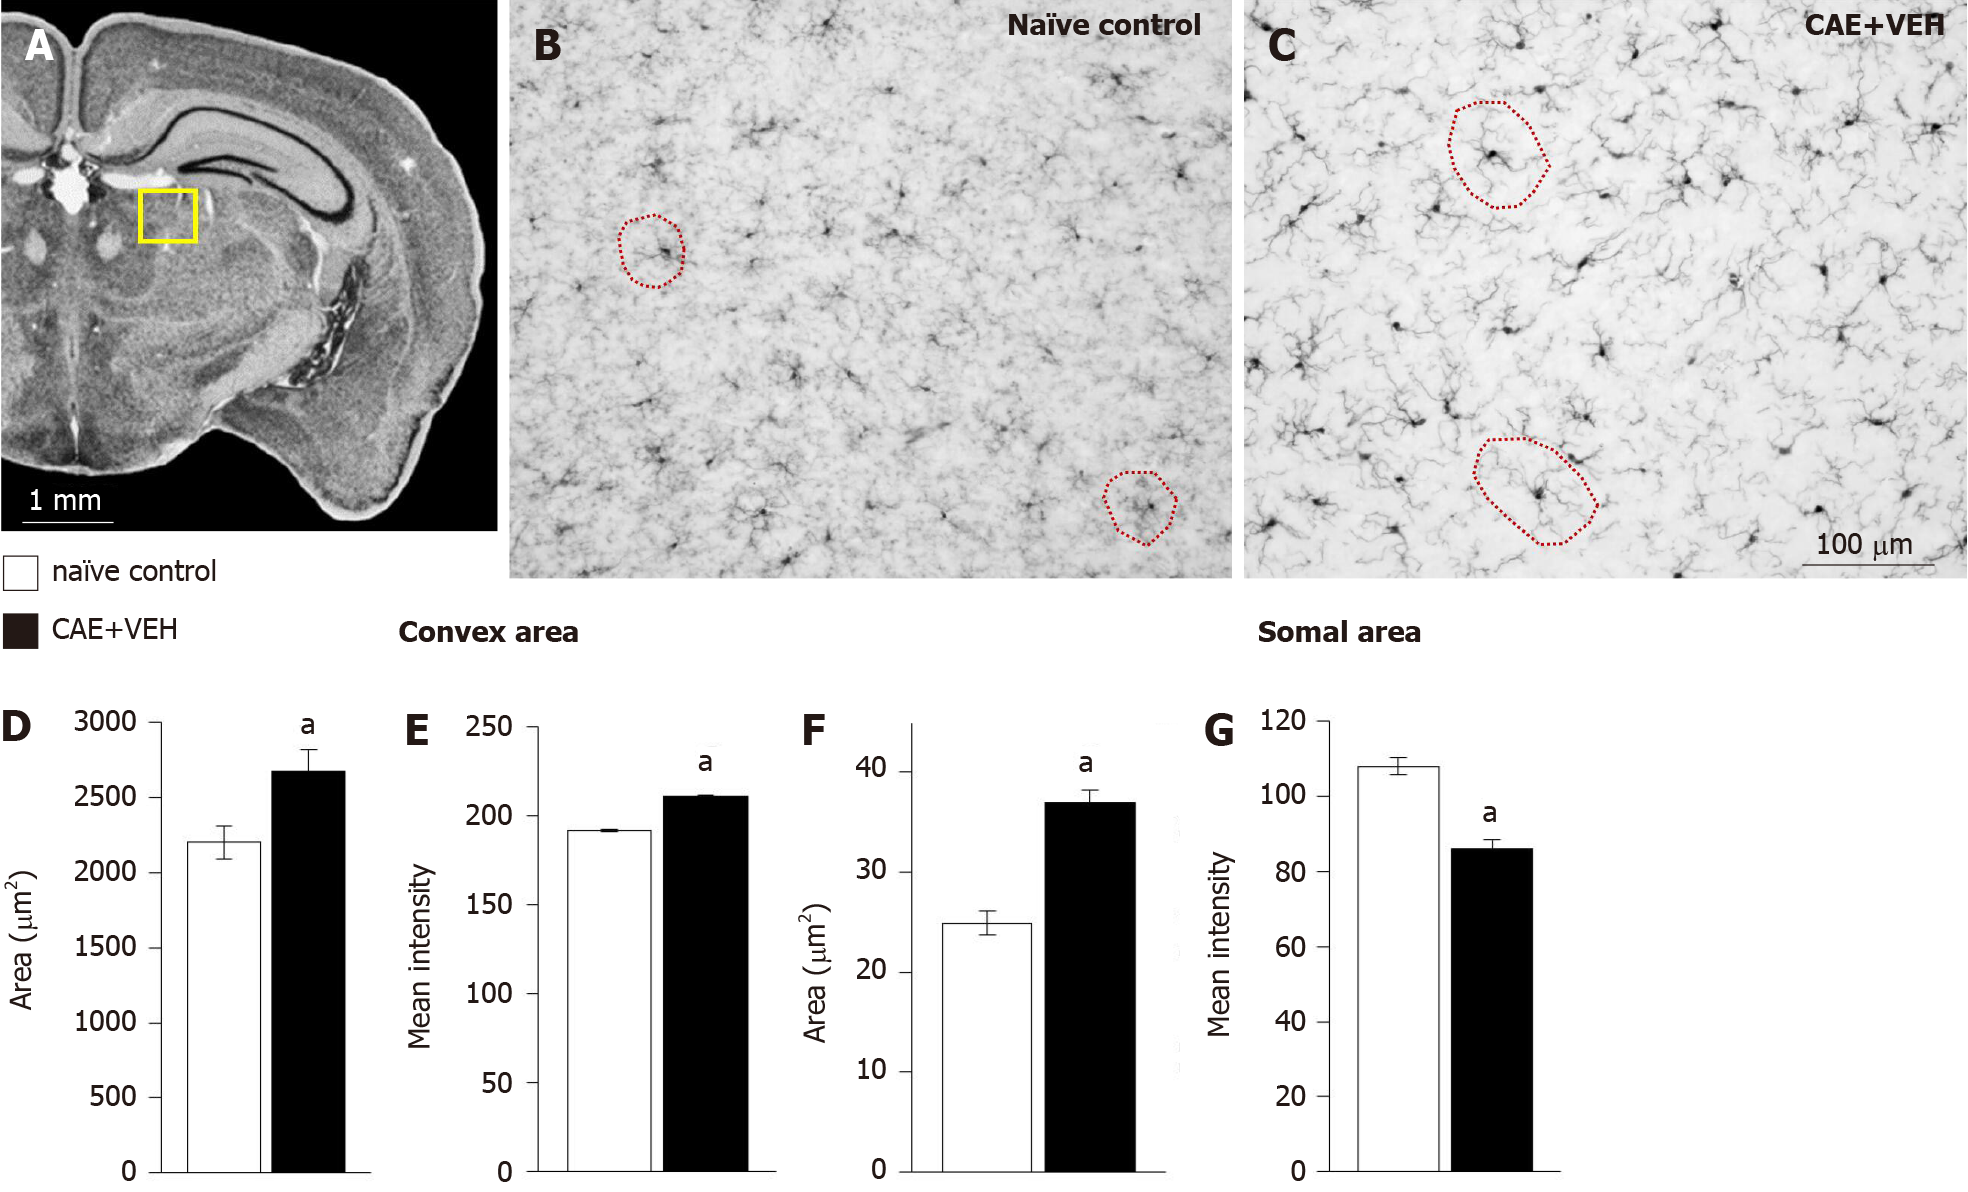
Figure 7 In the hypothalamic arcuate and dorsomedial nuclei, enlarged microglia were measured in mice with caerulein-induced pancreatitis.
A: The analyzed area is outlined in yellow in an overview of the mouse brain at bregma -2.18 mm, interaural 1.62 mm[50,51]; B-D and F: Microglia in arcuate and dorsomedial nuclei of naïve control and (C) caerulein- (CAE) induced pancreatitis mice had (D) significantly different convex (samples circled in red in B and C) and (F) somal areas; E and G: Intensity of ionized calcium-binding adaptor molecule 1 (Iba1) immunoreactivity was not different. Naïve control n = 4, CAE + VEH n = 5, aP < 0.05 Student’s t-test. CAE: Caerulein; VEH: Vehicle.
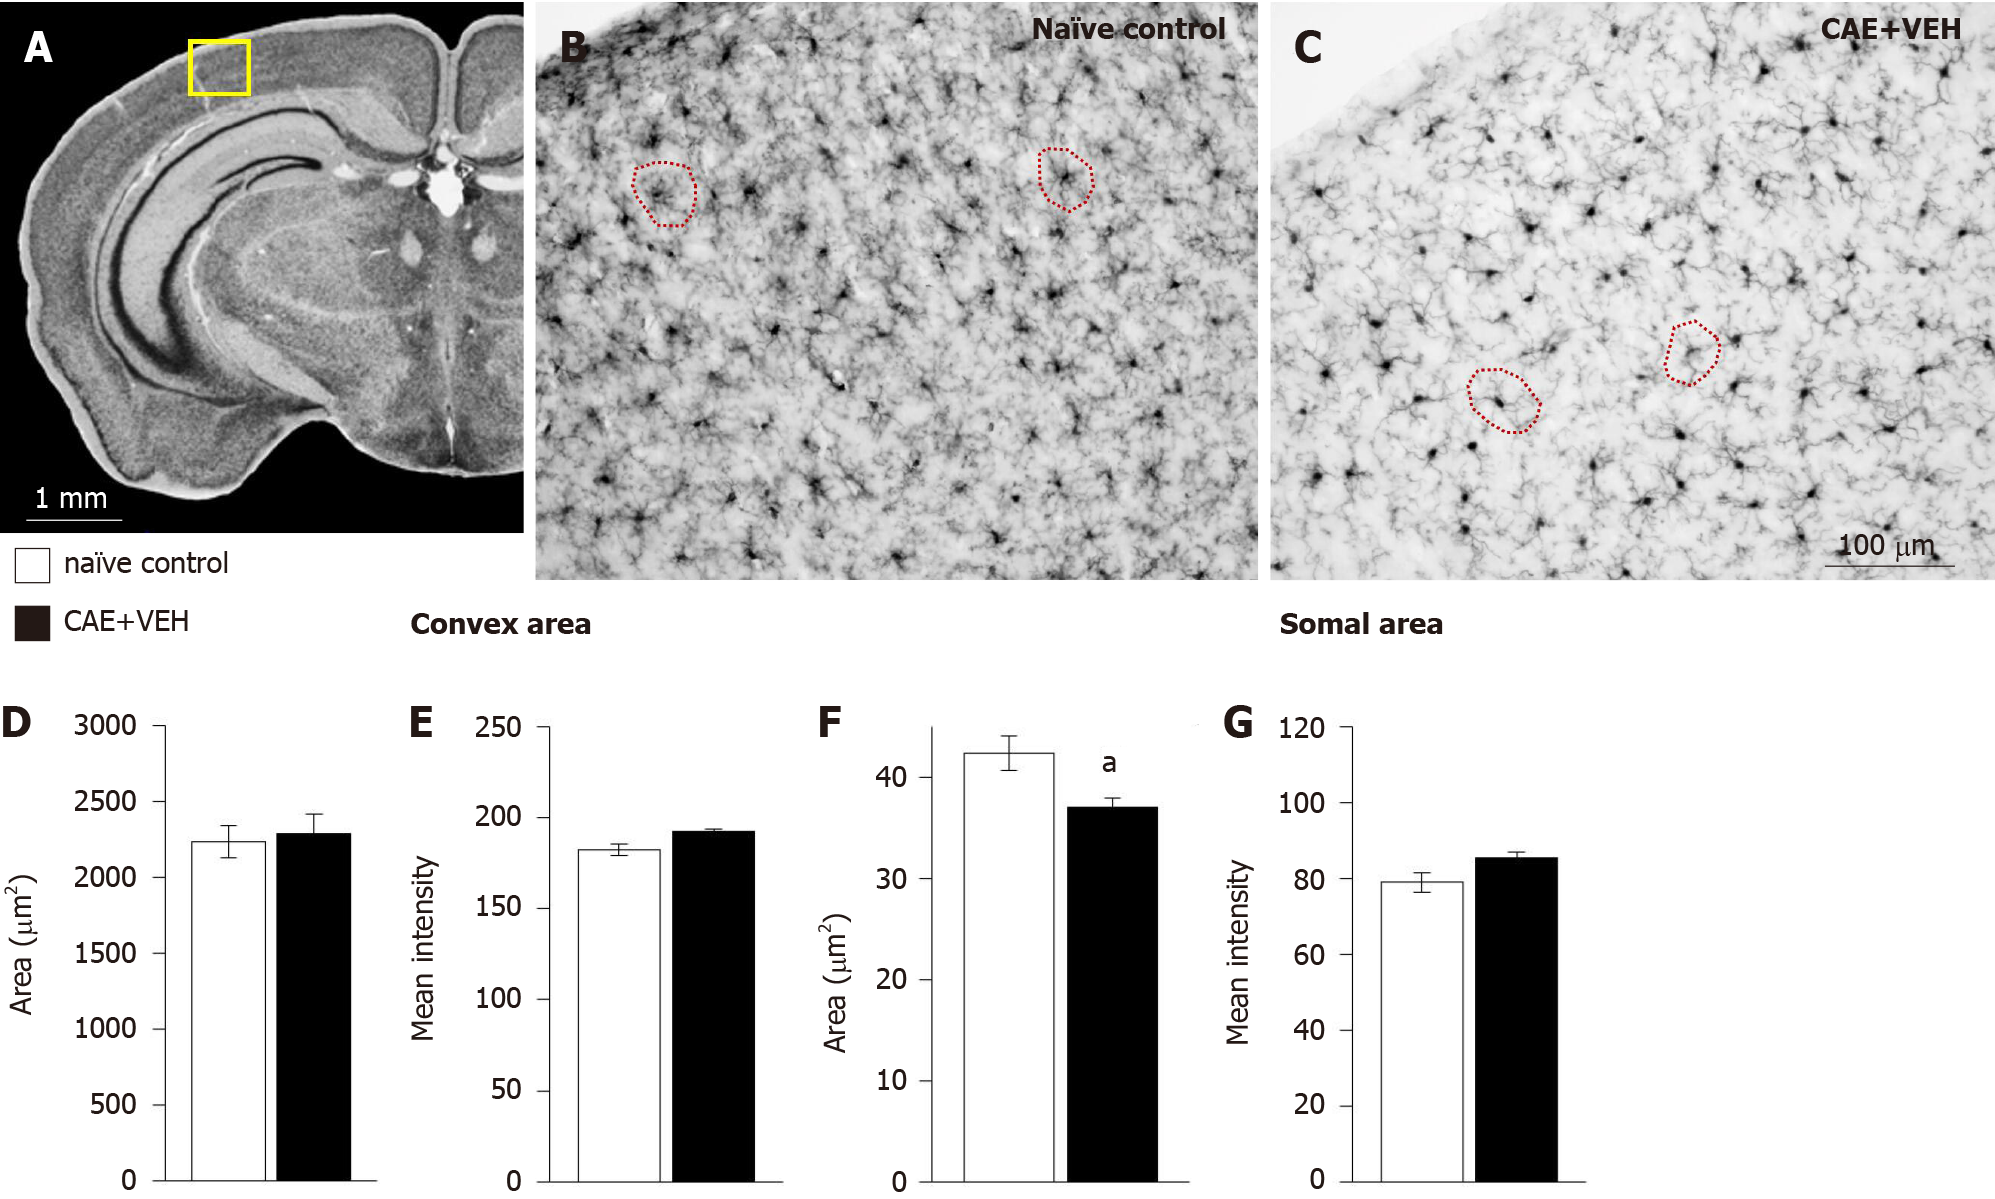
Figure 8 Microglia in the primary somatosensory cortex of mice with caerulein-induced pancreatitis were similar to those from controls.
A: The analyzed area is outlined in yellow in an overview of the mouse brain at bregma -2.18 mm, interaural 1.62 mm[50,51]. B-E: Microglia in (B) naïve control and (C) caerulein- (CAE) induced pancreatitis mice had (D) similar convex areas and (E) staining intensity for ionized calcium-binding adaptor molecule 1 (Iba1); F and G: In fact, their somal areas were significantly decreased in animals with CAE-induced pancreatitis compared to naïve mice, and their Iba1 staining intensity was not different. Naïve control n = 4, CAE + VEH n = 5, aP < 0.05 Student’s t-test. CAE: Caerulein; VEH: Vehicle.
- Citation: McIlwrath SL, Starr ME, High AE, Saito H, Westlund KN. Effect of acetyl-L-carnitine on hypersensitivity in acute recurrent caerulein-induced pancreatitis and microglial activation along the brain’s pain circuitry. World J Gastroenterol 2021; 27(9): 794-814
- URL: https://www.wjgnet.com/1007-9327/full/v27/i9/794.htm
- DOI: https://dx.doi.org/10.3748/wjg.v27.i9.794


