Copyright
©The Author(s) 2021.
World J Gastroenterol. Dec 28, 2021; 27(48): 8357-8369
Published online Dec 28, 2021. doi: 10.3748/wjg.v27.i48.8357
Published online Dec 28, 2021. doi: 10.3748/wjg.v27.i48.8357
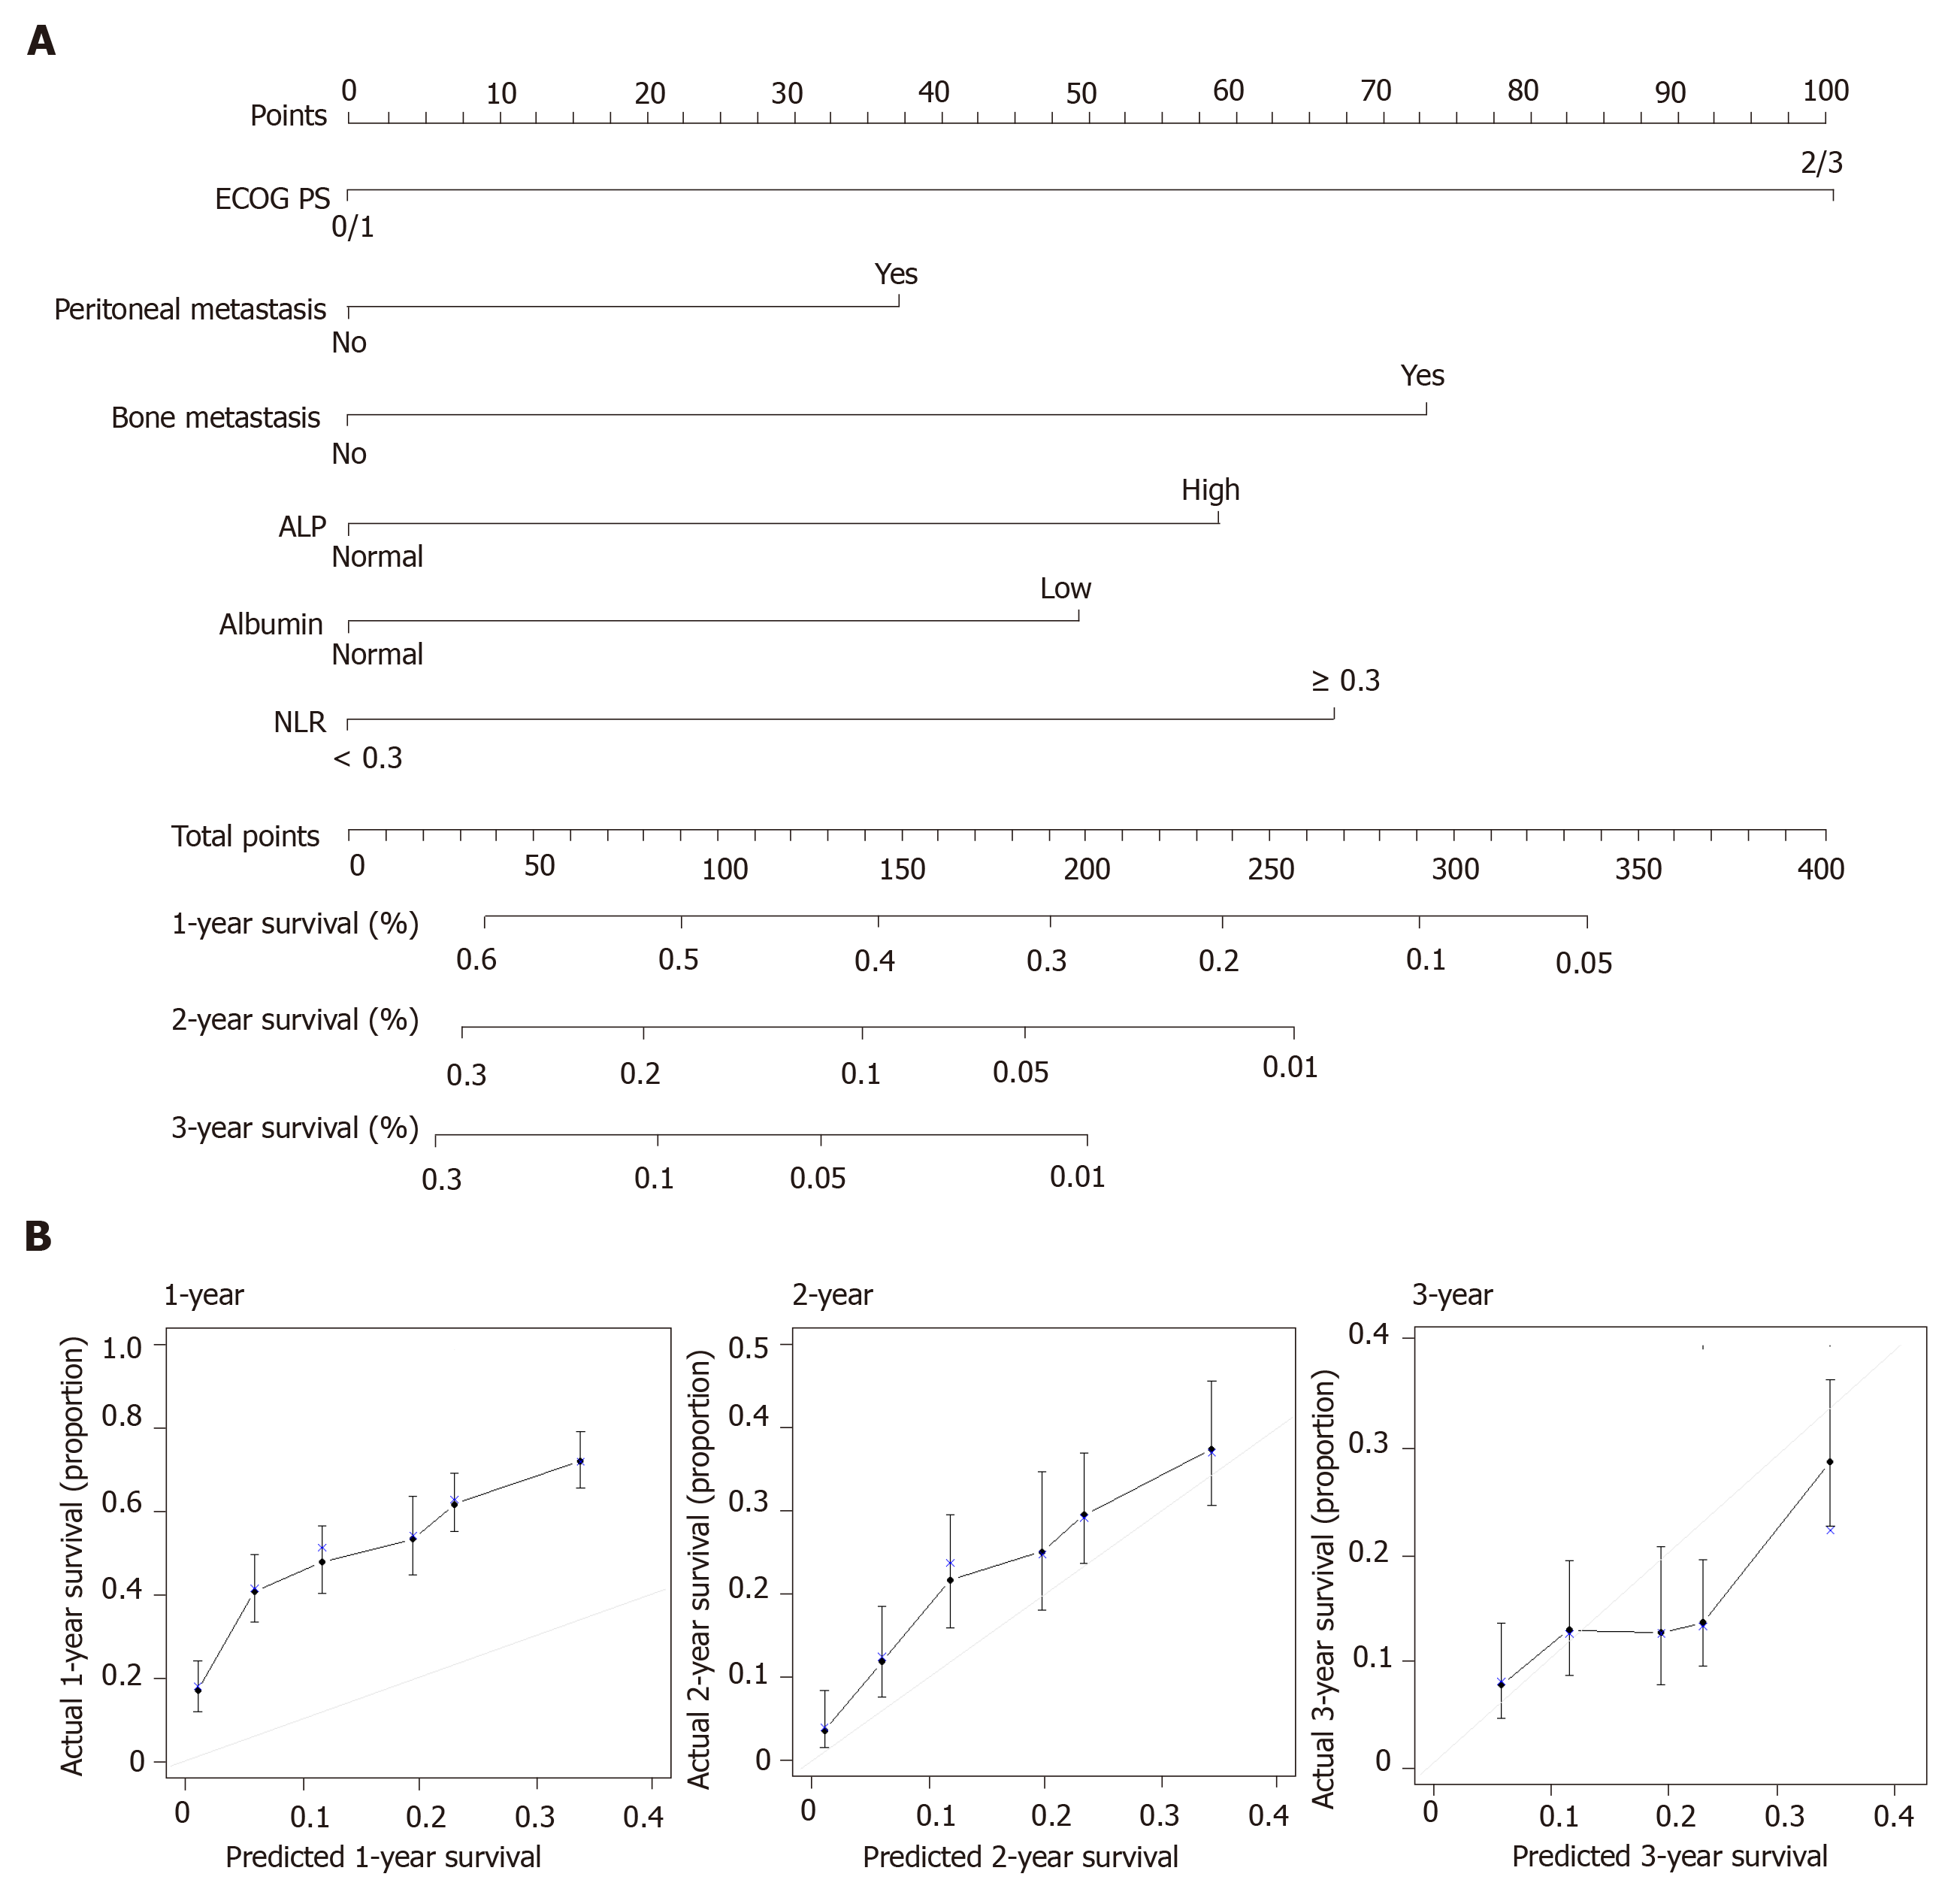
Figure 1 The nomogram using six factors to predict survival rates in the training set.
A: The nomogram was applied by summing the scores projected onto the corresponding scale for each factor. The total number of scores projected onto the bottom scale represents the probability of one-, two-, and three-year overall survival; B: The calibration plots of the nomogram, where the X-axis represents the survival rate predicted by the nomogram, and the Y-axis represents the actual survival rate calculated by a Kaplan–Meier analysis. ALP: Alkaline phosphatase; NLR: Neutrophil-lymphocyte ratio; ECOG PS: Eastern Cooperative Oncology Group performance score.
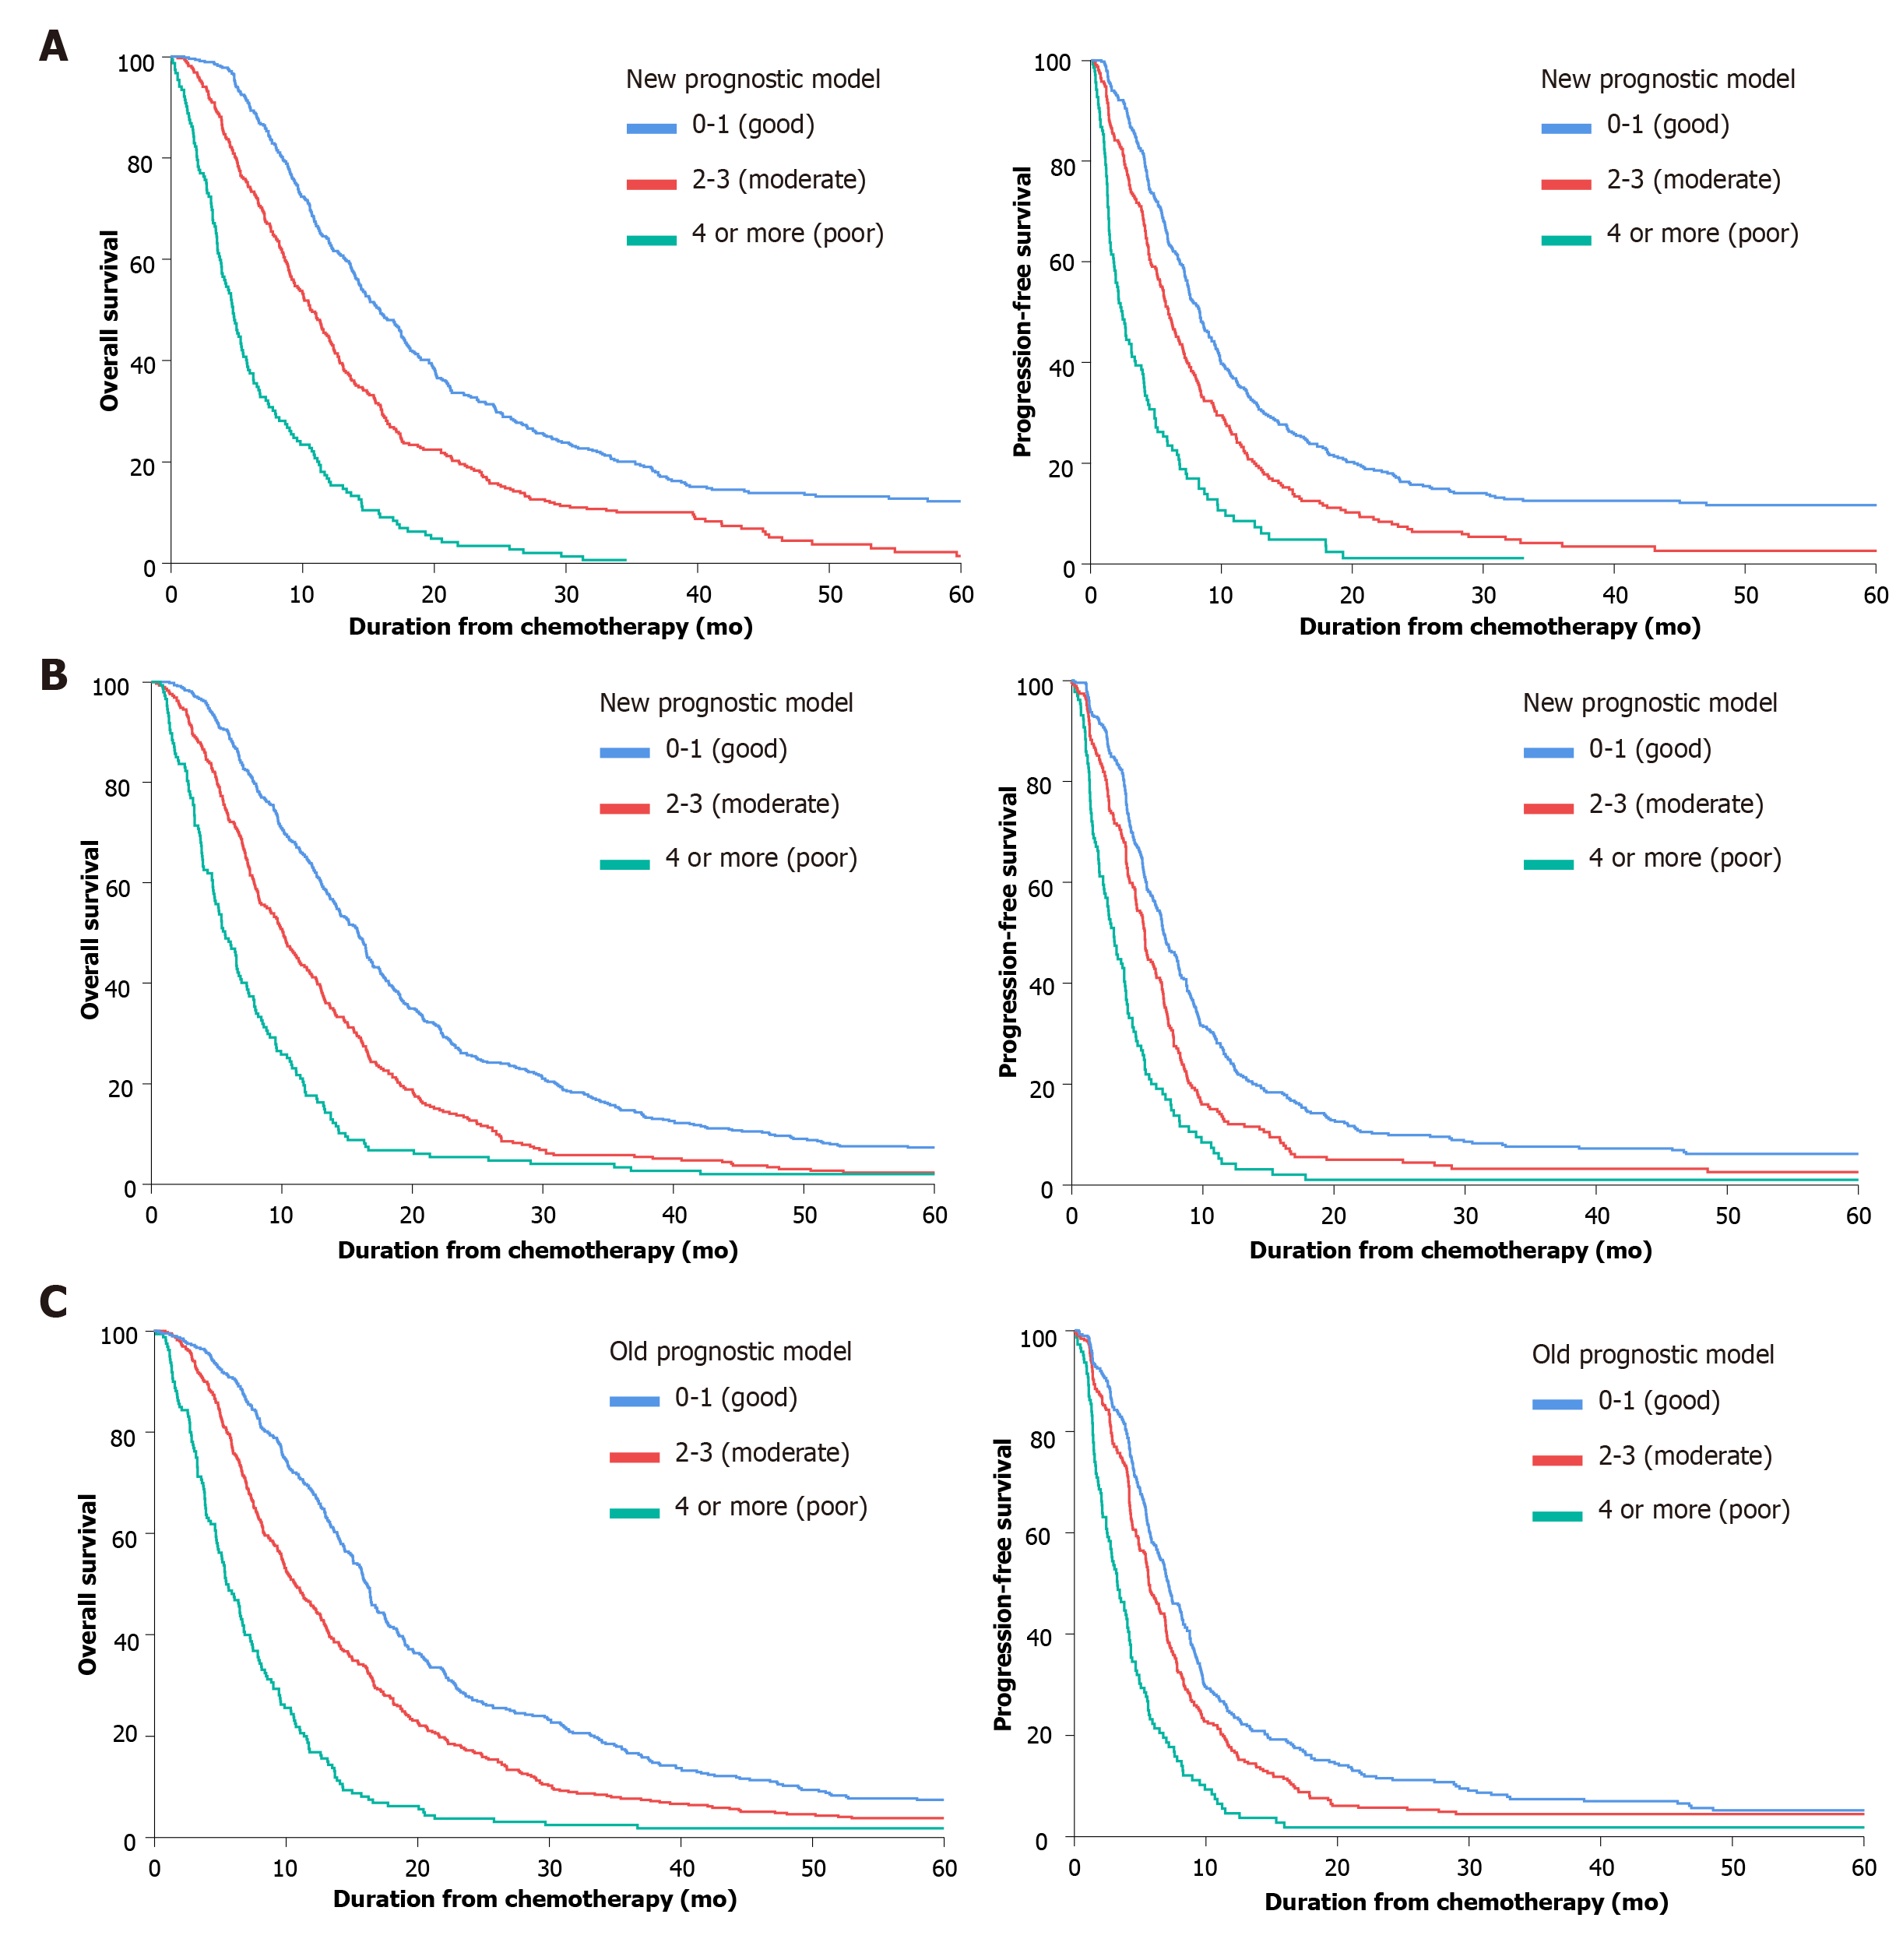
Figure 2 Overall survival and progression-free survival curves according to the new prognostic model.
A: In the training set; B: In the validation set; C: According to the old prognostic model in the validation set.
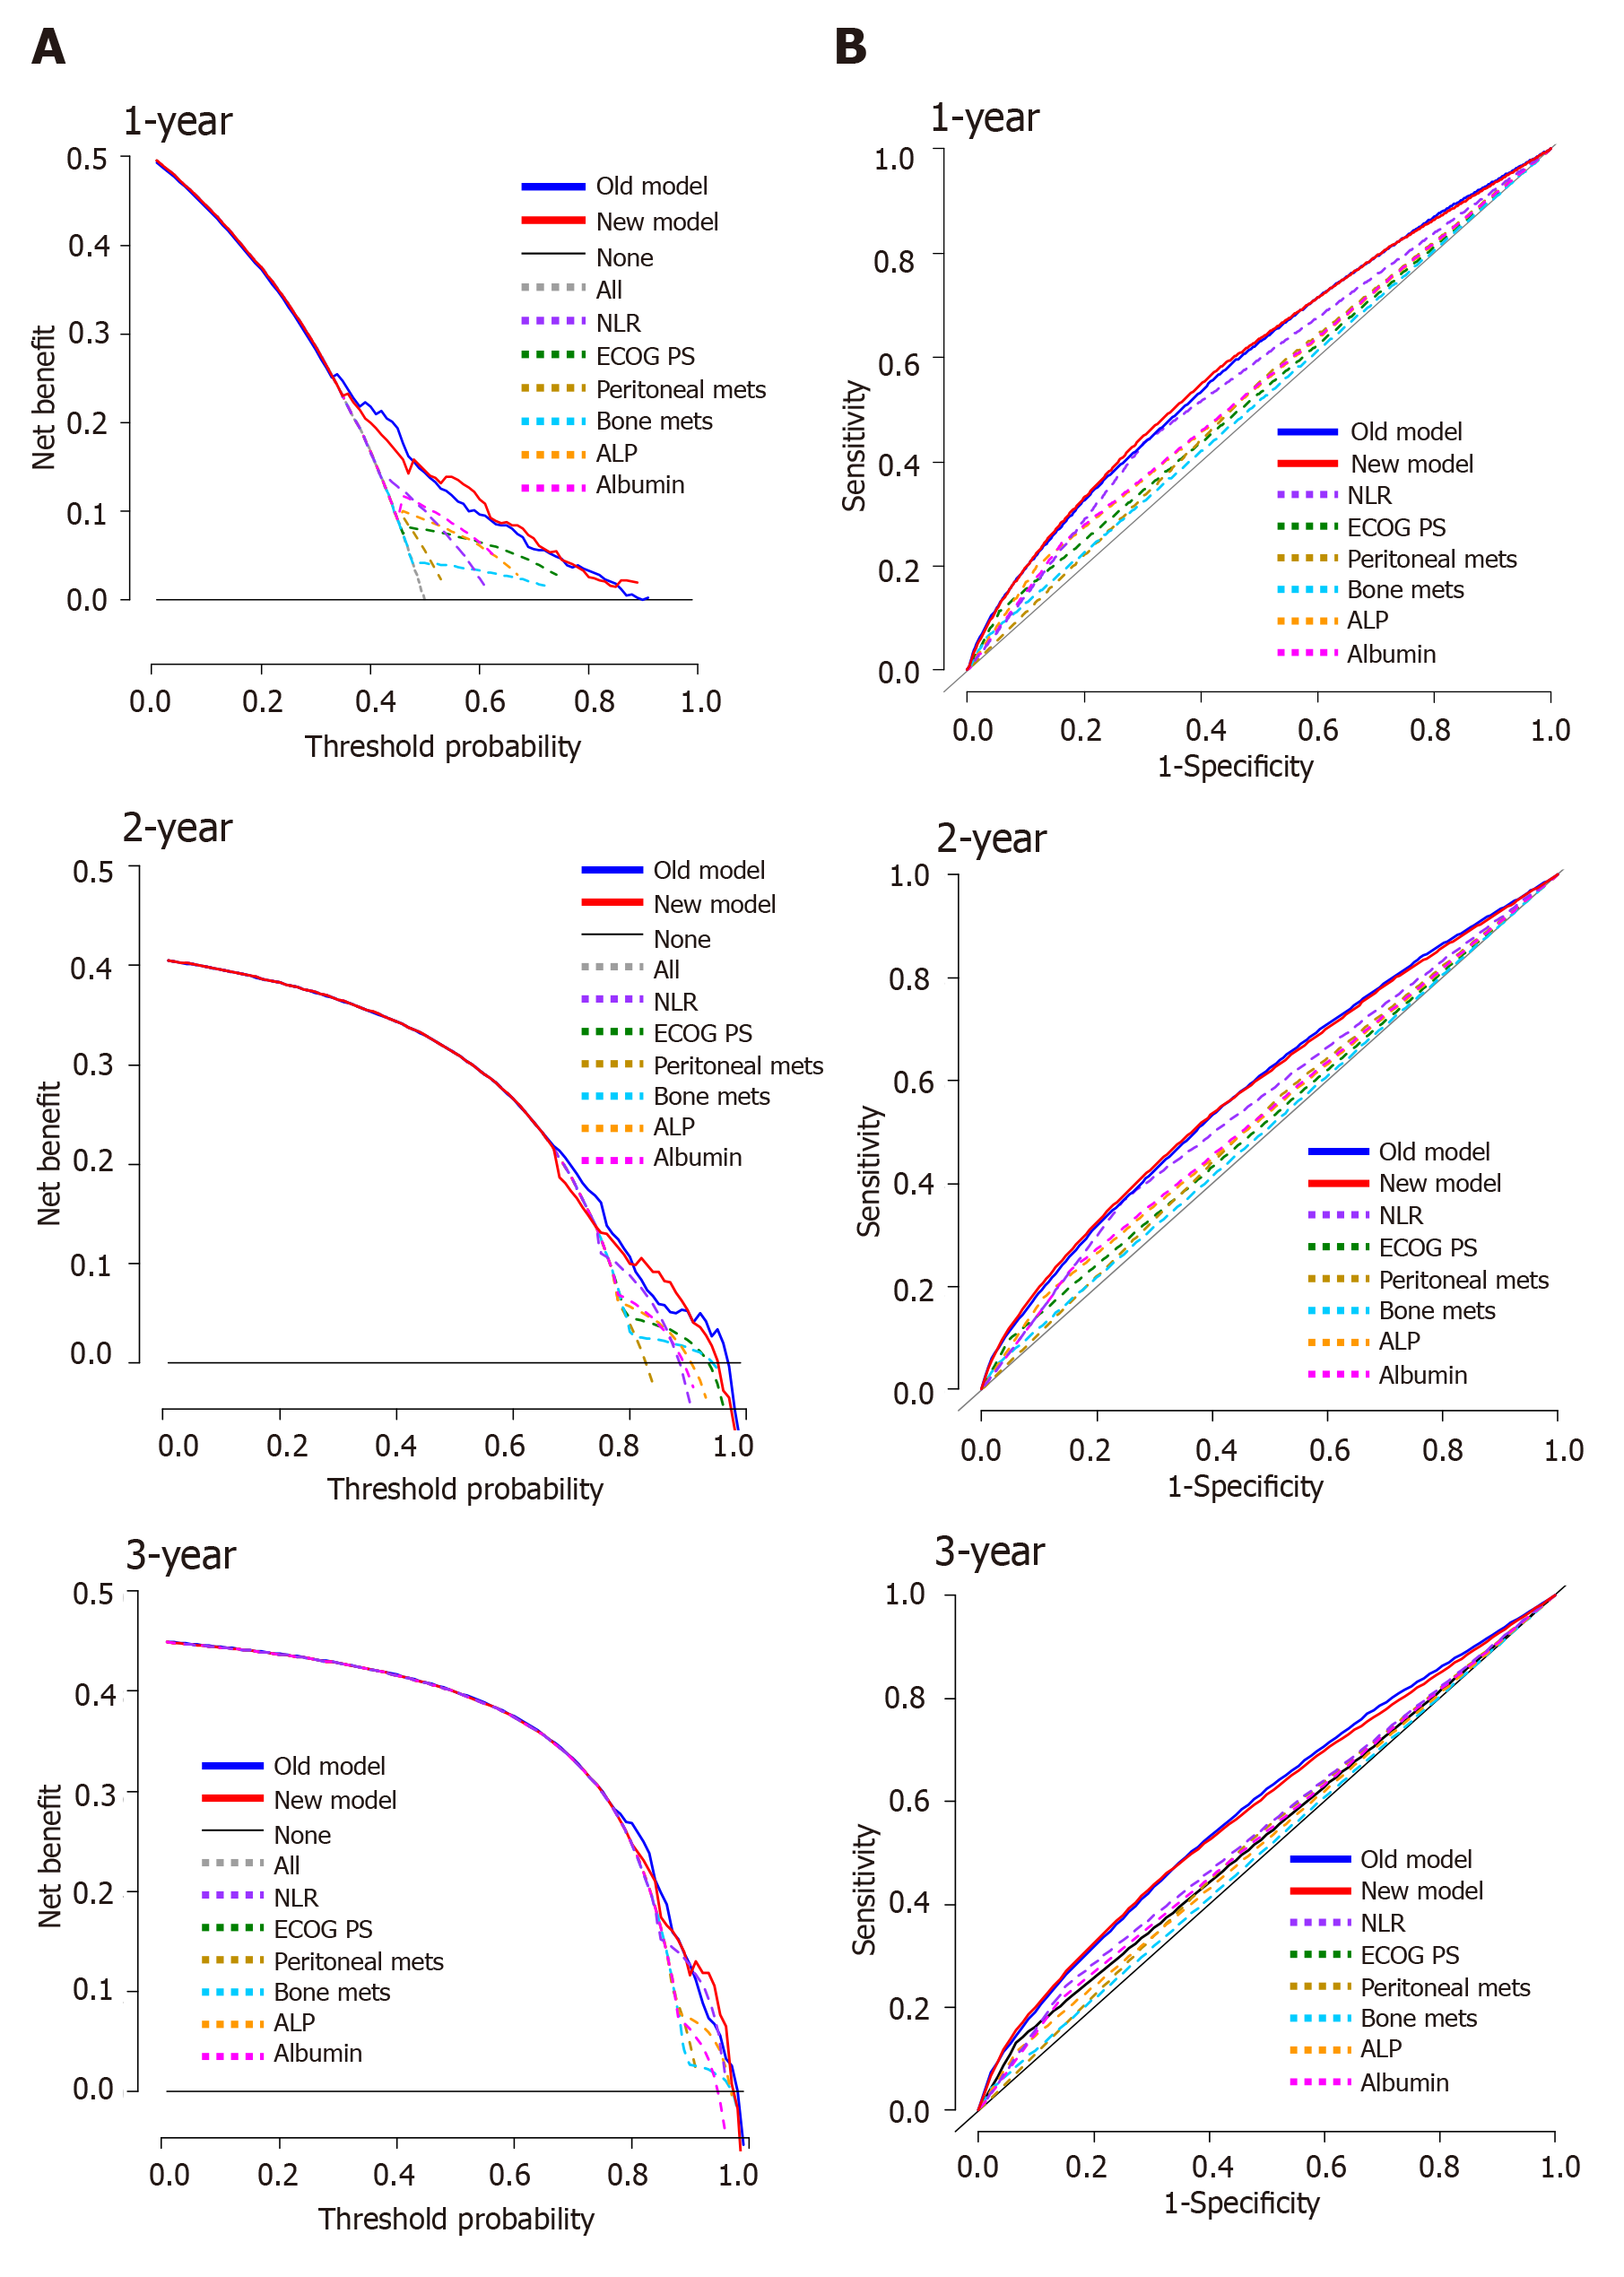
Figure 3 Decision curve analysis curves and time-dependent receiver operating characteristic curves for the nomogram in the validation set.
A: The calculated net benefit (Y-axis) corresponds to the threshold probability of survival on the X-axis; B: The time-dependent receiver operating characteristic curve assesses the accuracy of the nomogram. ALP: Alkaline phosphatase; NLR: Neutrophil-lymphocyte ratio; ECOG PS: Eastern Cooperative Oncology Group performance score.
- Citation: Koo DH, Ryu MH, Lee MY, Moon MS, Kang YK. New prognostic model for patients with advanced gastric cancer: Fluoropyrimidine/platinum doublet for first-line chemotherapy. World J Gastroenterol 2021; 27(48): 8357-8369
- URL: https://www.wjgnet.com/1007-9327/full/v27/i48/8357.htm
- DOI: https://dx.doi.org/10.3748/wjg.v27.i48.8357


