Copyright
©The Author(s) 2021.
World J Gastroenterol. Dec 28, 2021; 27(48): 8323-8342
Published online Dec 28, 2021. doi: 10.3748/wjg.v27.i48.8323
Published online Dec 28, 2021. doi: 10.3748/wjg.v27.i48.8323
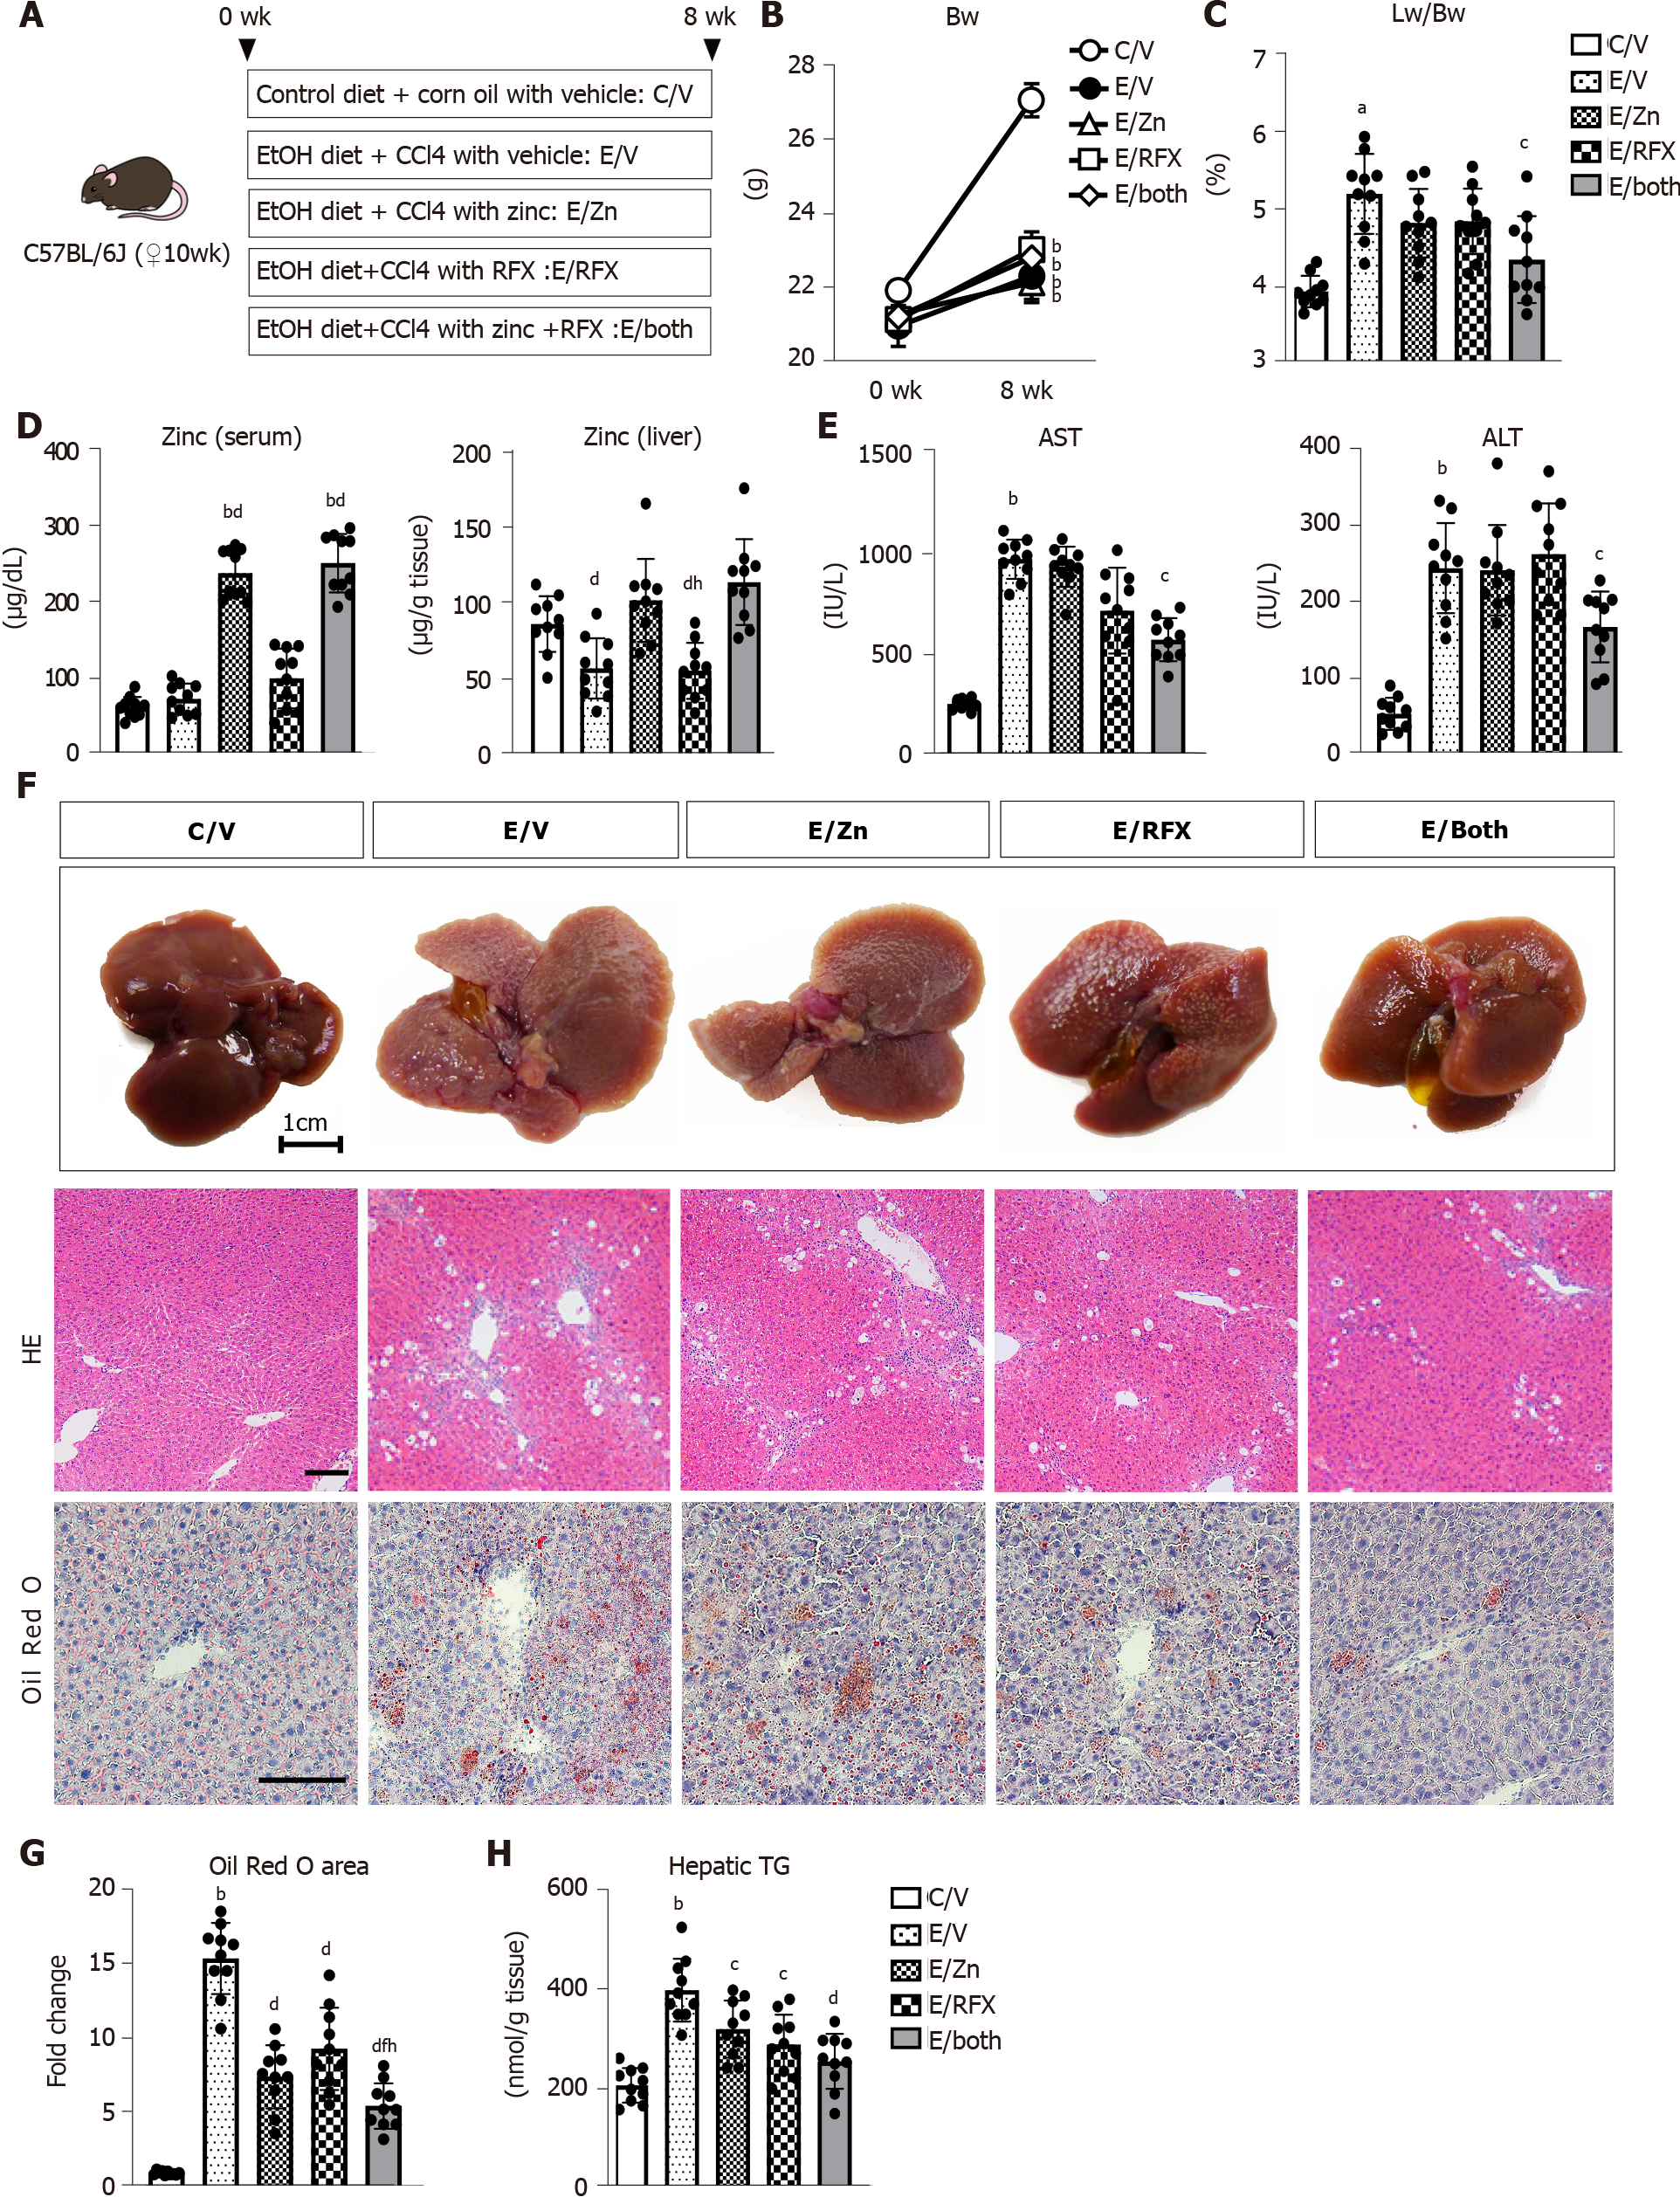
Figure 1 Zinc acetate and rifaximin against hepatic steatosis in alcoholic liver disease mice.
A: Experimental protocols; B: Changes in body weights during experimental period; C: Ratio of liver weight to body weight at the end of experiment; D: Zinc concentrations of the serum (left) and the liver (right); E: Serum levels of aspartate aminotransferase (left) and alanine aminotransferase (right); F: Representative macroscopic appearances (upper), microphotographs of hematoxylin and eosin (middle) and Oil Red O staining (lower) of the livers in the experimental mice. Scale bar: 25 μm; G: Semi-quantification of lipid accumulation stained by Oil Red O in high-power field by NIH imageJ software. Histochemical quantitative analyses included five fields per section. Quantitative values are indicated as fold changes to the values of C/V group; H: Hepatic concentrations of triglyceride. Data are mean ± SD (n = 10), aP < 0.05 and bP < 0.01 vs C/V group; cP < 0.05 and dP < 0.01 vs E/V group; eP < 0.05 and fP < 0.01 vs E/Zn group; gP < 0.05 and hP < 0.01 vs E/RFX group. AST: Aspartate aminotransferase; ALT: Alanine aminotransferase; HE: Hematoxylin and eosin.
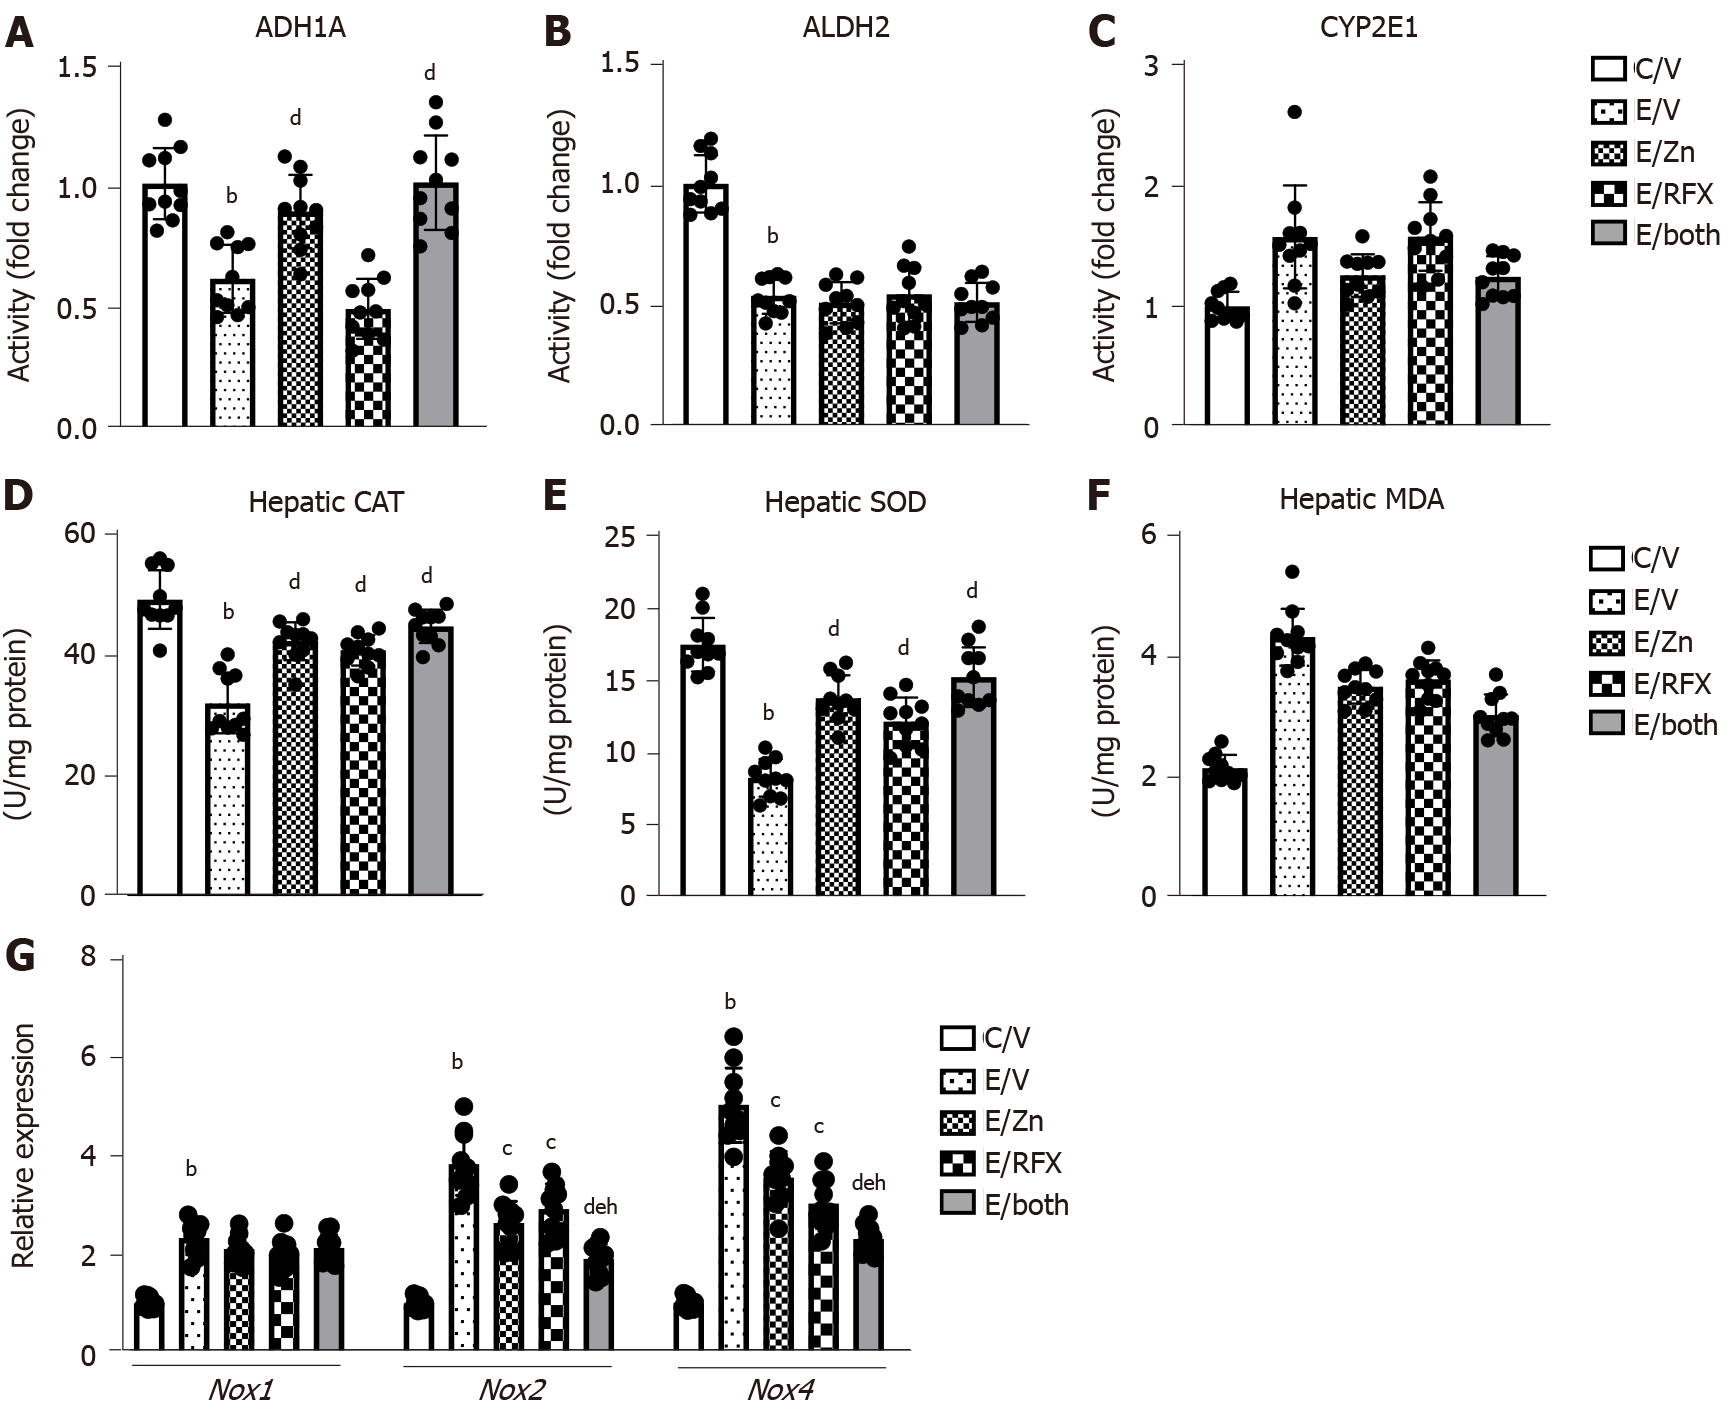
Figure 2 Zinc acetate and rifaximin on ethanol metabolism and accumulation of oxidative stress in alcoholic liver disease mice.
A-C: Hepatic activity of alcohol dehydrogenase 1 (A), aldehyde dehydrogenase 2 (B) and cytochrome P450 2E1 (CYP2E1) (C). Quantitative values are indicated as fold changes to the values of C/V group; D-F: Hepatic levels of of catalase (D), superoxide dismutase (E) and malondialdehyde (F); G: Relative mRNA expression levels of Nox1, Nox2 and Nox4 in the liver of experimental mice. The mRNA expression levels were measured by RT-qPCR, and Gapdh was used as internal control. Quantitative values are indicated as fold changes to the values of C/V group. Data are mean ± SD (n = 10), aP < 0.05 and bP < 0.01 vs C/V group; cP < 0.05 and dP < 0.01 vs E/V group; eP < 0.05 and fP < 0.01 vs E/Zn group; gP < 0.05 and hP < 0.01 vs E/RFX group. ADH1: Alcohol dehydrogenase 1; ALDH2: Aldehyde dehydrogenase 2; CAT: Catalase; SOD: Superoxide dismutase; MDA: Malondialdehyde.
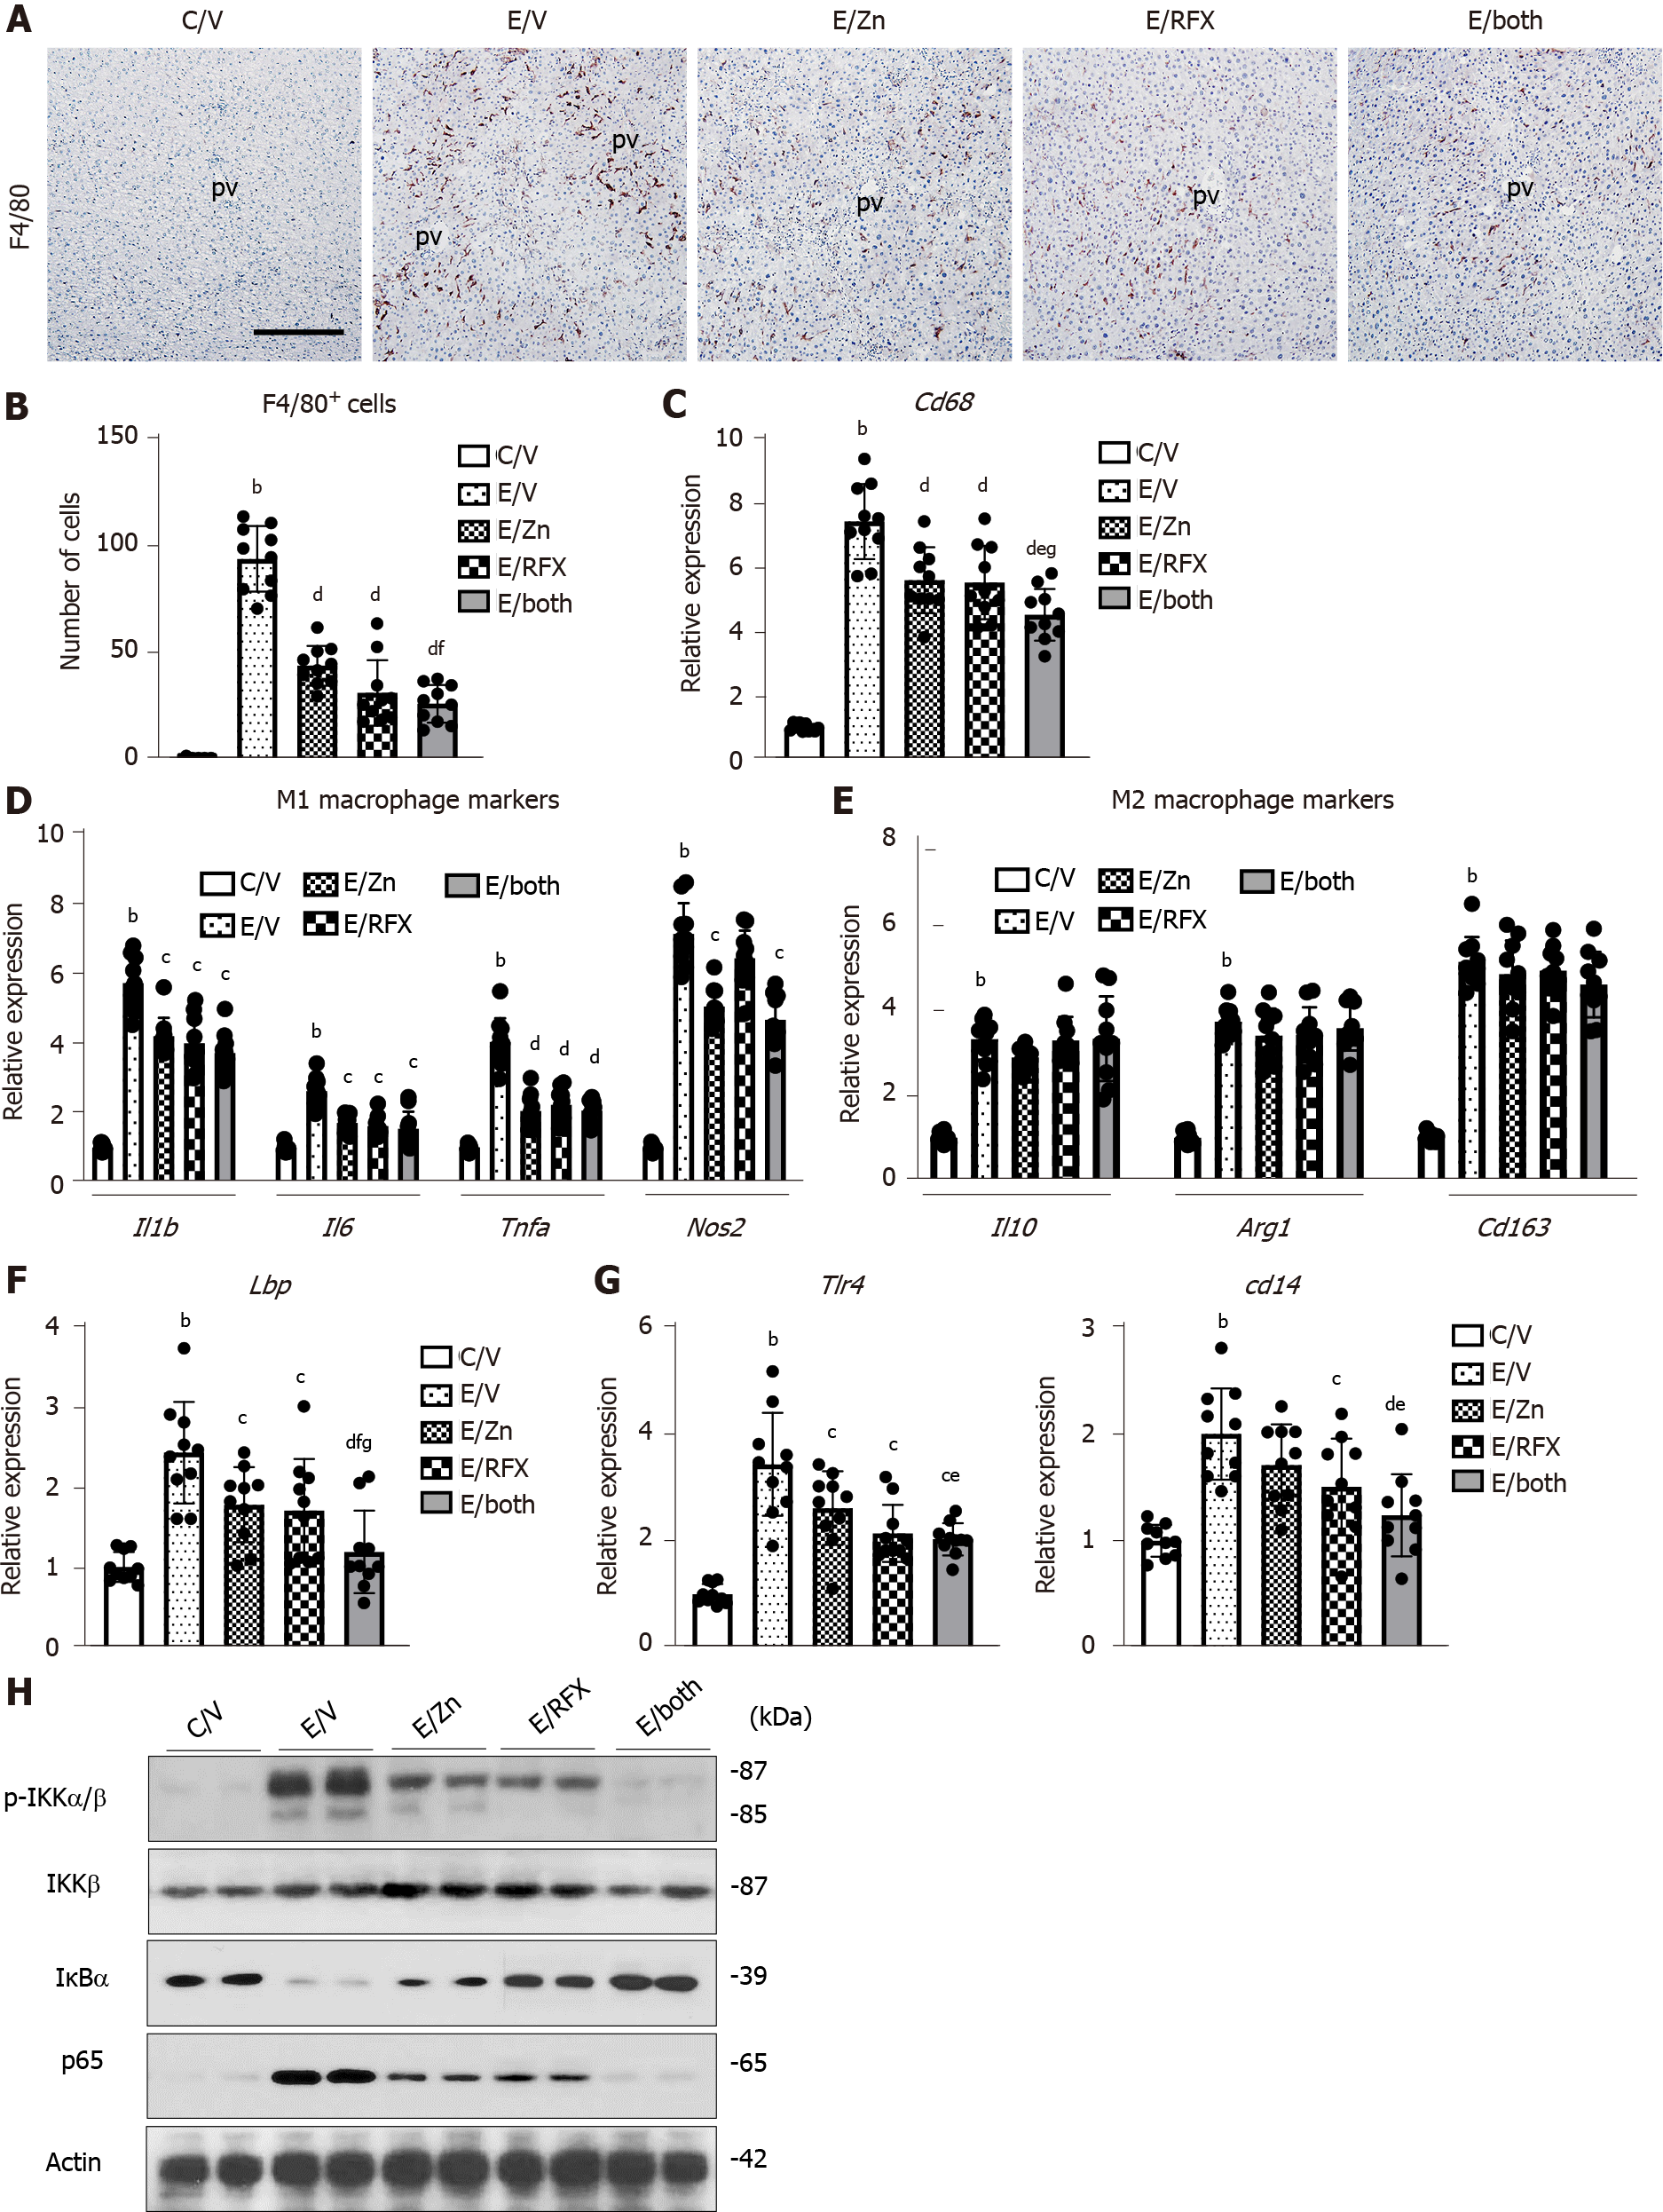
Figure 3 Zinc acetate and rifaximin against toll-like receptor 4-mediated pro-inflammatory response in alcoholic liver disease mice.
A: Representative microphotographs of liver sections stained with F4/80. Scale bar: 50 μm. B: Semi-quantitation of F4/80 immuno-positive Kupffer cells in high-power field by NIH imageJ software. Histochemical quantitative analyses included five fields per section; C-G: Relative mRNA expression level of Cd68 (C), M1-polarized macrophage-related genes (Il1b, Il6, Tnfa and Nos2) (D), M2-polarized macrophage-related genes (Il10, Arg1 and Cd163) (E), Lbp (F), Tlr4 and Cd14 (G) in the liver of experimental mice. The mRNA expression levels were measured by RT-qPCR, and Gapdh was used as internal control. Quantitative values are indicated as fold changes to the values of C/V group; H: Western blots for p-IKKα/β, IKKβ, IkBα and NF-kB p65 in the liver of experimental mice. Actin was used as internal control. Data are mean ± SD (B-G; n = 10), aP < 0.05 and bP < 0.01 vs C/V group; cP < 0.05 and dP < 0.01 vs E/V group; eP < 0.05 and fP < 0.01 vs E/Zn group; gP < 0.05 and hP < 0.01 vs E/RFX group. pv: Portal vein.
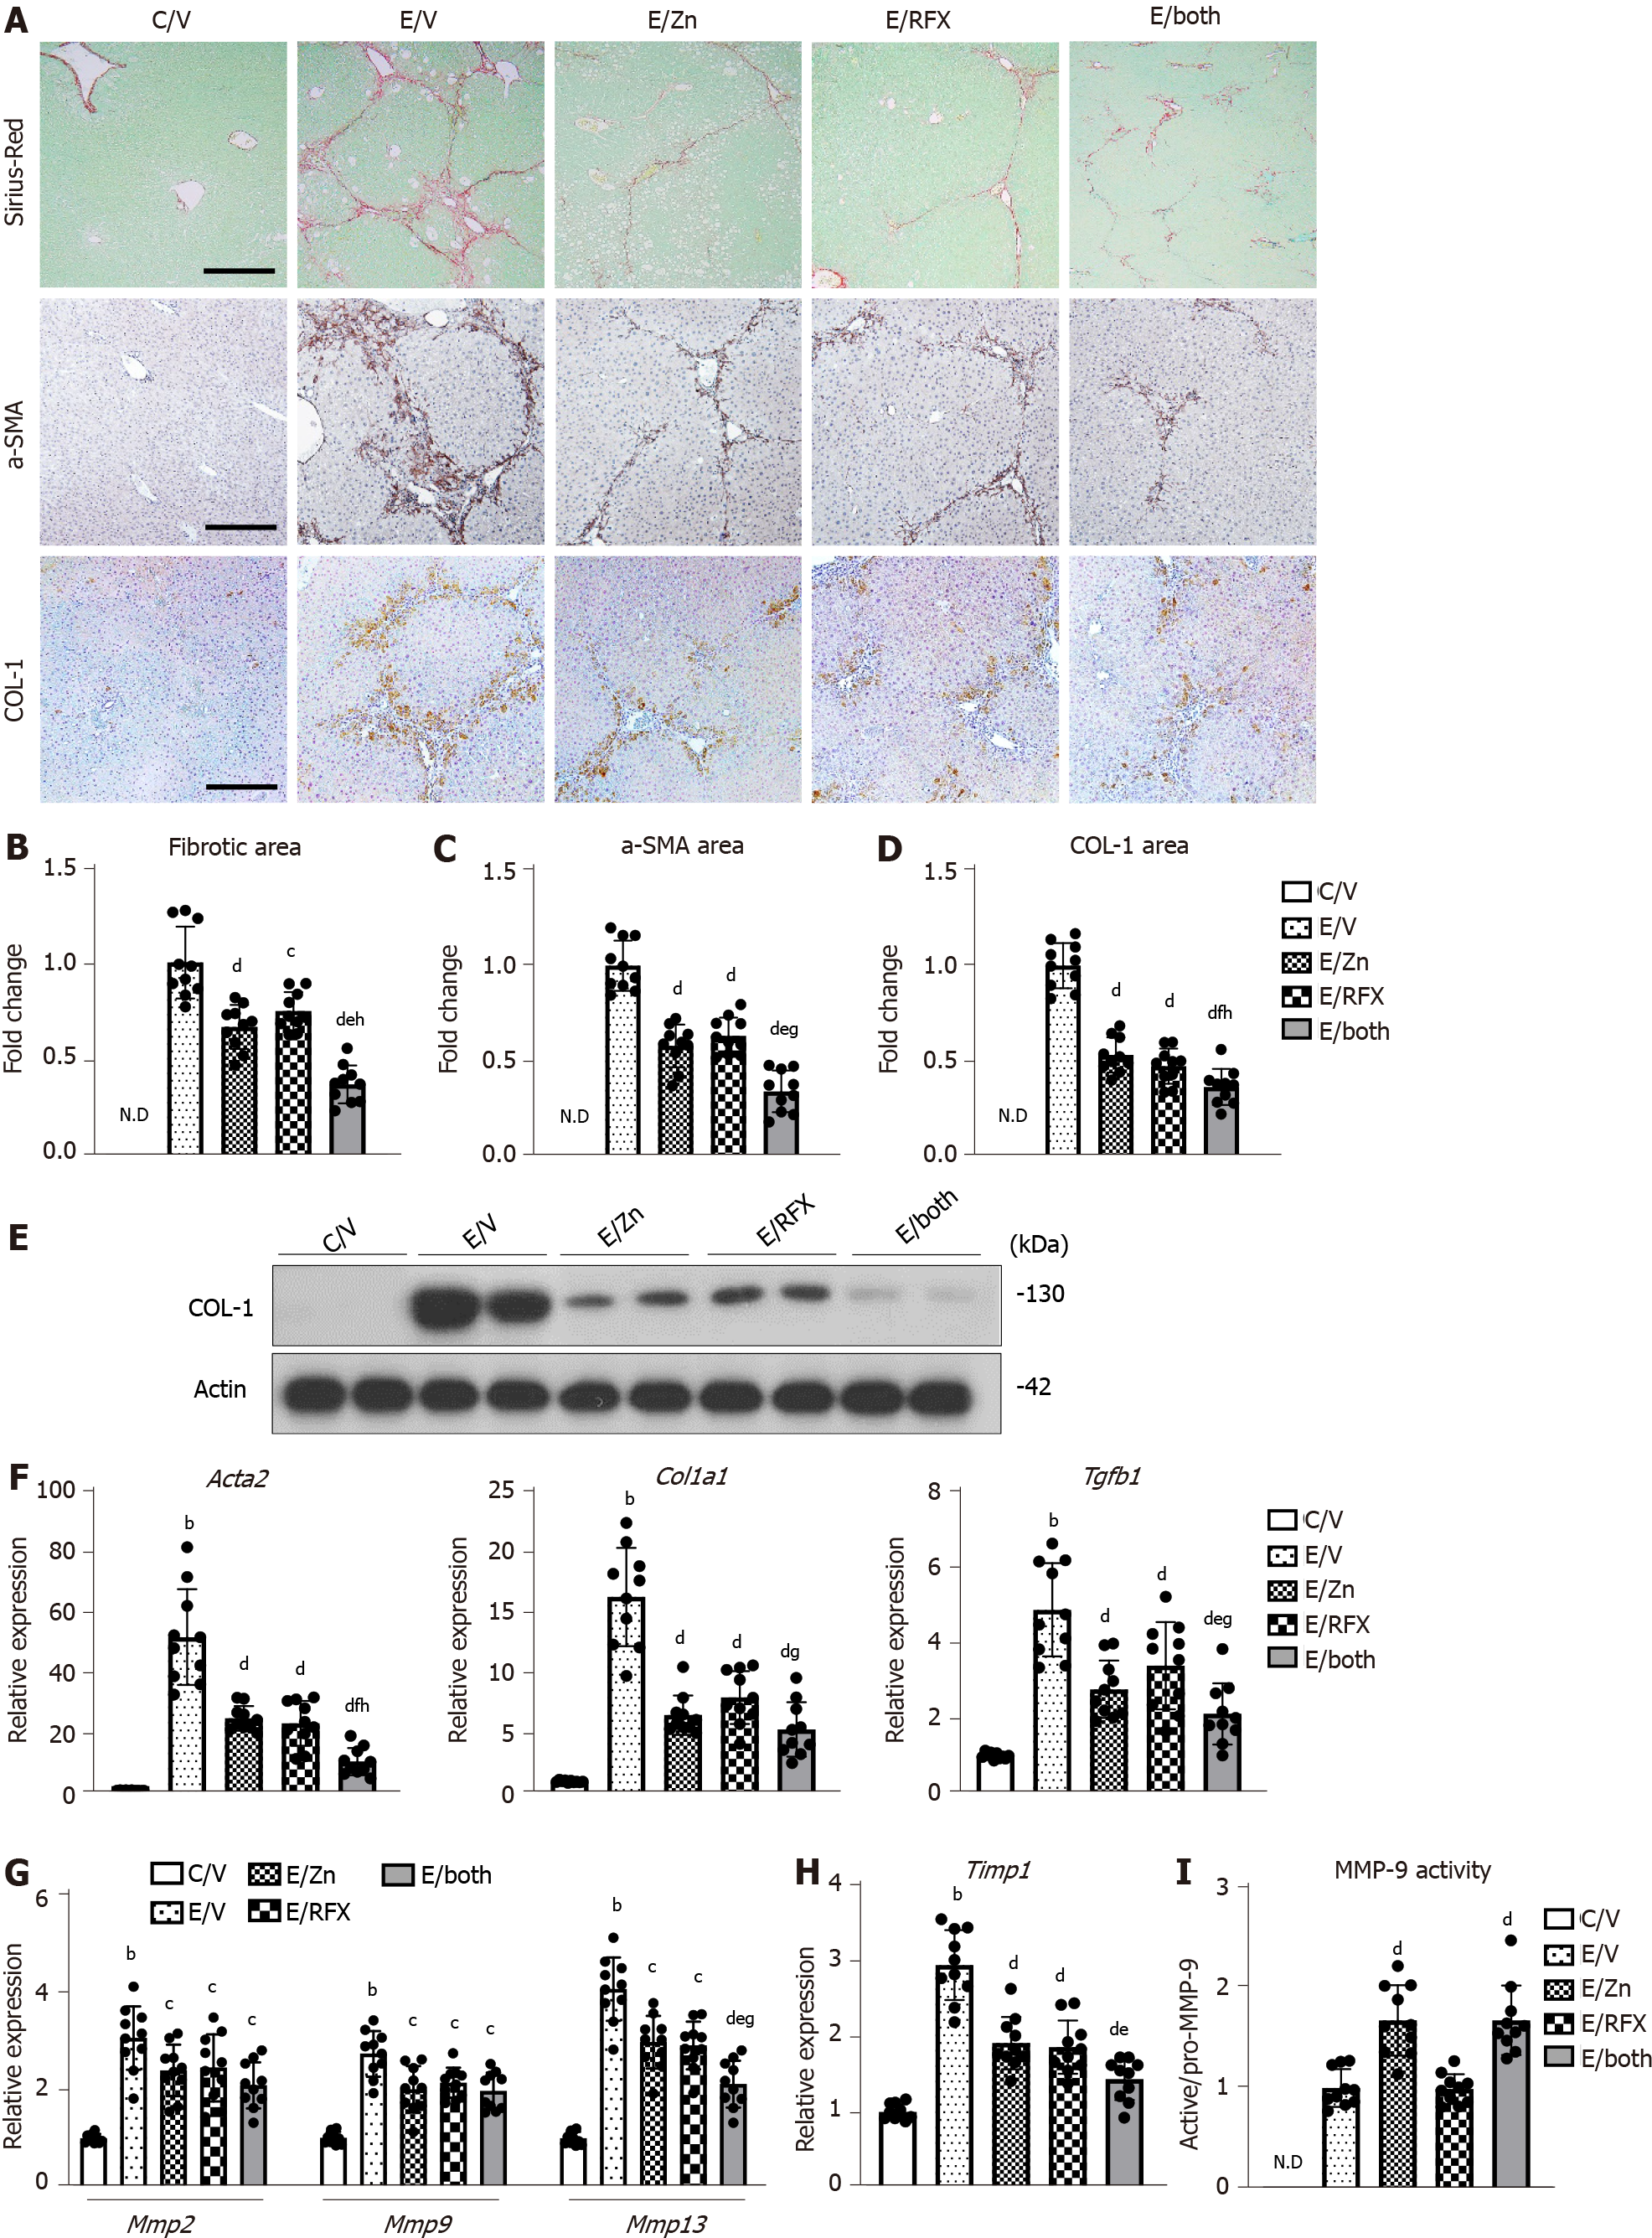
Figure 4 Zinc acetate and rifaximin against liver fibrosis development in alcoholic liver disease mice.
A: Representative microphotographs of liver sections stained with Sirius-Red, α-smooth muscle actin (αSMA) and COL-1. Scale bar: 50 μm; B-D: Semi-quantitation of Sirius-Red-stained fibrotic area (B), α-SMA (C) and COL-1 (D) immuno-positive areas in high-power field (HPF) by NIH imageJ software. Histochemical quantitative analyses included five fields per section; E: Western blots for COL-1 in the liver of experimental mice. Actin was used as internal control; F-H: Relative mRNA expression levels of Acta2, Col1a1 and Tgfb1 (F), Mmp-2, -9 and -13 (G), and Timp1 (H) in the liver of experimental mice. The mRNA expression levels were measured by RT-qPCR, and Gapdh was used as internal control; I: Intrahepatic MMP-9 activity determined by ELISA. Quantitative values are indicated as fold changes to the values of E/V (B-D and I) or C/V group (F-H). Data are mean ± SD (n = 10), aP < 0.05 and bP < 0.01 vs C/V group; cP < 0.05 and dP < 0.01 vs E/V group; eP < 0.05 and fP < 0.01 vs E/Zn group; g P < 0.05 and h P < 0.01 vs E/RFX group. ND: Not detected; αSMA: α-smooth muscle actin.
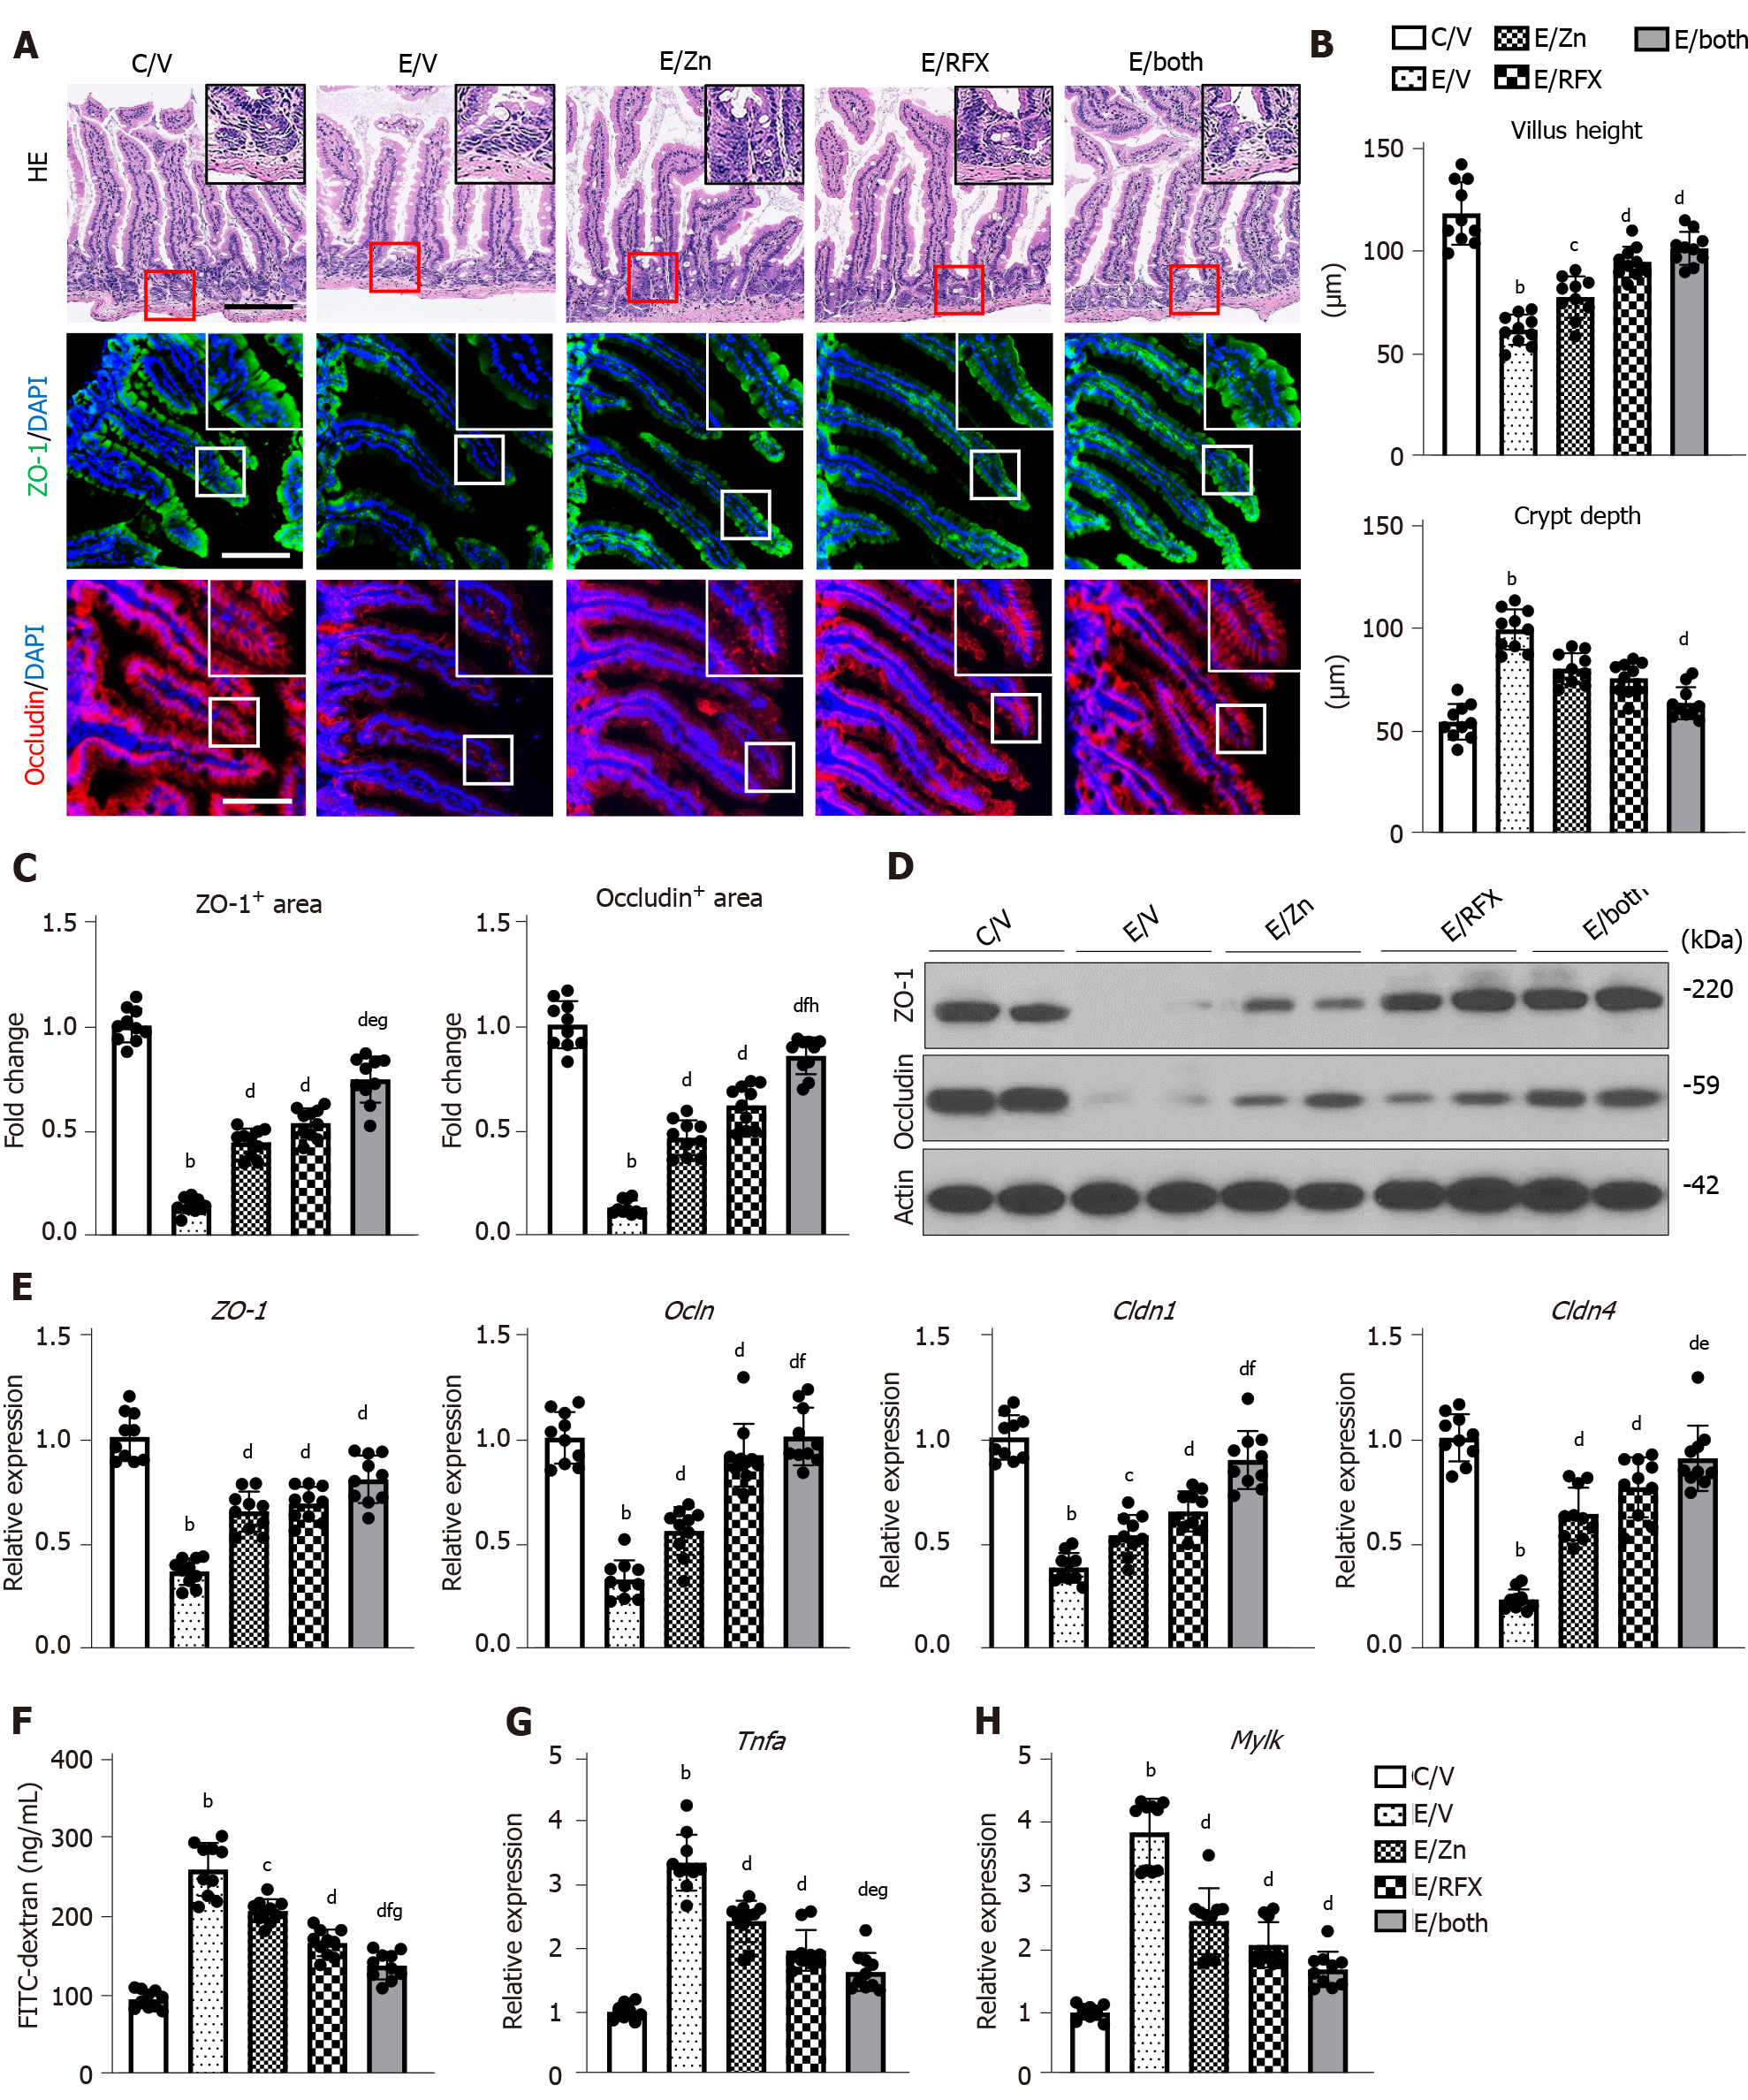
Figure 5 Zinc acetate and rifaximin on intestinal barrier function in alcoholic liver disease mice.
A: Representative microphotographs of ileum sections stained with hematoxylin-eosin (upper), zonula occludens-1 (ZO-1) (middle) and Occludin (lower) in the experimental groups. Boxes are selected regions for magnified. Nuclei counterstained with 4',6-diamidino-2-phenylindole. Scale Bar: 50 µm; B: Villus height (upper) and crypt depth (lower) of the ileum in the experimental mice; C: Semi-quantitation of ZO-1 and Occludin immuno-positive areas in high-power field by NIH imageJ software; D: Western blots for ZO-1 and Occludin in the liver of experimental mice. Actin was used as internal control; E: Relative mRNA expression levels of Zo1, Ocln, Cldn1 and Cldn4 in the ileum of experimental mice; F: Blood levels of fluorescein isothiocyanate (FITC)-dextran (4kDa) 4 h after oral administration; G and H): Relative mRNA expression levels of Tnfa (G) and Mylk (H) in the ileum of experimental mice. Histochemical quantitative analyses included five fields per section (B and C). The mRNA expression levels were measured by RT-qPCR, and Gapdh was used as internal control (E, G and H). Quantitative values are indicated as fold changes to the values of C/V group (C, E, G and H). Data are mean ± SD (B, C, E, G and H; n = 10, F; n = 5), aP < 0.05 and bP < 0.01 vs C/V group; cP < 0.05 and dP < 0.01 vs E/V group; eP < 0.05 and fP < 0.01 vs E/Zn group; gP < 0.05 and hP < 0.01 vs E/RFX group. DAPI: 4',6-diamidino-2-phenylindole; ZO-1: Zonula occludens; HE: Hematoxylin and eosin.
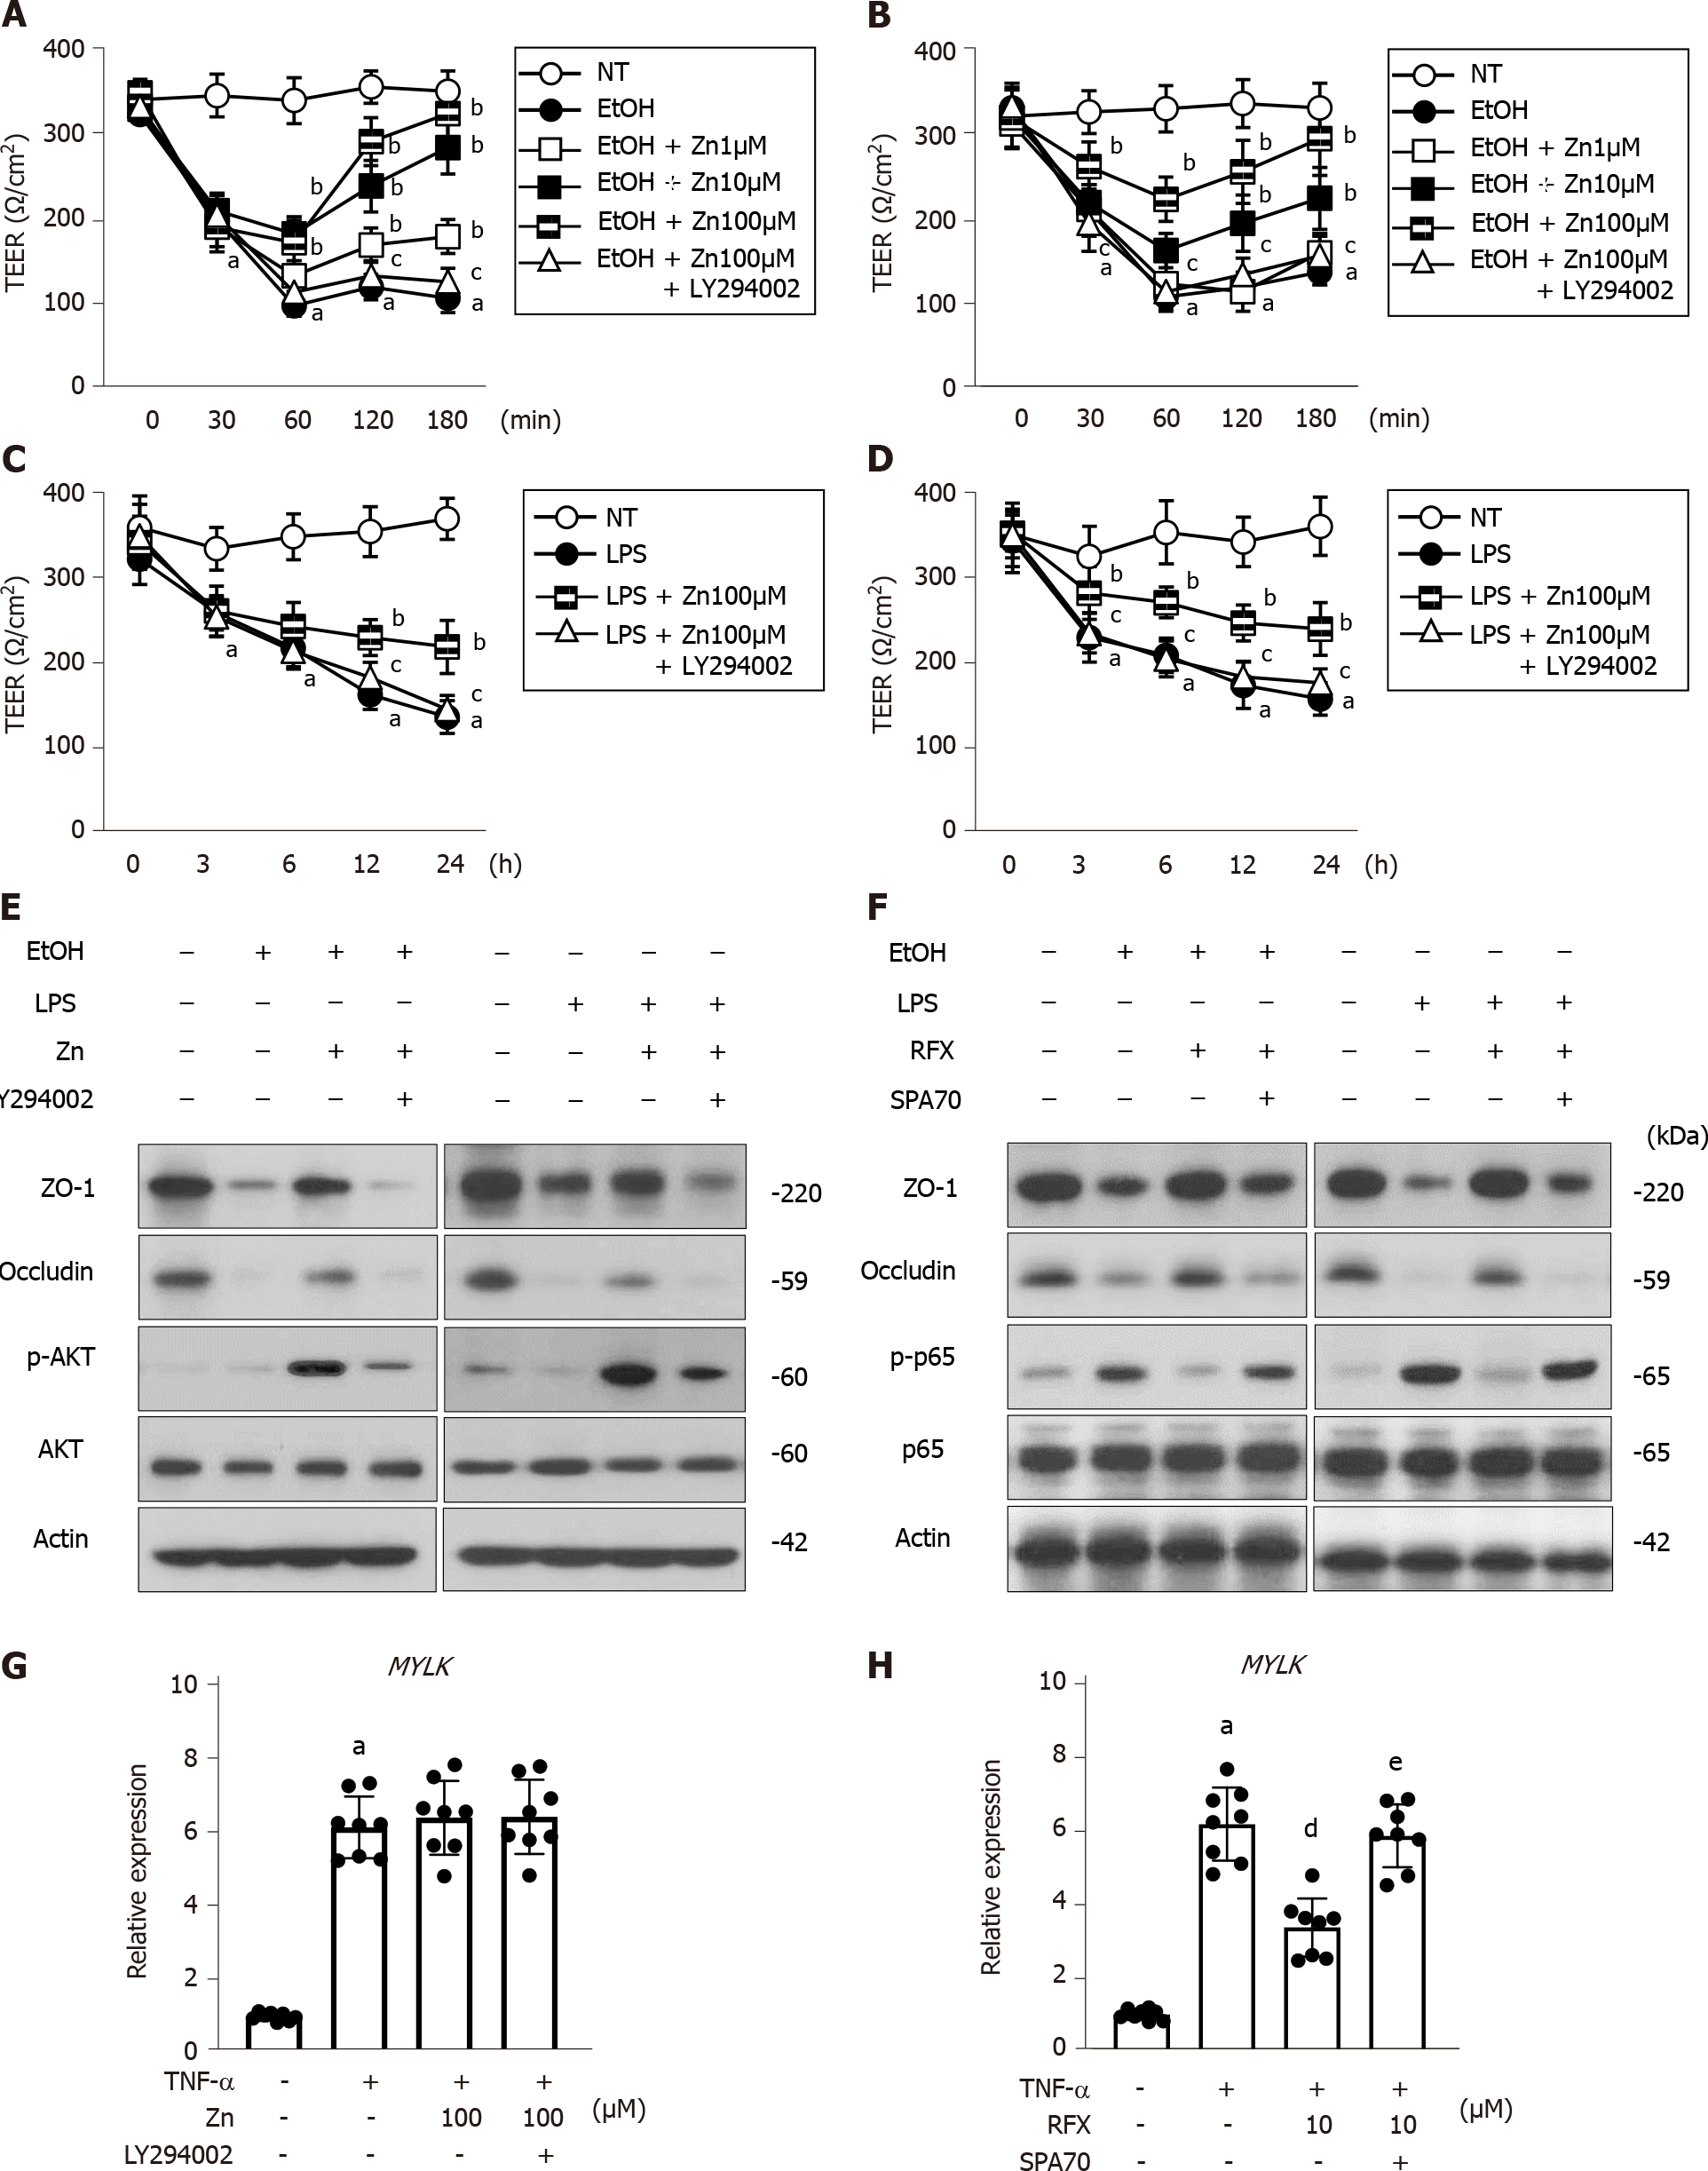
Figure 6 Effects of zinc acetate and rifaximin on in vitro EtOH/LPS/TNF-α-stimulated Caco-2 cells.
A-D: In vitro paracellular permeability in ethanol (EtOH) (A and B)- or lipopolysaccharide (LPS) (C and D)-stimulated Caco-2 cells determined as transepithelial electrical resistance; E and F: Western blots for the effects of zinc acetate (100 μM) on ZO-1, Occludin, p-AKT and AKT expressions (E) and rifaximin (10 μM) on ZO-1, Occludin, p-p65 and p65 expressions (F) in the whole cell lysate of Caco-2 cells. Actin was used as internal control; G and H: Relative mRNA expression levels of MYLK in TNF-α-stimulated Caco-2 cells. The mRNA expression levels were measured by RT-qPCR, and GAPDH was used as internal control. Quantitative values are indicated as fold changes to the values of non-treatment group. Caco-2 were treated with each agent as following; (A, C, E and G) zinc acetate (Zn) and/or PI3K inhibitor, LY294002, (B, D, F and H) rifaximin (RFX) and/or human PXR inhibitor, SPA70. Data are mean ± SD (A-D; n = 6, G and H; n = 8), aP < 0.01 vs non-treated groups (A-D, G and H), bP < 0.01 vs EtOH (A and B) or LPS-treated groups (C and D), cP < 0.01 vs EtOH with Zn (100 μM) (A), EtOH with RFX (10 μM) (B), LPS with Zn (100 μM) (C) or LPS with RFX (10 μM) (D)-treated groups, dP < 0.01 vs TNF-α-treated group (H), eP < 0.01 vs TNF-α with RFX (10 μM)-treated group (H). LPS: Lipopolysaccharide; TEER: Transepithelial electrical resistance; EtOH: Ethanol; ZO-1: Zonula occludens.
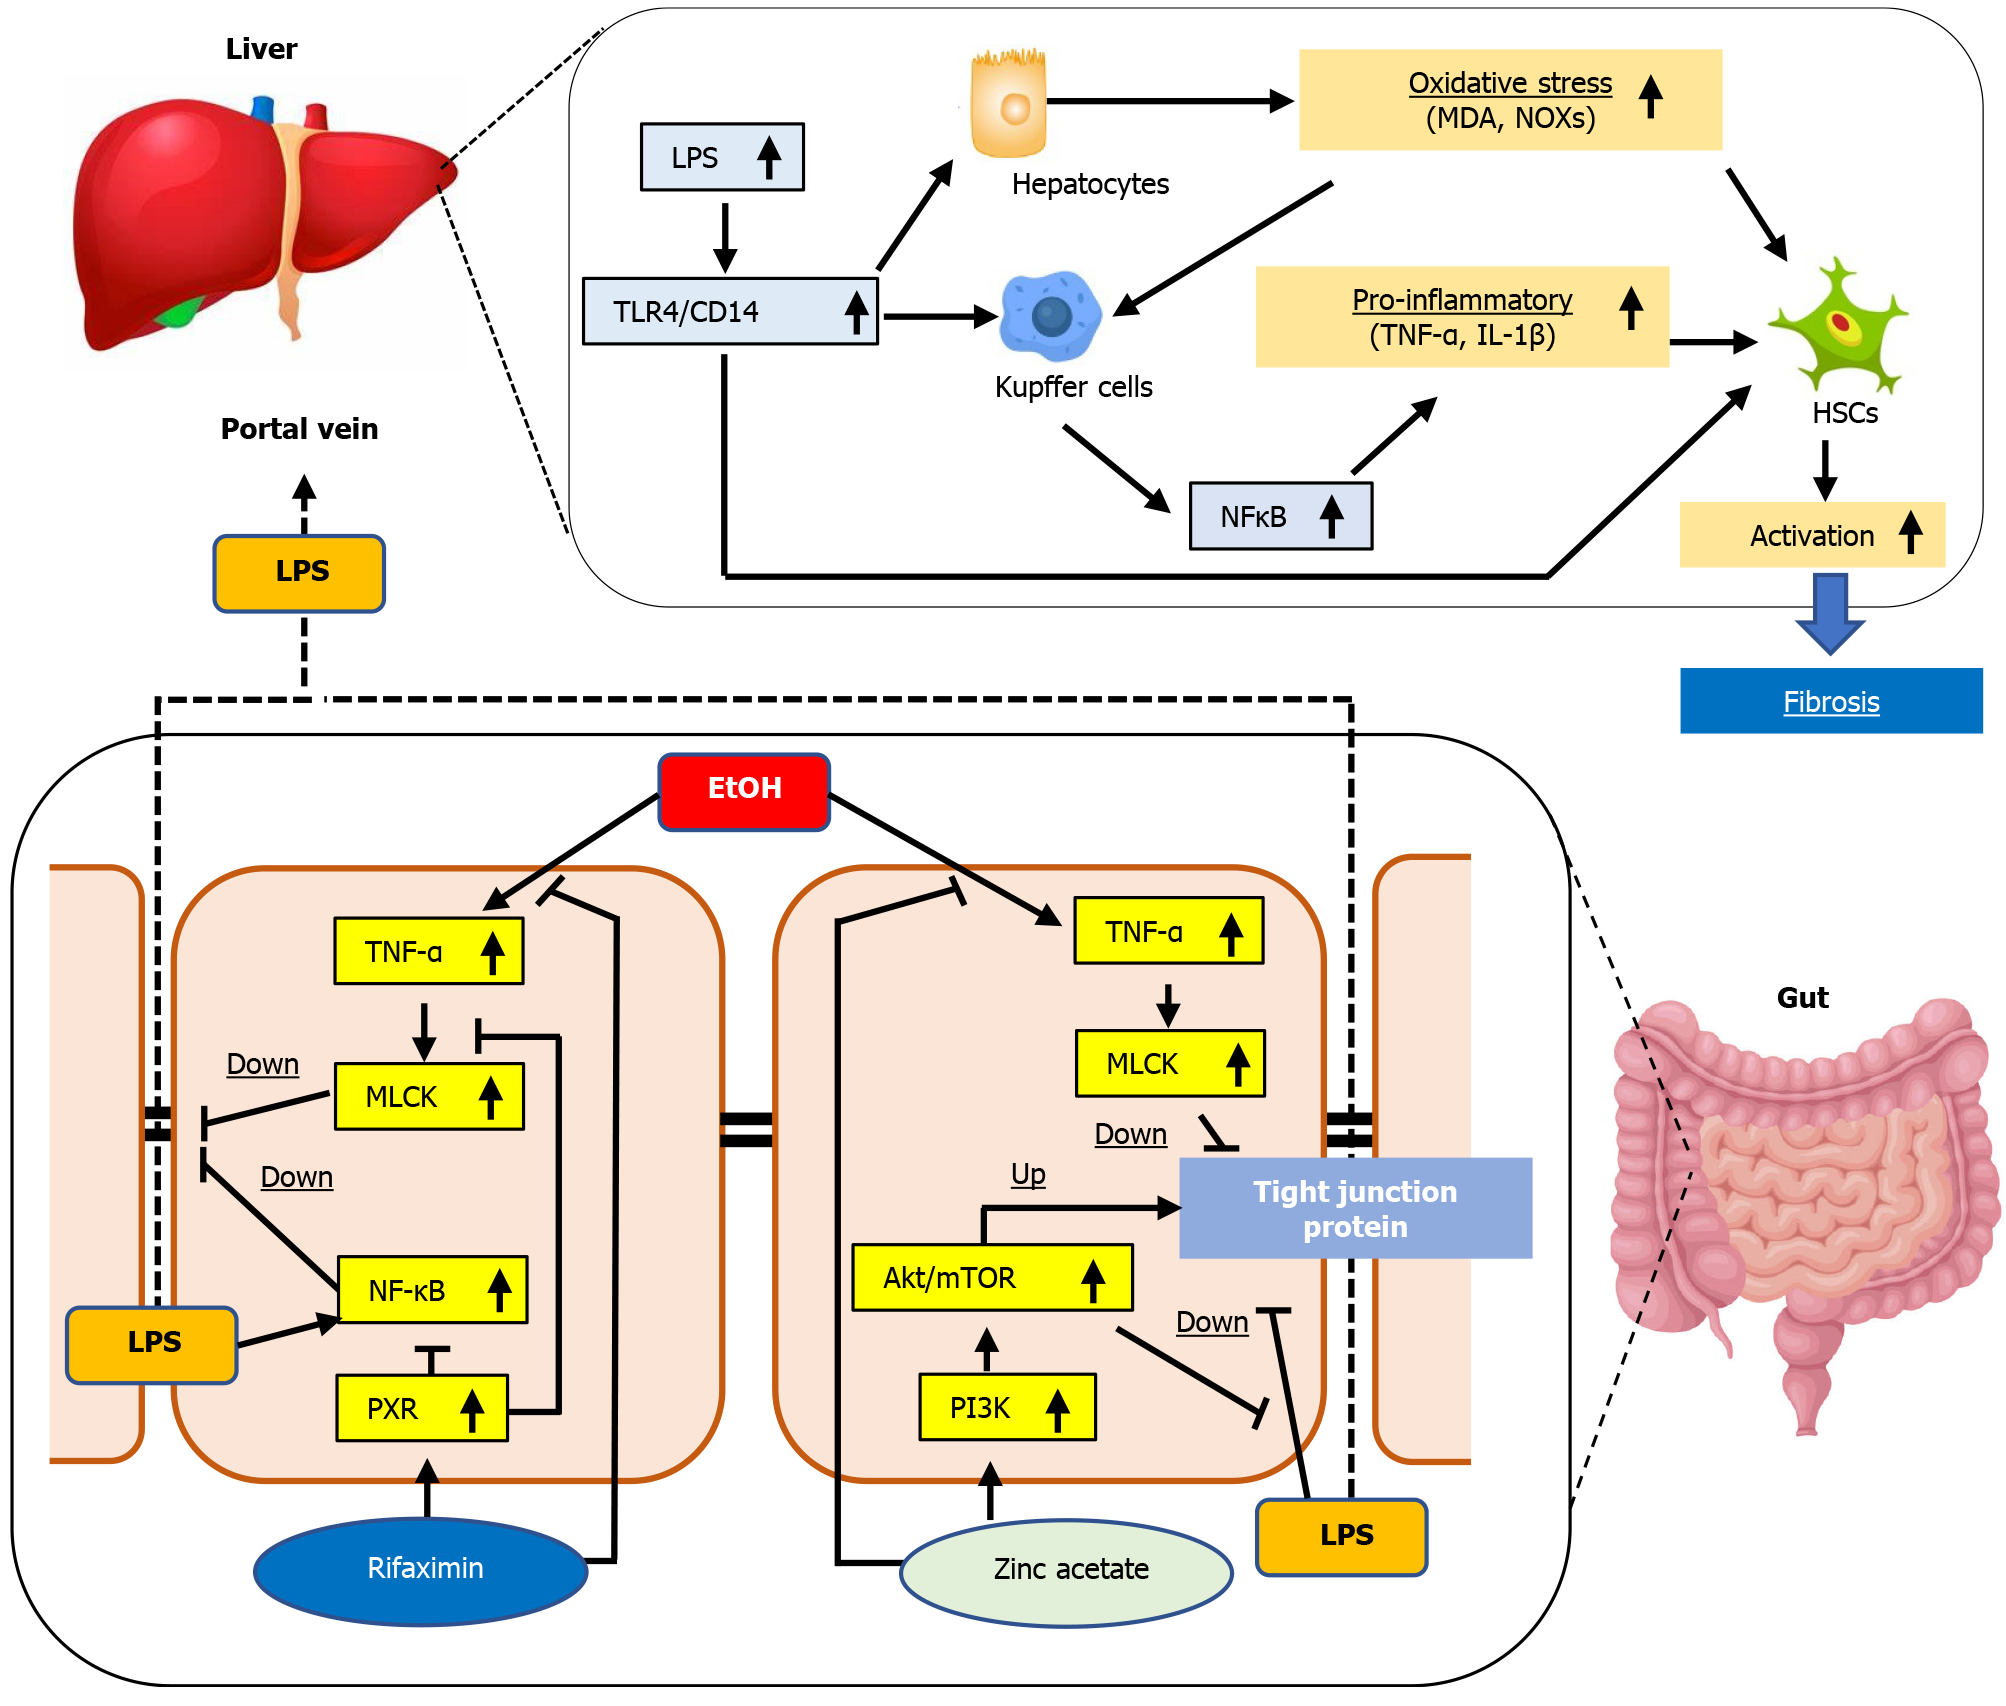
Figure 7 Graphic summary of the effect of zinc acetate and rifaximin on the alcoholic liver disease-related liver fibrosis.
ALD: Alcoholic liver disease; TLR4: Toll-like receptor 4; MDA: Malondialdehyde; LPS: Lipopolysaccharide; HSC: Hepatic stellate cell; TNFα: Tumor necrosis factor α; MLCK: Myosin light chain kinase; NF-kB: Nuclear factor kB; PXR: Pregnane X receptor.
- Citation: Fujimoto Y, Kaji K, Nishimura N, Enomoto M, Murata K, Takeda S, Takaya H, Kawaratani H, Moriya K, Namisaki T, Akahane T, Yoshiji H. Dual therapy with zinc acetate and rifaximin prevents from ethanol-induced liver fibrosis by maintaining intestinal barrier integrity. World J Gastroenterol 2021; 27(48): 8323-8342
- URL: https://www.wjgnet.com/1007-9327/full/v27/i48/8323.htm
- DOI: https://dx.doi.org/10.3748/wjg.v27.i48.8323


