Copyright
©The Author(s) 2021.
World J Gastroenterol. Nov 21, 2021; 27(43): 7509-7529
Published online Nov 21, 2021. doi: 10.3748/wjg.v27.i43.7509
Published online Nov 21, 2021. doi: 10.3748/wjg.v27.i43.7509
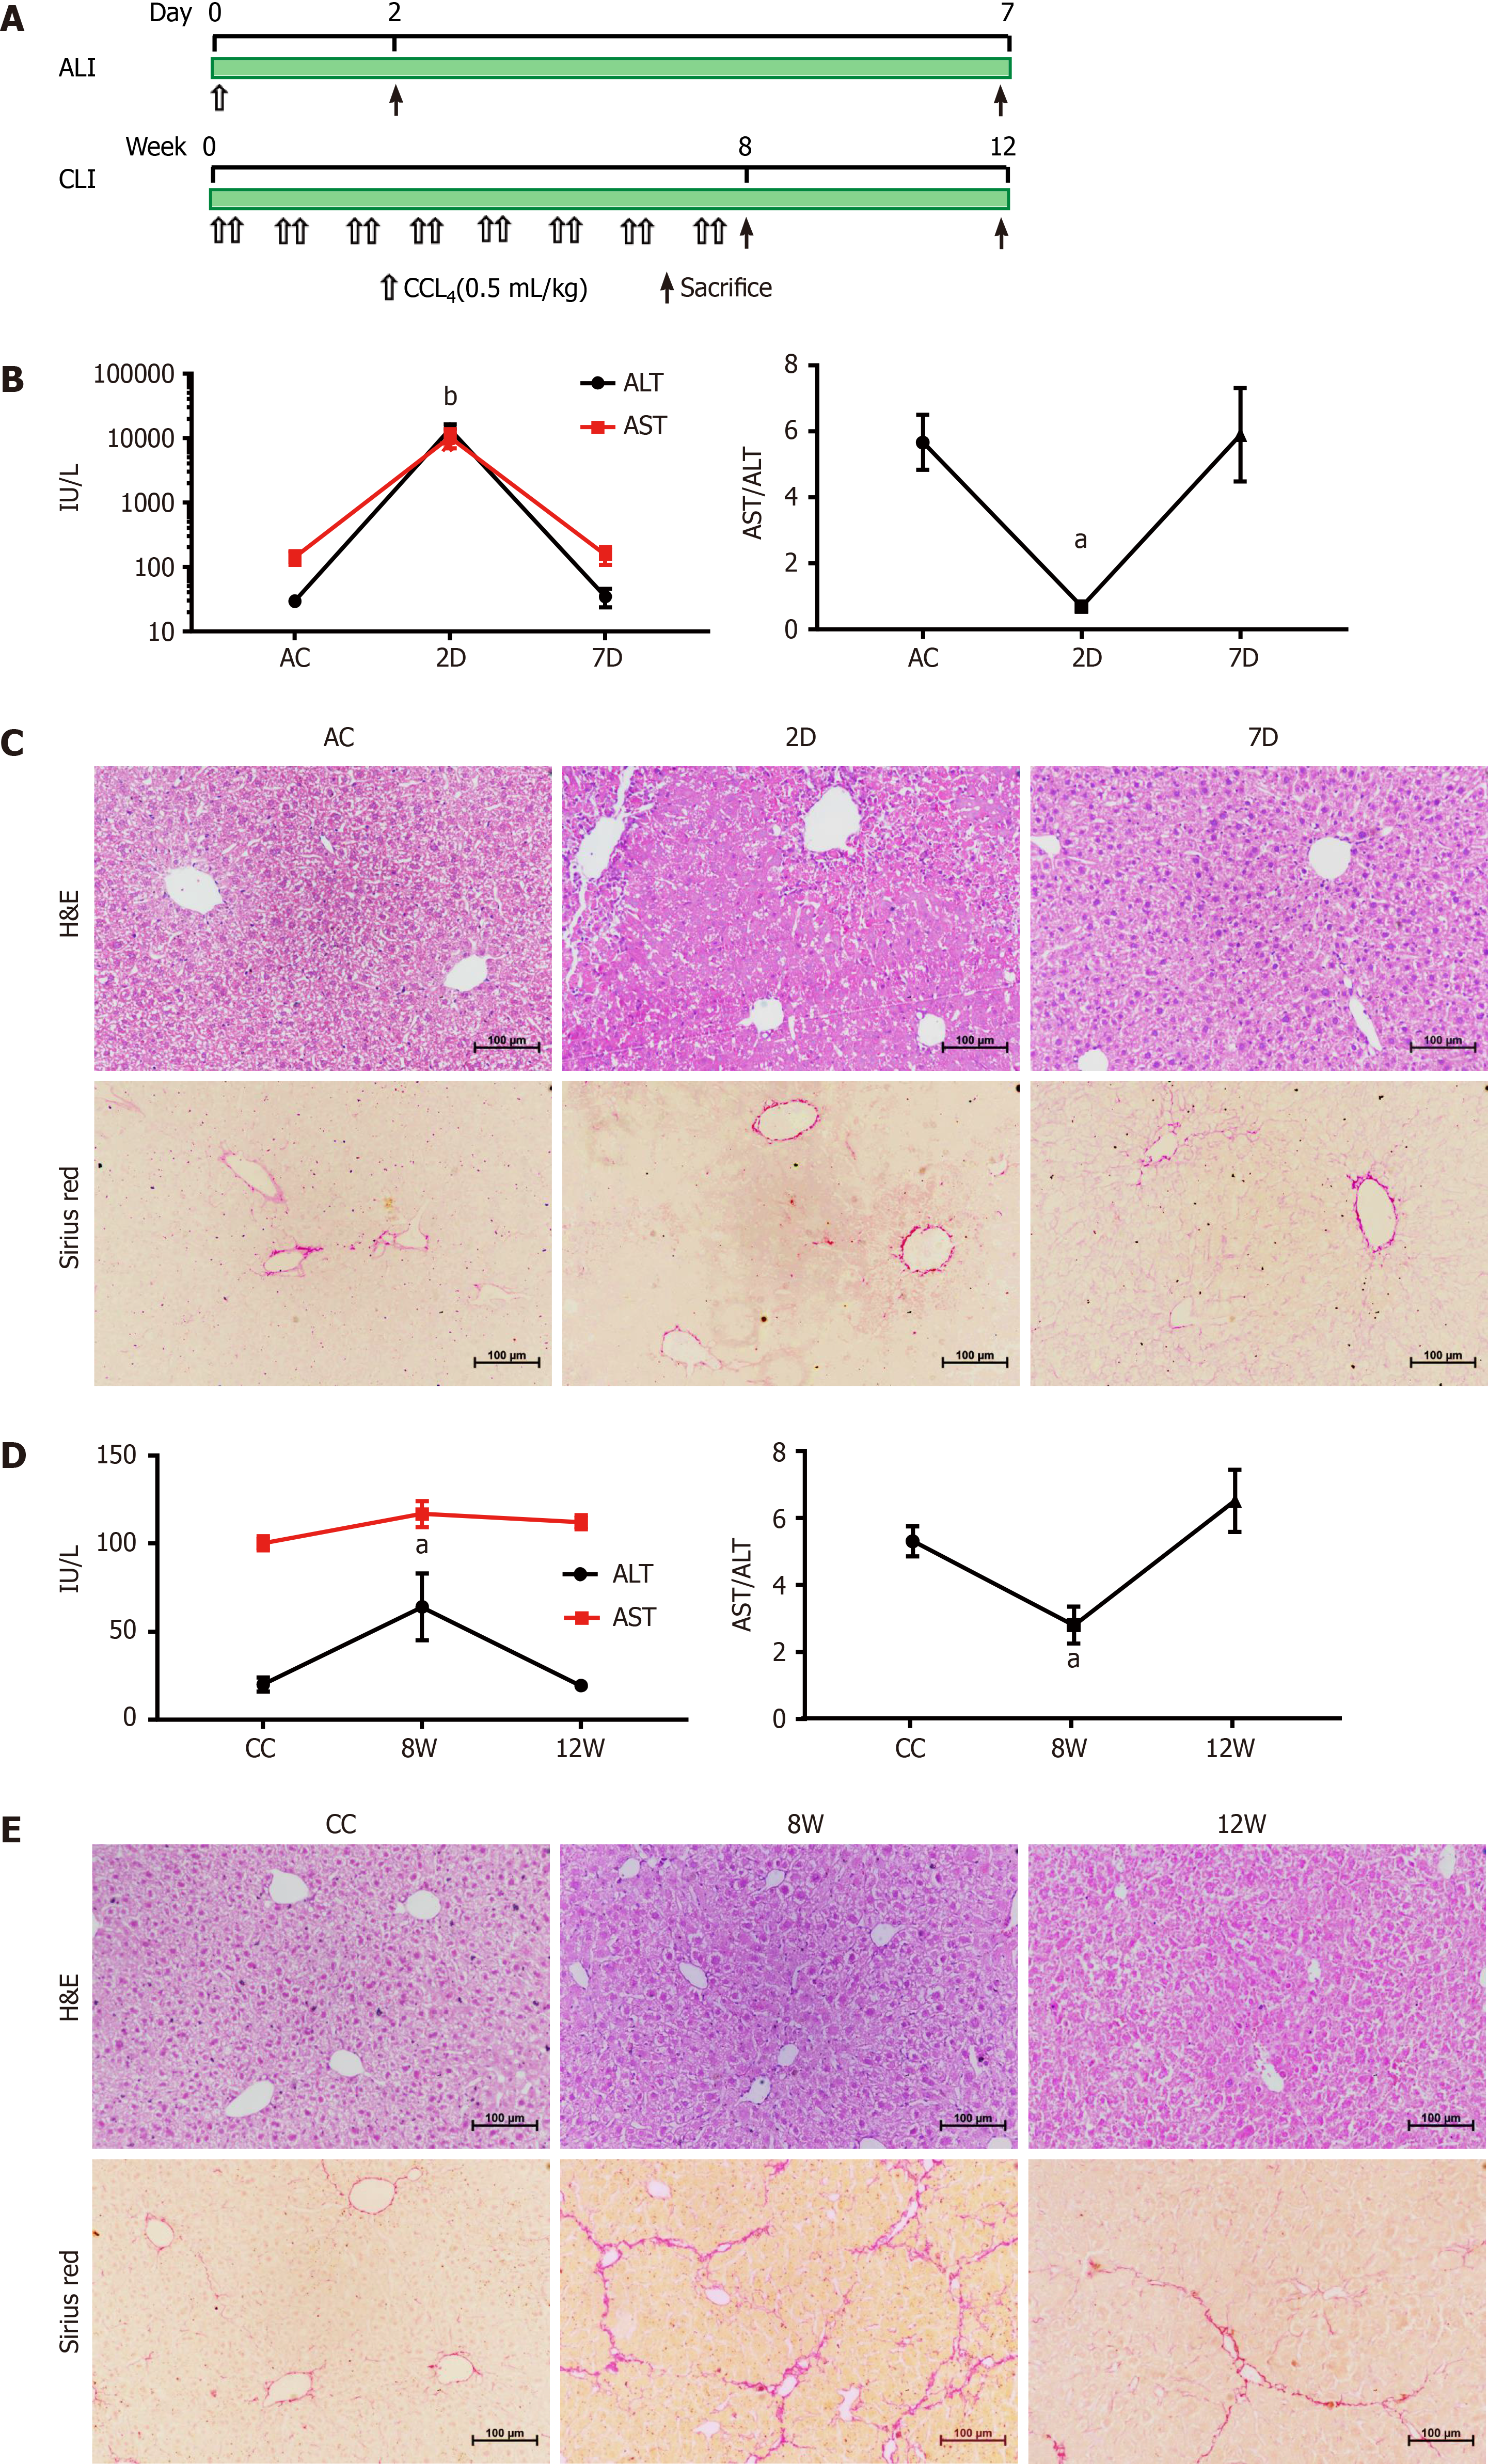
Figure 1 Establishment and validation of CCL4-induced acute liver injury and chronic liver injury in mice.
A: Workflow for the establishment of the acute liver injury (ALI) and chronic liver injury (CLI) mouse models; B: Serum alanine aminotransferase (ALT) and aspartate aminotransferase (AST) levels in ALI mice. Compared with the ALI control (AC) group, aP < 0.05, bP < 0.01; C: Hematoxylin-eosin (H&E) and Sirius Red staining of liver sections from AC, 2 d and 7 d mice; D: Serum ALT and AST levels in CLI mice. Compared with the CC group, aP < 0.05; E: H&E and Sirius Red staining of liver sections from CLI control (CC), 8 wk and 12 wk mice. Scale bar = 100 μm. D: Day; W: Week.
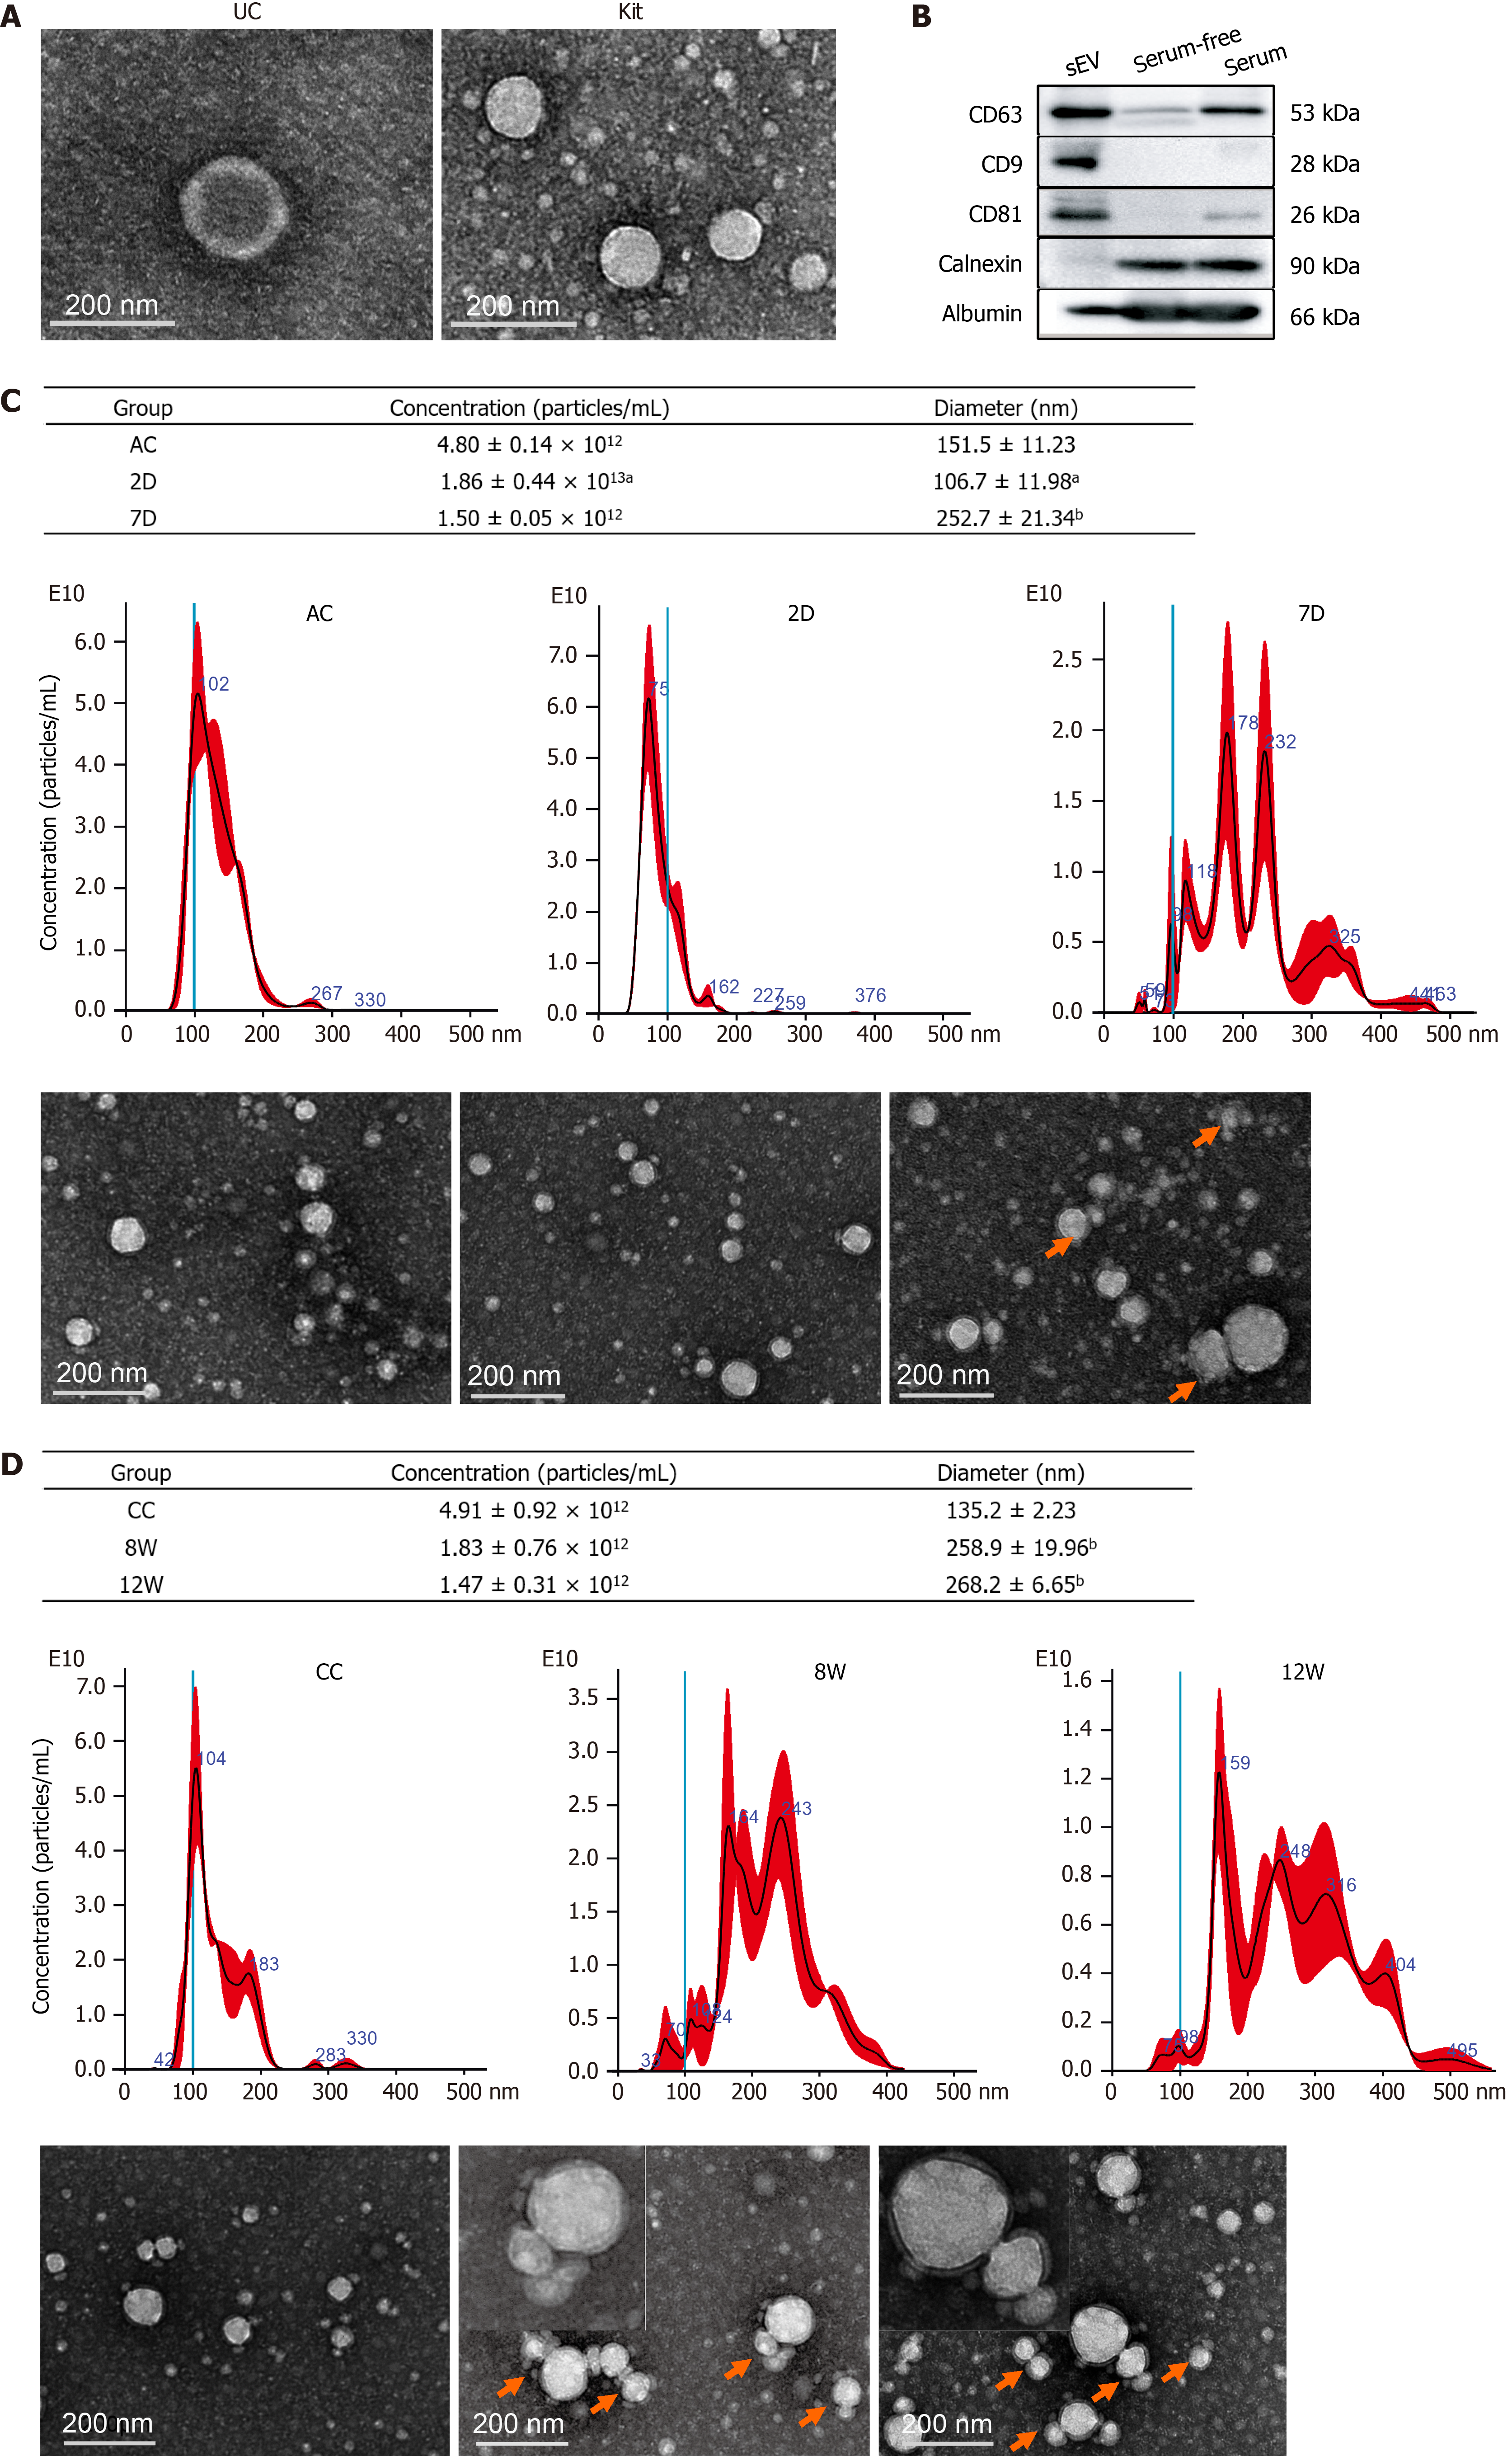
Figure 2 Characterization of isolated mouse serum small extracellular vesicles.
A: Transmission electron microscopy (TEM) images of the particles isolated using ultracentrifugation and an ExoQuick precipitation kit; B: Representative Western blotting bands for CD63, CD81, CD9, calnexin and albumin; C: Nanoparticle tracking analysis (NTA) plots for the size distribution and concentration of the isolated particles in each group from ALI mice and the corresponding TEM images. Compared with the ALI control group, aP < 0.05, bP < 0.01; D: NTA plots for the size distribution and concentration of the isolated particles in each group from CLI mice and the corresponding TEM images. Compared with the CLI control group, bP < 0.01. The red arrow indicates aggregated particles; representative particles were amplified and were exemplified in the top left corner. Scale bar = 200 nm. UC: Ultracentrifuge; D: Day; W: Week; AC: Acute liver injury control; CC: Chronic liver injury control; sEVs: Small extracellular vesicles.
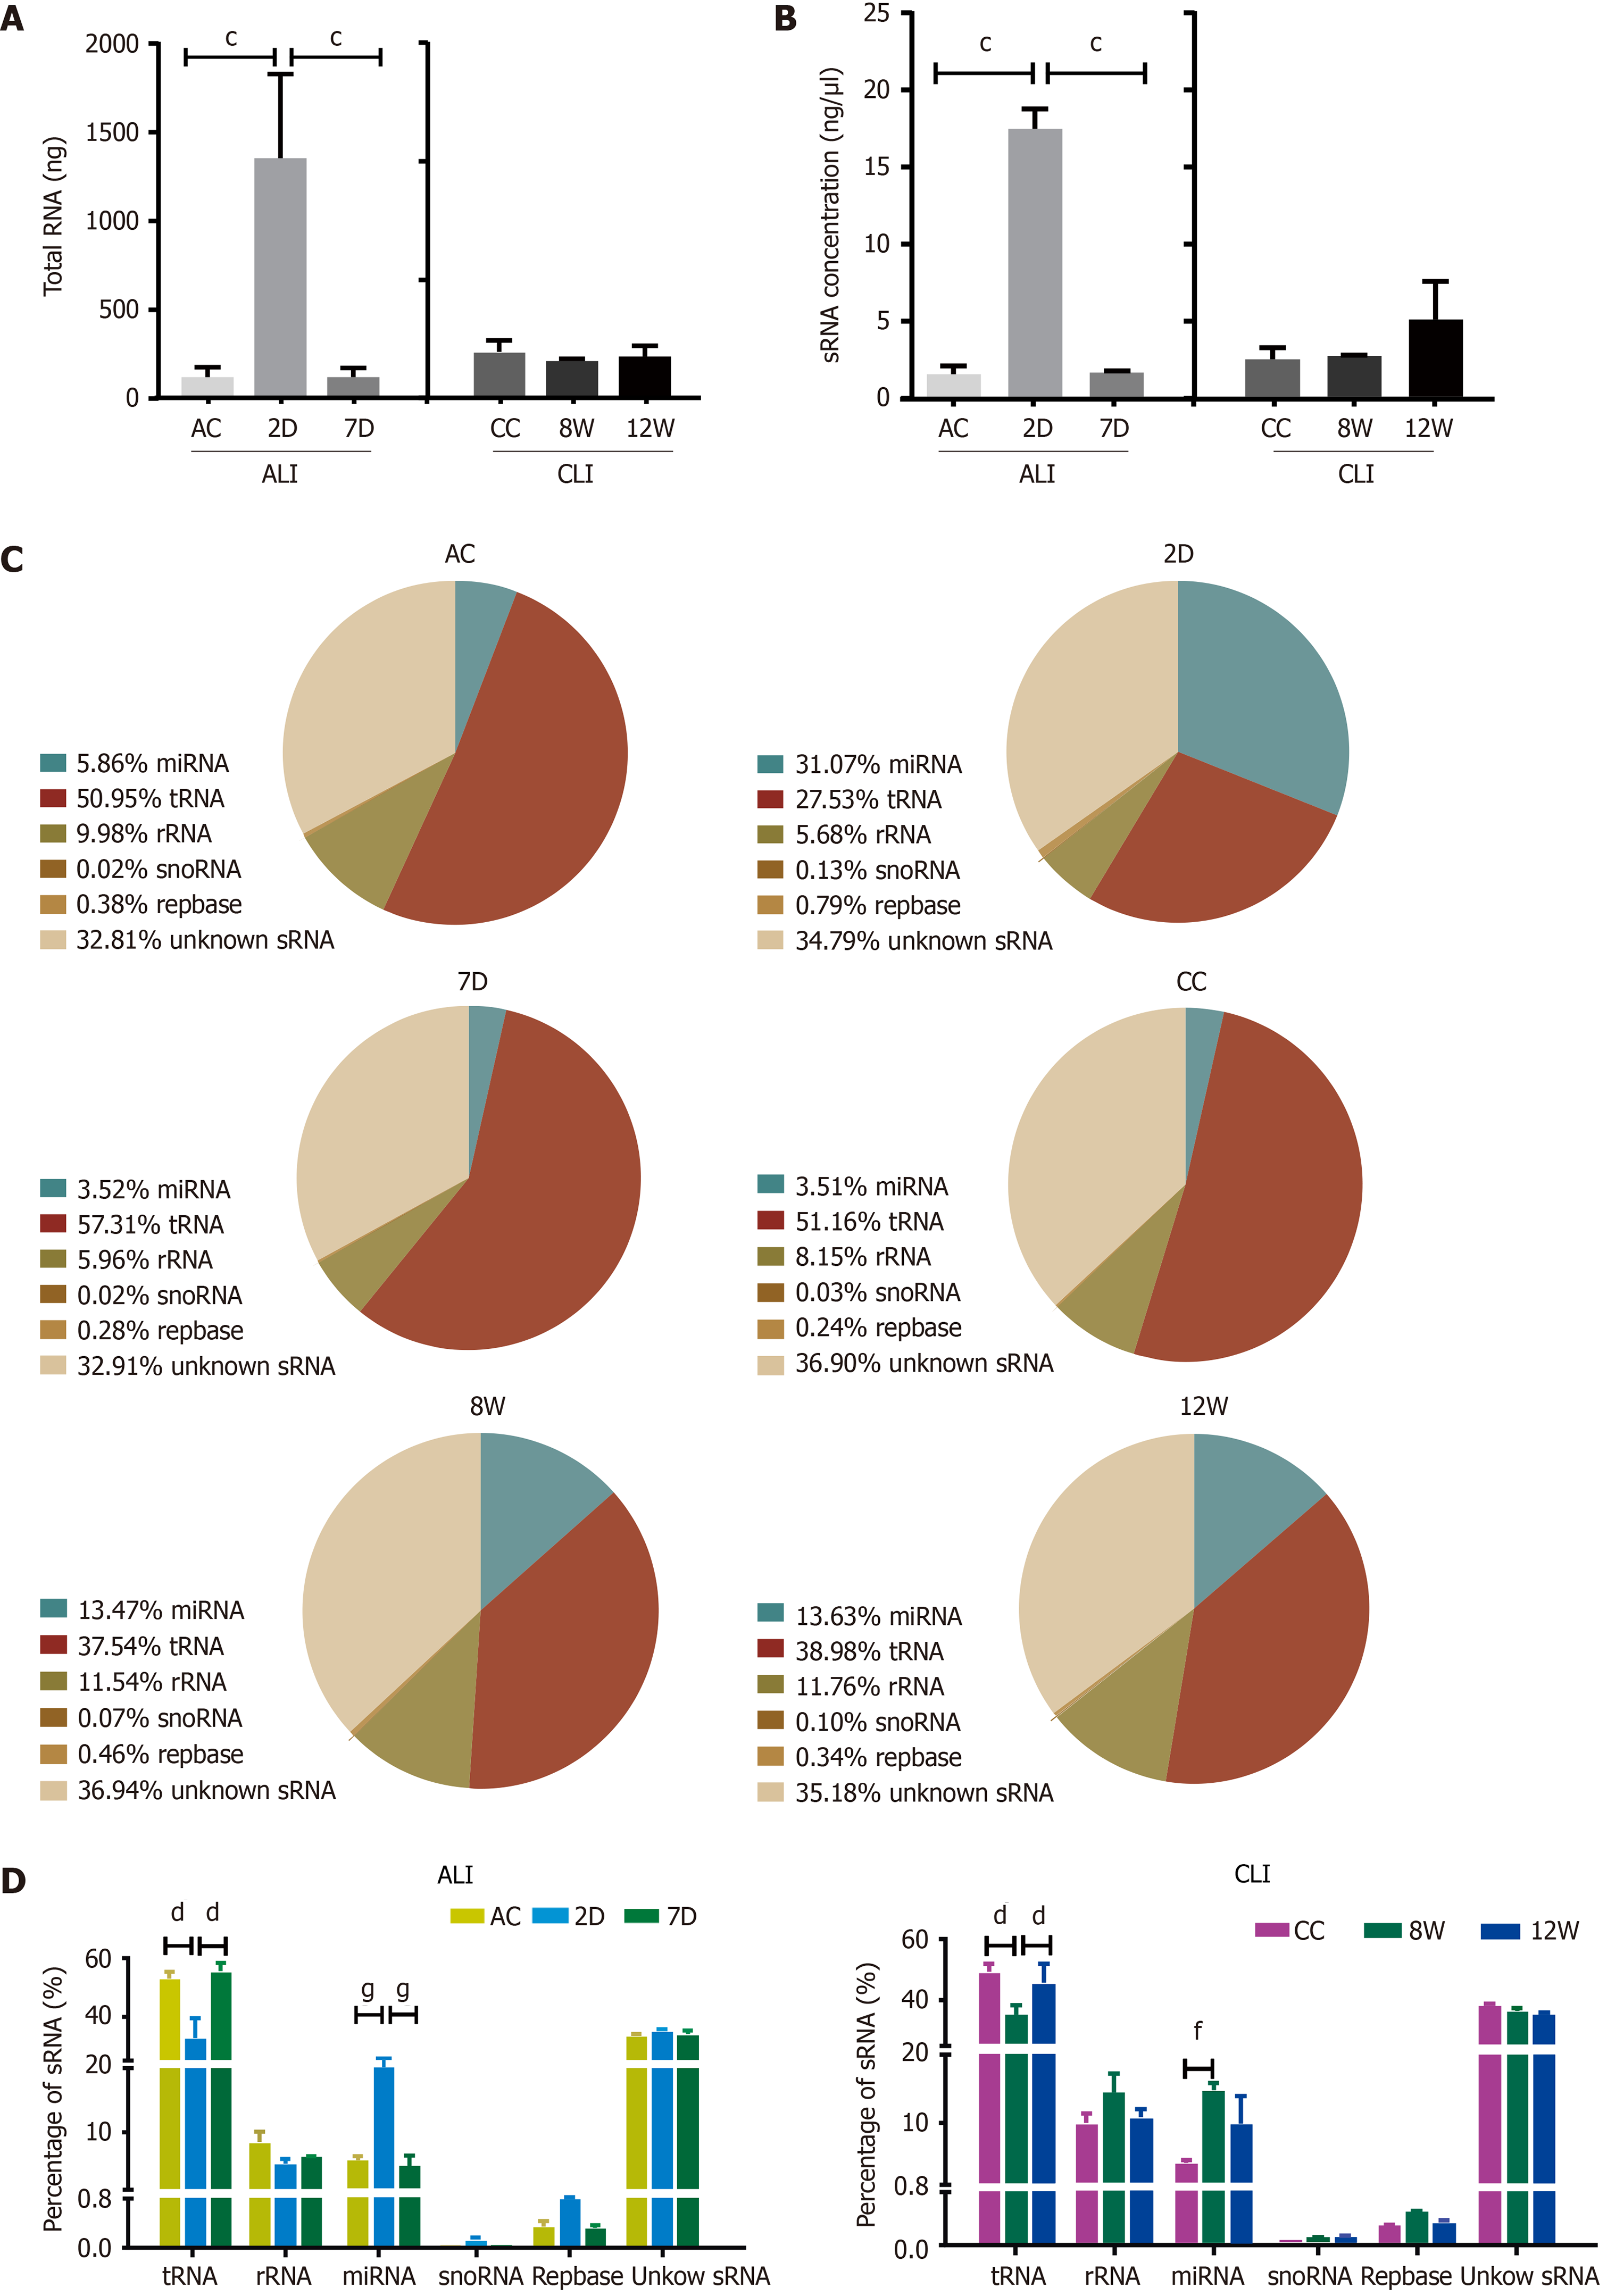
Figure 3 Annotations of small RNA in serum small extracellular vesicles from acute liver injury and chronic liver injury mice.
A: Total RNA in serum small extracellular vesicles (sEVs) compared with the 2D group, cP < 0.001; B: Small RNA (sRNA) concentrations in serum sEVs compared with the 2 d group, cP < 0.001; C: Representative pie charts depicting the annotated sRNA species and their proportions in the different groups; D: Statistical analysis of sRNA species in sEVs. Compared with the 2 d group, dP < 0.0001; compared with the 8 wk group, fP < 0.01, gP < 0.0001. D: Day; W: Week; AC: Acute liver injury control; CC: Chronic liver injury control; ALI: Acute liver injury; CLI: Chronic liver injury; miRNA: MicroRNA; snoRNA: Small nucleolar RNA.
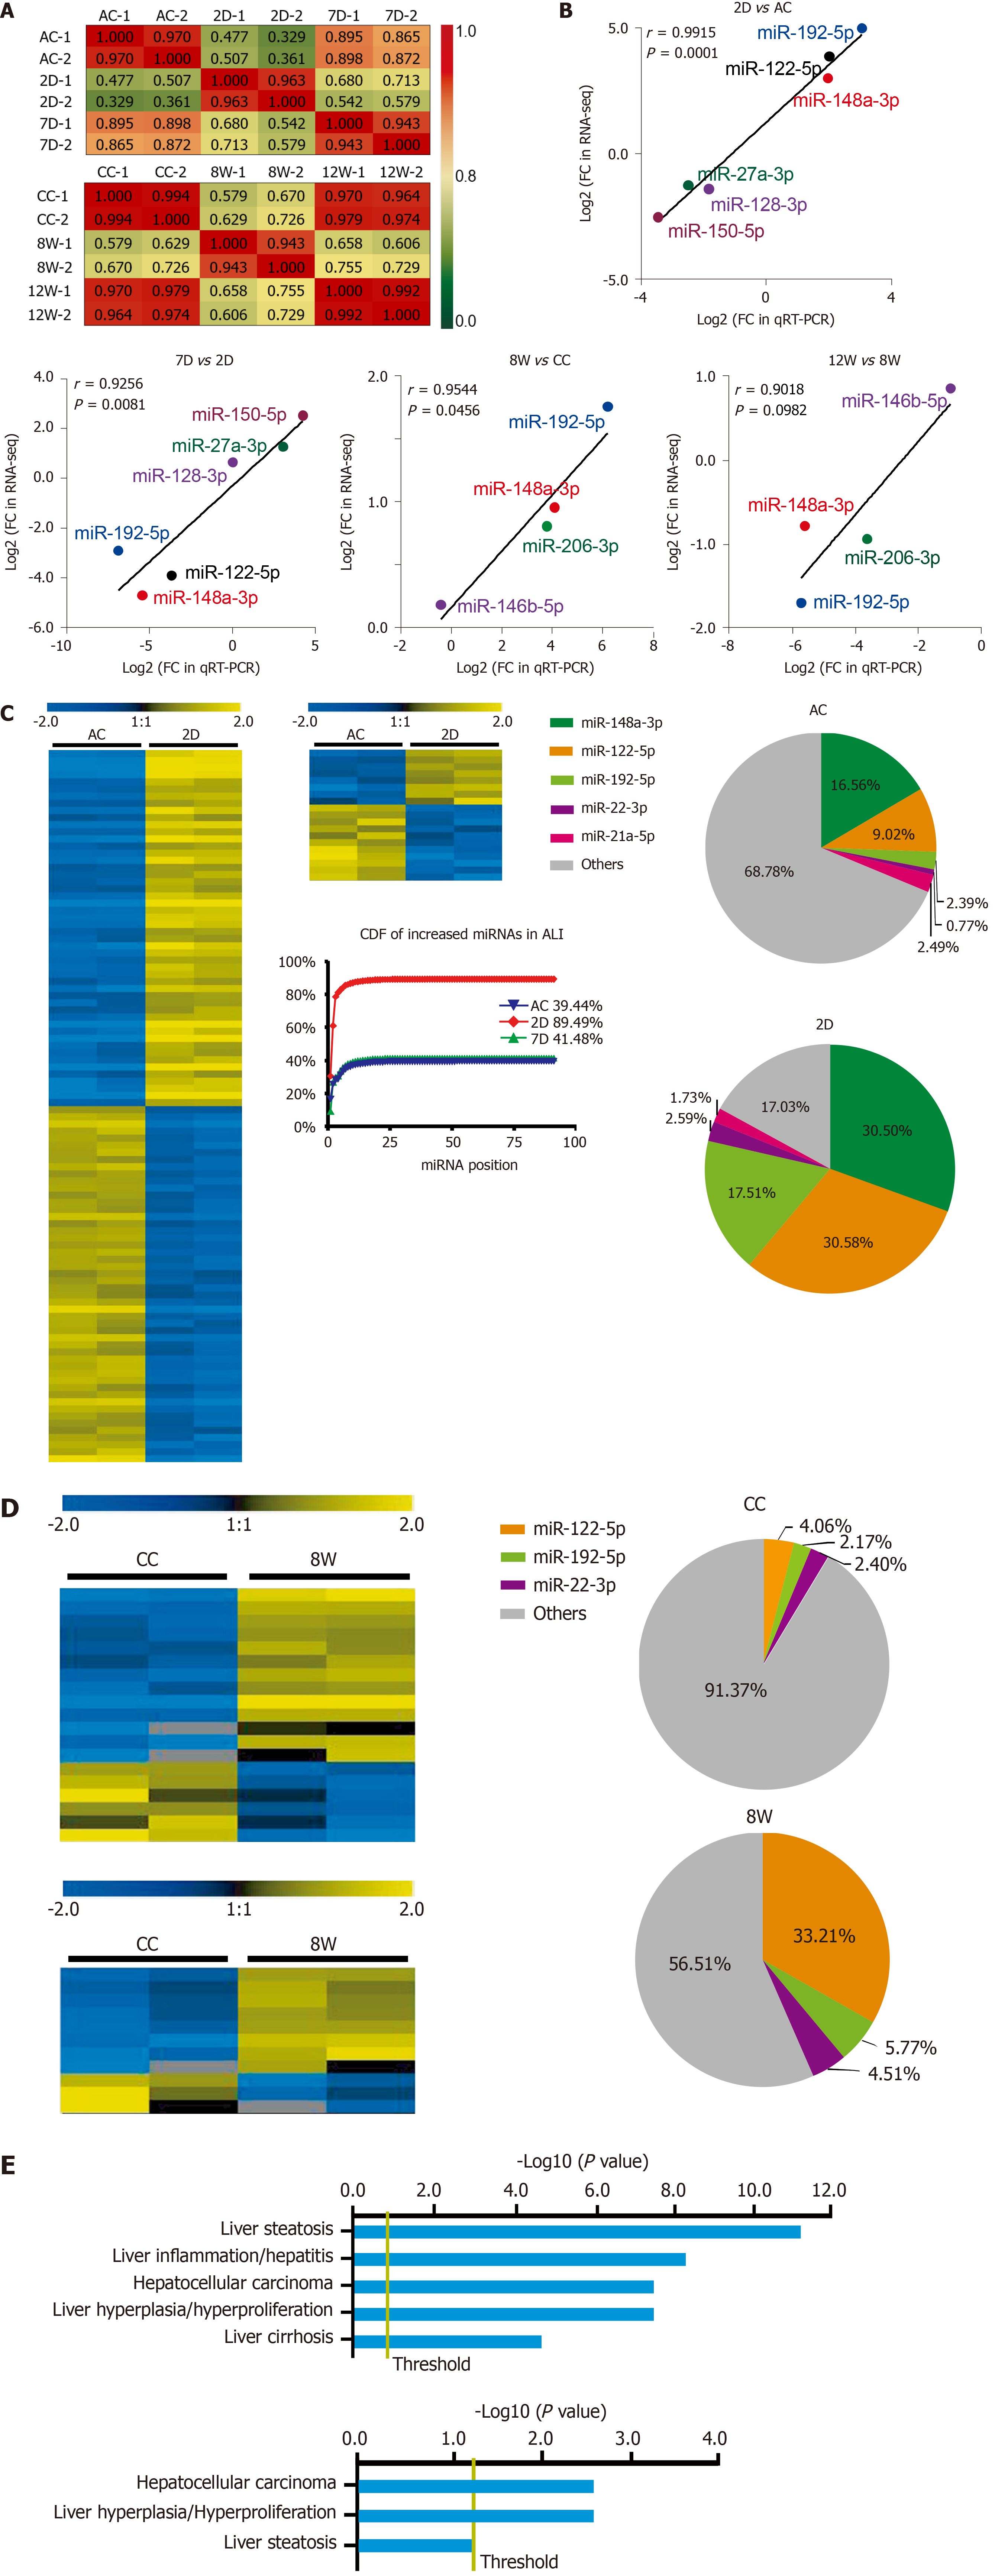
Figure 4 Differentially expressed microRNAs in serum small extracellular vesicles from acute liver injury and chronic liver injury mice and their biological significance.
A: Pearson correlation coefficients between samples from acute liver injury (ALI) and chronic liver injury (CLI). The correlation coefficient values are labeled in the heat map; red or green represents high or low correlation, respectively; B: Validation of RNA sequencing data by quantitative real-time polymerase chain reaction for microRNAs (miRNAs) from ALI and CLI; C: Heatmap for the differentially expressed miRNAs in the ALI injury stage (2 d vs ALI control) and recovery stage (7 d vs ALI control), a cumulative distribution frequency plot for the increased miRNAs in ALI, and pie charts illustrating the proportions of the top five upregulated miRNAs in the ALI control and 2 d groups; D: Heatmap for the differentially expressed miRNAs in the CLI injury stage (8 wk vs CLI control) and recovery stage (12 wk vs CLI control). The pie charts illustrate the proportions of the top three upregulated miRNAs in the CLI control and 8 wk groups; E: The top hepatotoxicity processes related to the differentially expressed serum sEV miRNAs in ALI (top) and the differentially expressed serum sEV miRNAs in CLI (bottom) cataloged by Ingenuity Pathway Analysis-Tox function analysis. D: Day; W: Week; AC: Acute liver injury control; CC: Chronic liver injury control; ALI: Acute liver injury; CDF: Cumulative distribution frequency; qRT-PCR: Quantitative real-time polymerase chain reaction; FC: Fold change; RNA-seq: RNA sequencing; miRNA: MicroRNA.
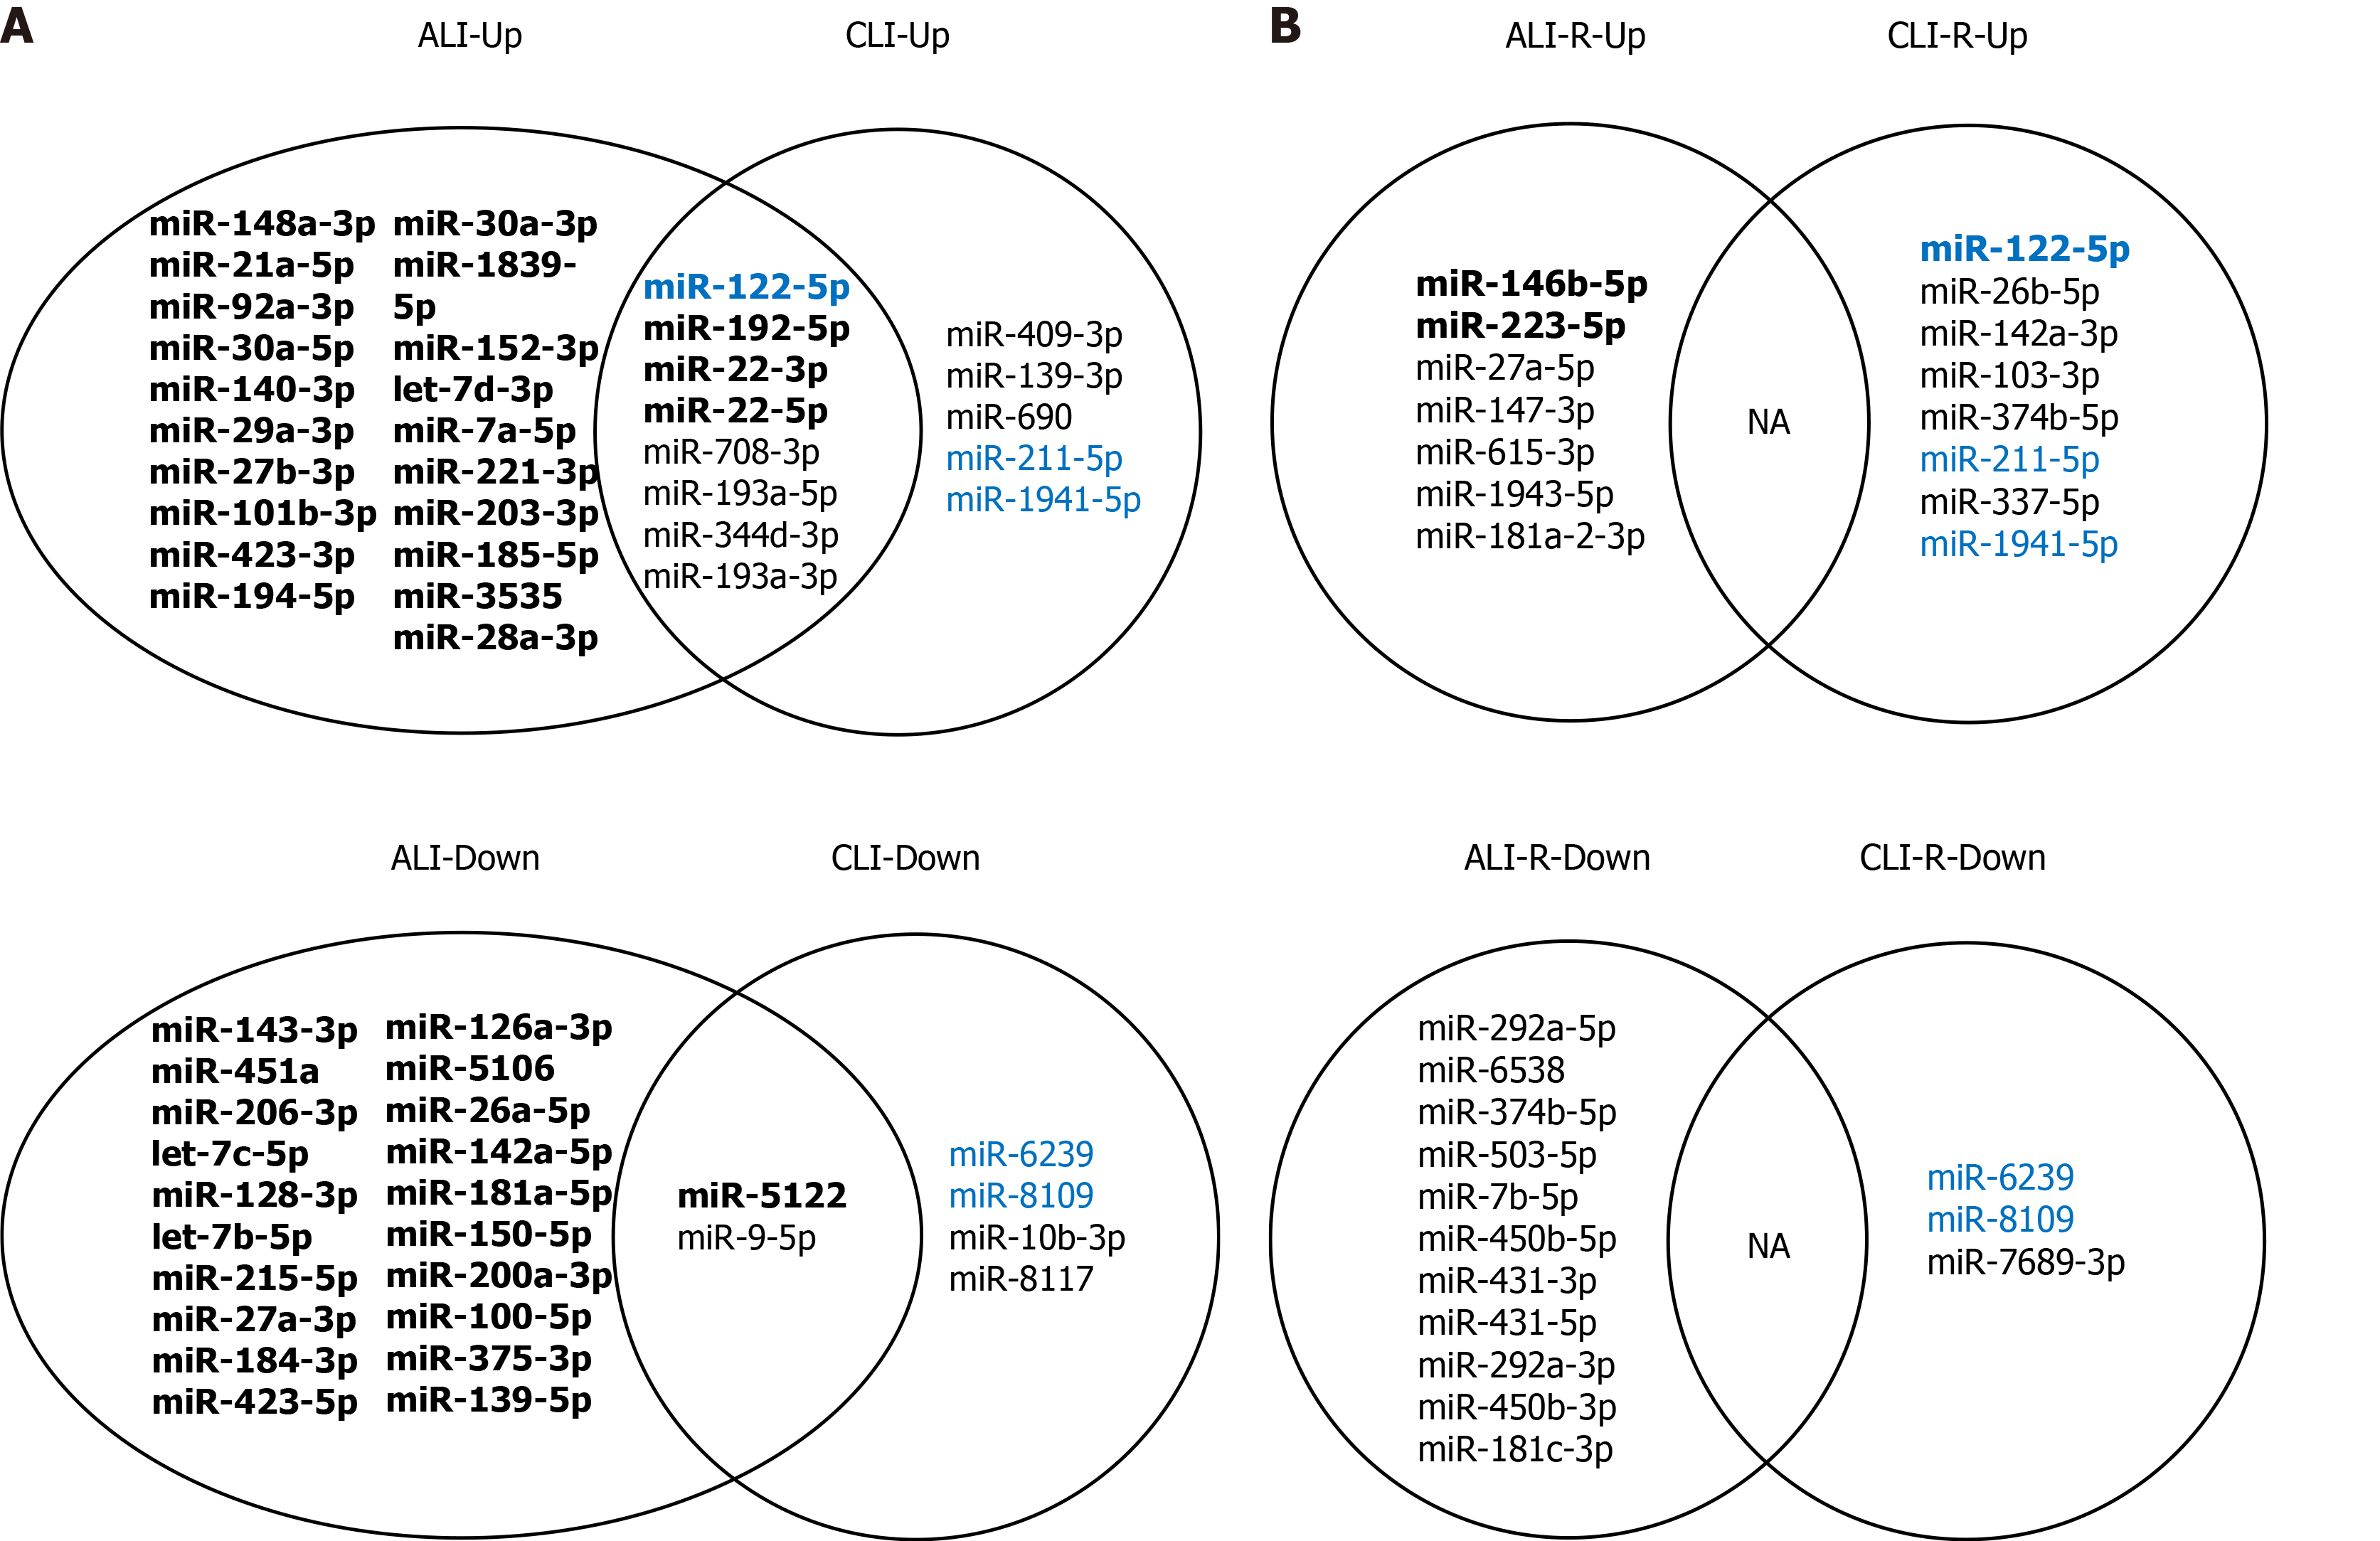
Figure 5 Common and specific microRNAs for acute and chronic liver injury and recovery in mouse models.
A: Common and specific microRNAs (miRNAs) for acute and chronic liver injury; B: Common and specific miRNAs for the recovery stages of acute and chronic liver injury. Bold font: Transcripts per million reads Mean > 1000; Blue font: Overlapping microRNAs in injury and recovery; NA: Not applicable; ALI: Acute liver injury; CLI: Chronic liver injury; ALI-R: Acute liver injury recovery; CLI-R: Chronic liver injury recovery.
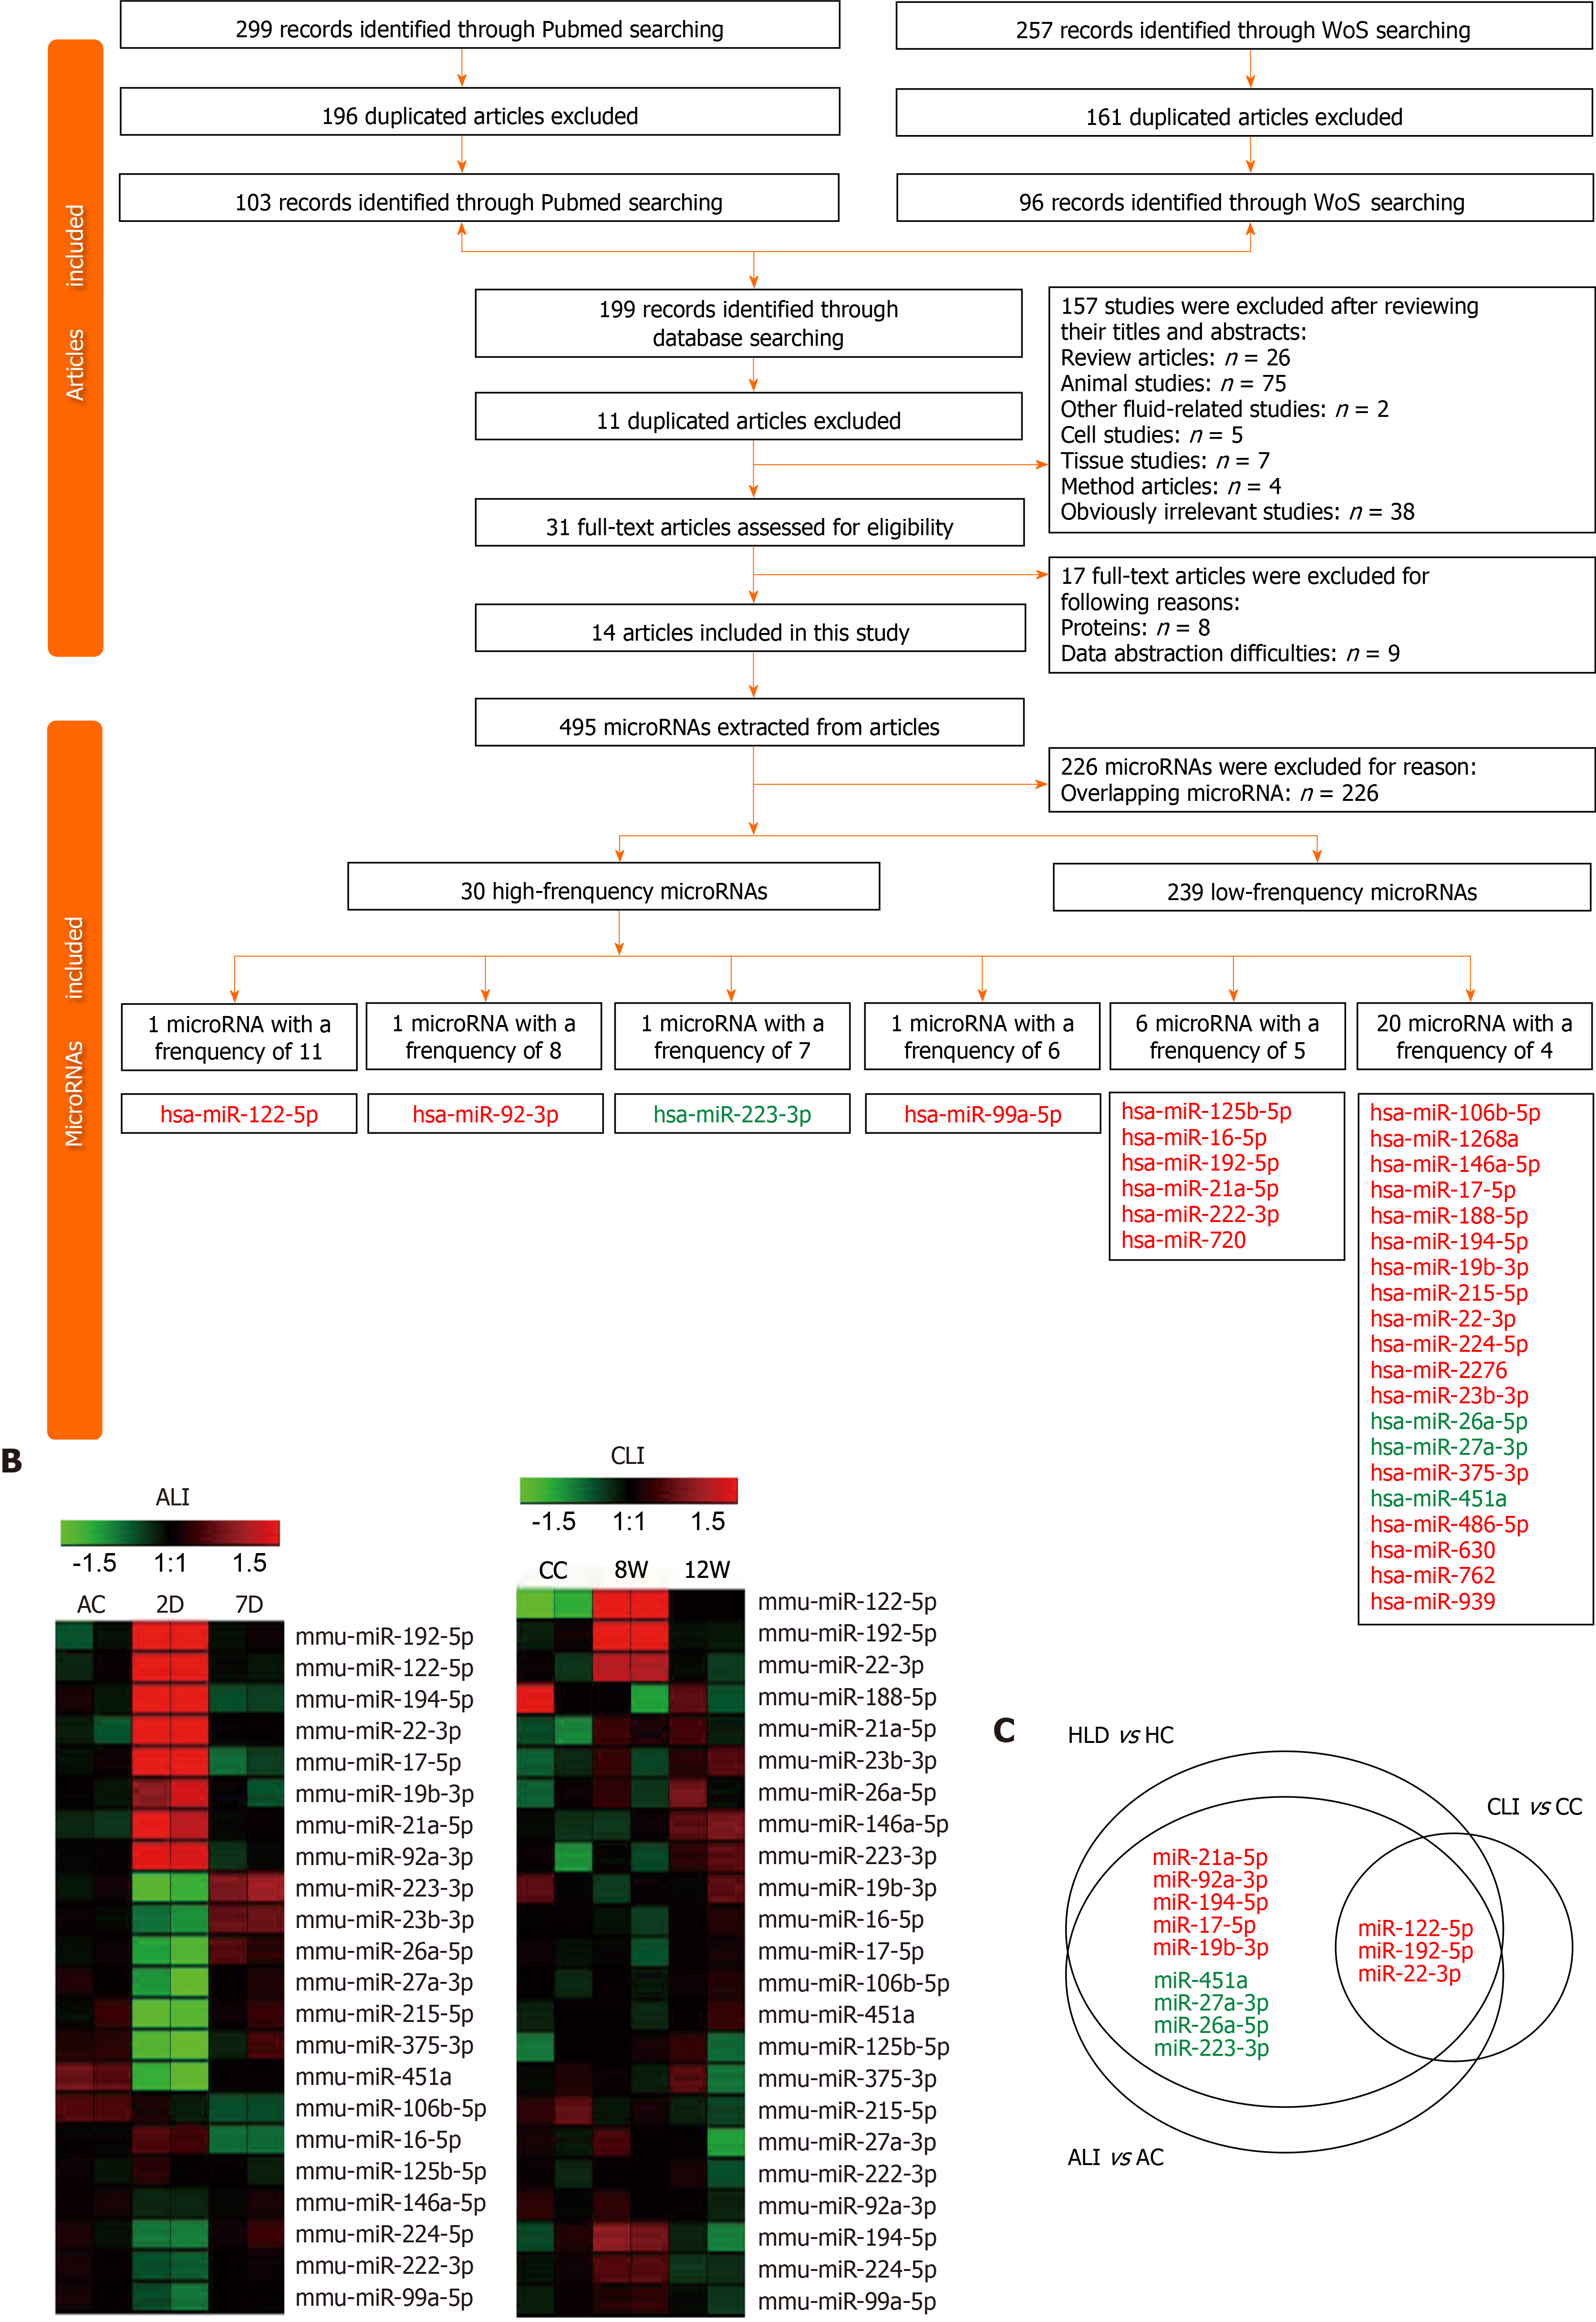
Figure 6 Differentially expressed circulating microRNAs in human liver disease and common microRNAs in mice.
A: Flow chart of study selection and microRNA (miRNA) screening; B: Heatmap for the expression of high-frequency human liver disease (HLD)-related circulating miRNAs in acute liver injury (ALI) and chronic liver injury (CLI) serum small extracellular vesicles (sEVs); C: Common miRNAs in the serum sEVs from mice with ALI and CLI and in the circulation in the context of HLDs. Red font: Upregulated miRNAs; Green font: Downregulated miRNAs; HC: Healthy control; AC: Acute liver injury control; CC: Chronic liver injury control; WoS: Web of Science; D: Day; W: Week.
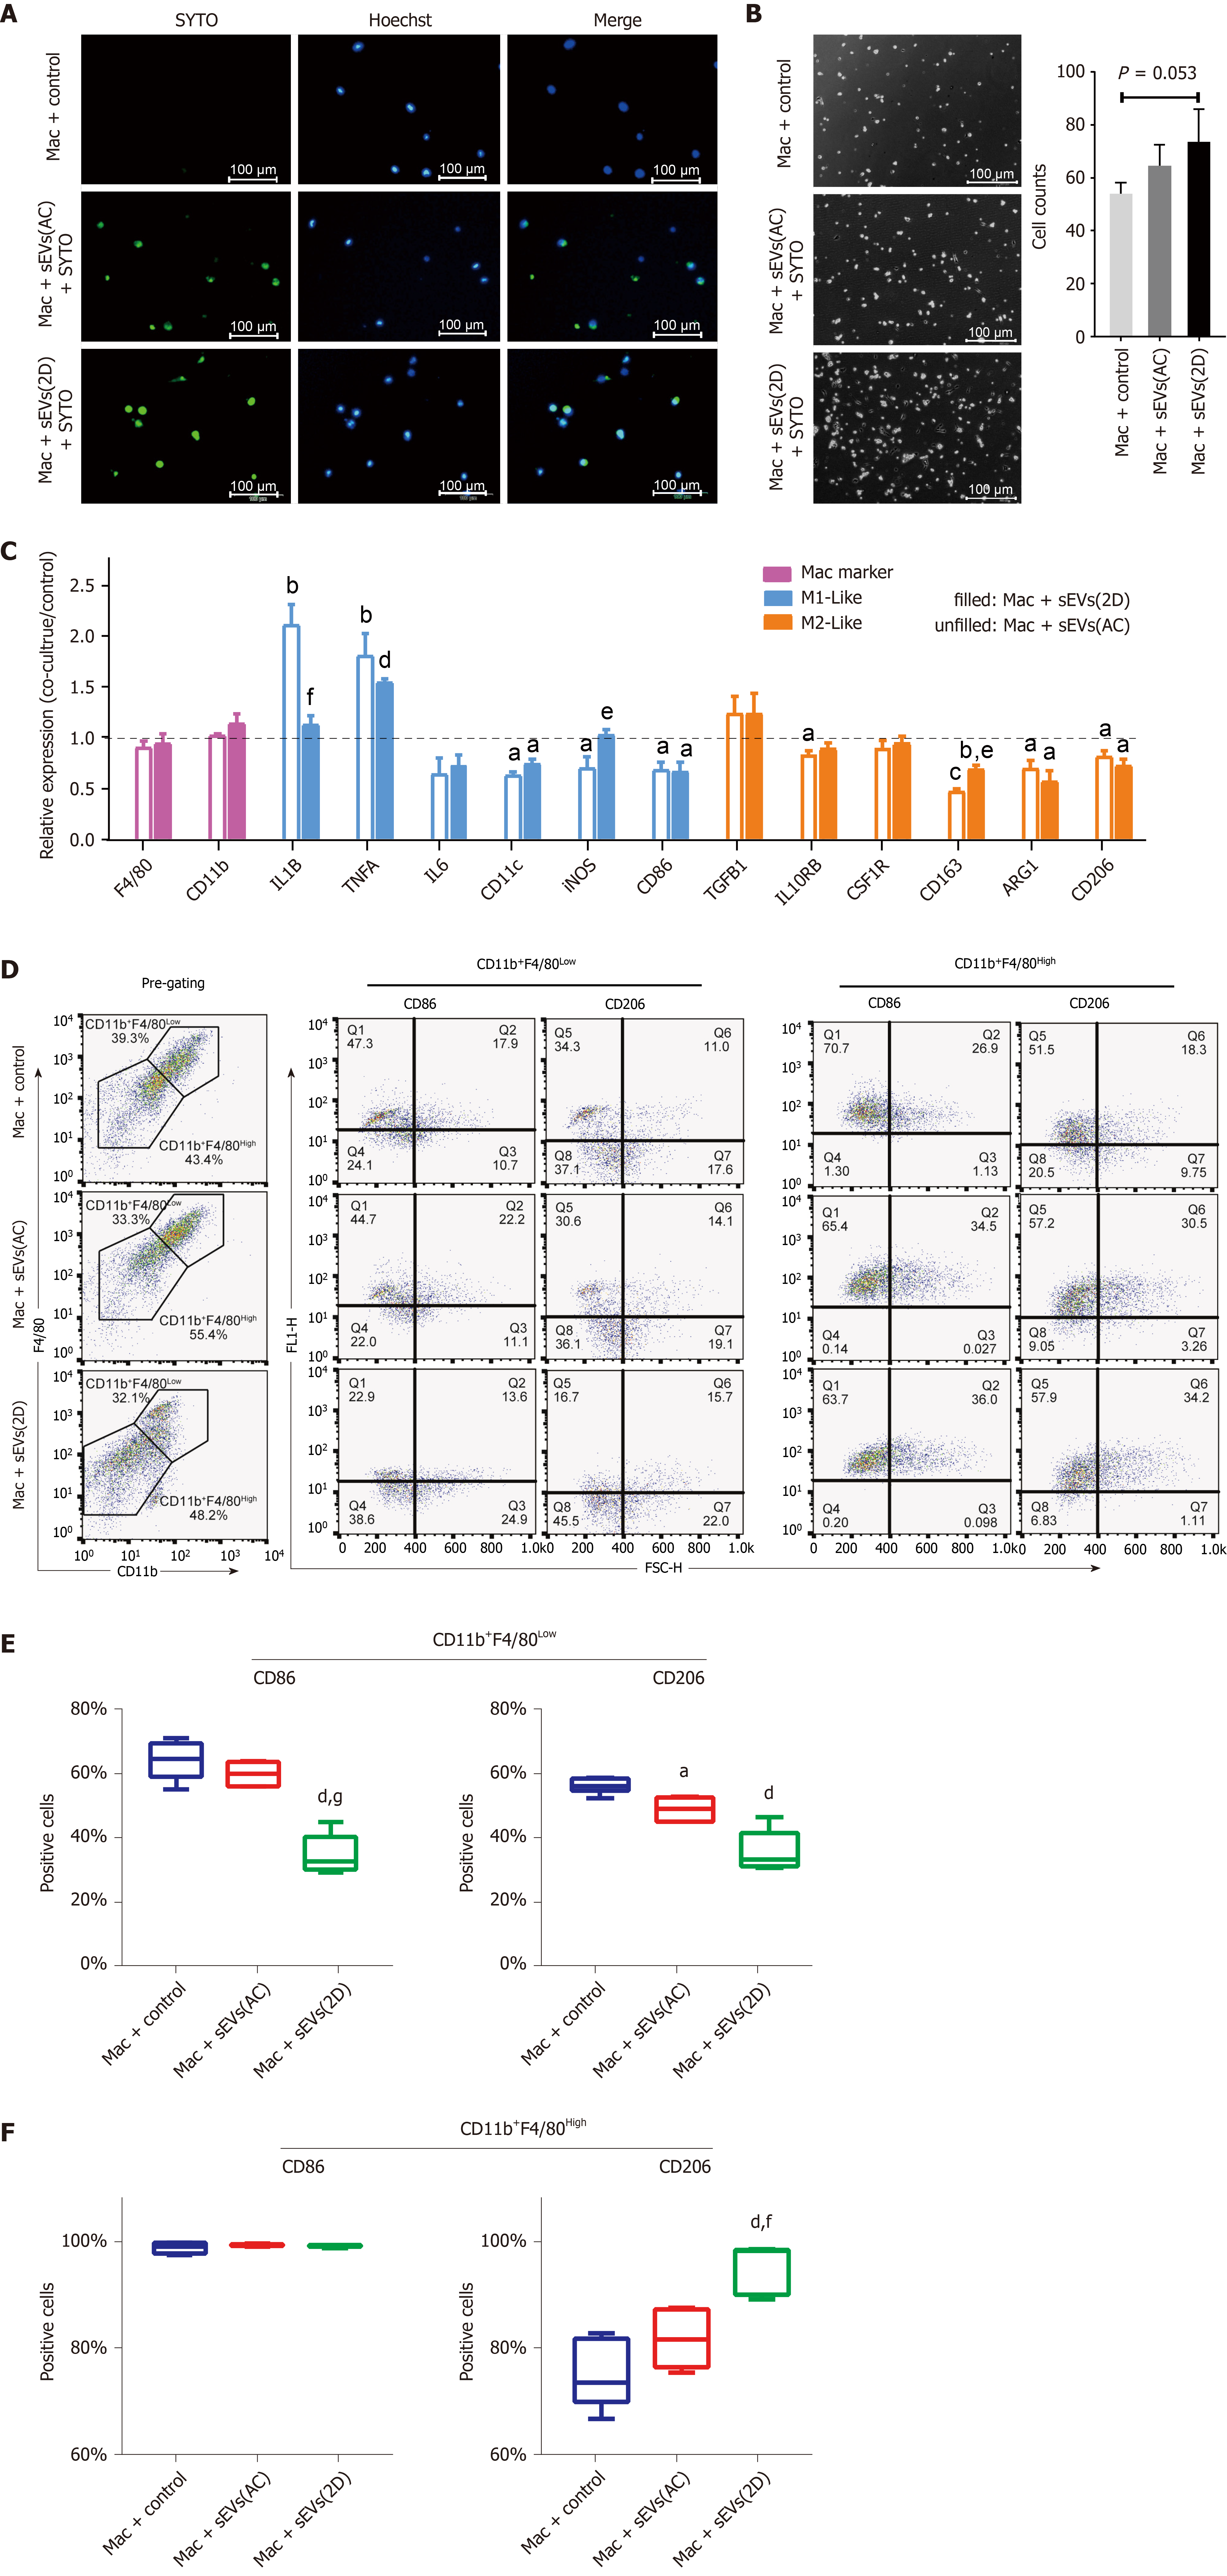
Figure 7 Uptake of serum small extracellular vesicles by hepatic macrophages and subsequent reprogramming.
A: Uptake of SYTO-labeled serum small extracellular vesicles (sEVs) from normal (AC) or acute liver injury (ALI) (2D) mice by primary hepatic macrophages; B: Hepatic macrophages were incubated with AC or 2D serum sEVs for 24 h. The number of attached cells per 200 × field is shown; C: Expression of M1- and M2-like cell surface markers and cytokines in hepatic macrophages incubated with mice serum sEVs. The unfilled column represents macrophages incubated with AC sEVs, and the filled column represents macrophages incubated with 2D sEVs. Compared with the untreated control group, aP < 0.05, bP < 0.01, cP < 0.001, dP < 0.0001; compared with the AC sEV treatment group, eP < 0.05, fP < 0.01; D: Macrophages were defined as CD11b+F4/80Low and CD11b+F4/80High subgroups. The representative images show the percentage of CD86-and CD206-positive cells in each subgroup subjected to the control, AC sEV and 2D sEV treatments; E: CD86- and CD206-positive cells in each subgroup. Compared with the control group, aP < 0.05, dP < 0.0001; compared with the AC sEV treatment group, fP < 0.01, gP < 0.0001. Scale bar = 100 μm. Mac: Macrophage; D: Day; AC: Acute liver injury control; sEVs: Small extracellular vesicles.
- Citation: Lv XF, Zhang AQ, Liu WQ, Zhao M, Li J, He L, Cheng L, Sun YF, Qin G, Lu P, Ji YH, Ji JL. Liver injury changes the biological characters of serum small extracellular vesicles and reprograms hepatic macrophages in mice. World J Gastroenterol 2021; 27(43): 7509-7529
- URL: https://www.wjgnet.com/1007-9327/full/v27/i43/7509.htm
- DOI: https://dx.doi.org/10.3748/wjg.v27.i43.7509


