Copyright
©The Author(s) 2021.
World J Gastroenterol. Oct 7, 2021; 27(37): 6248-6261
Published online Oct 7, 2021. doi: 10.3748/wjg.v27.i37.6248
Published online Oct 7, 2021. doi: 10.3748/wjg.v27.i37.6248
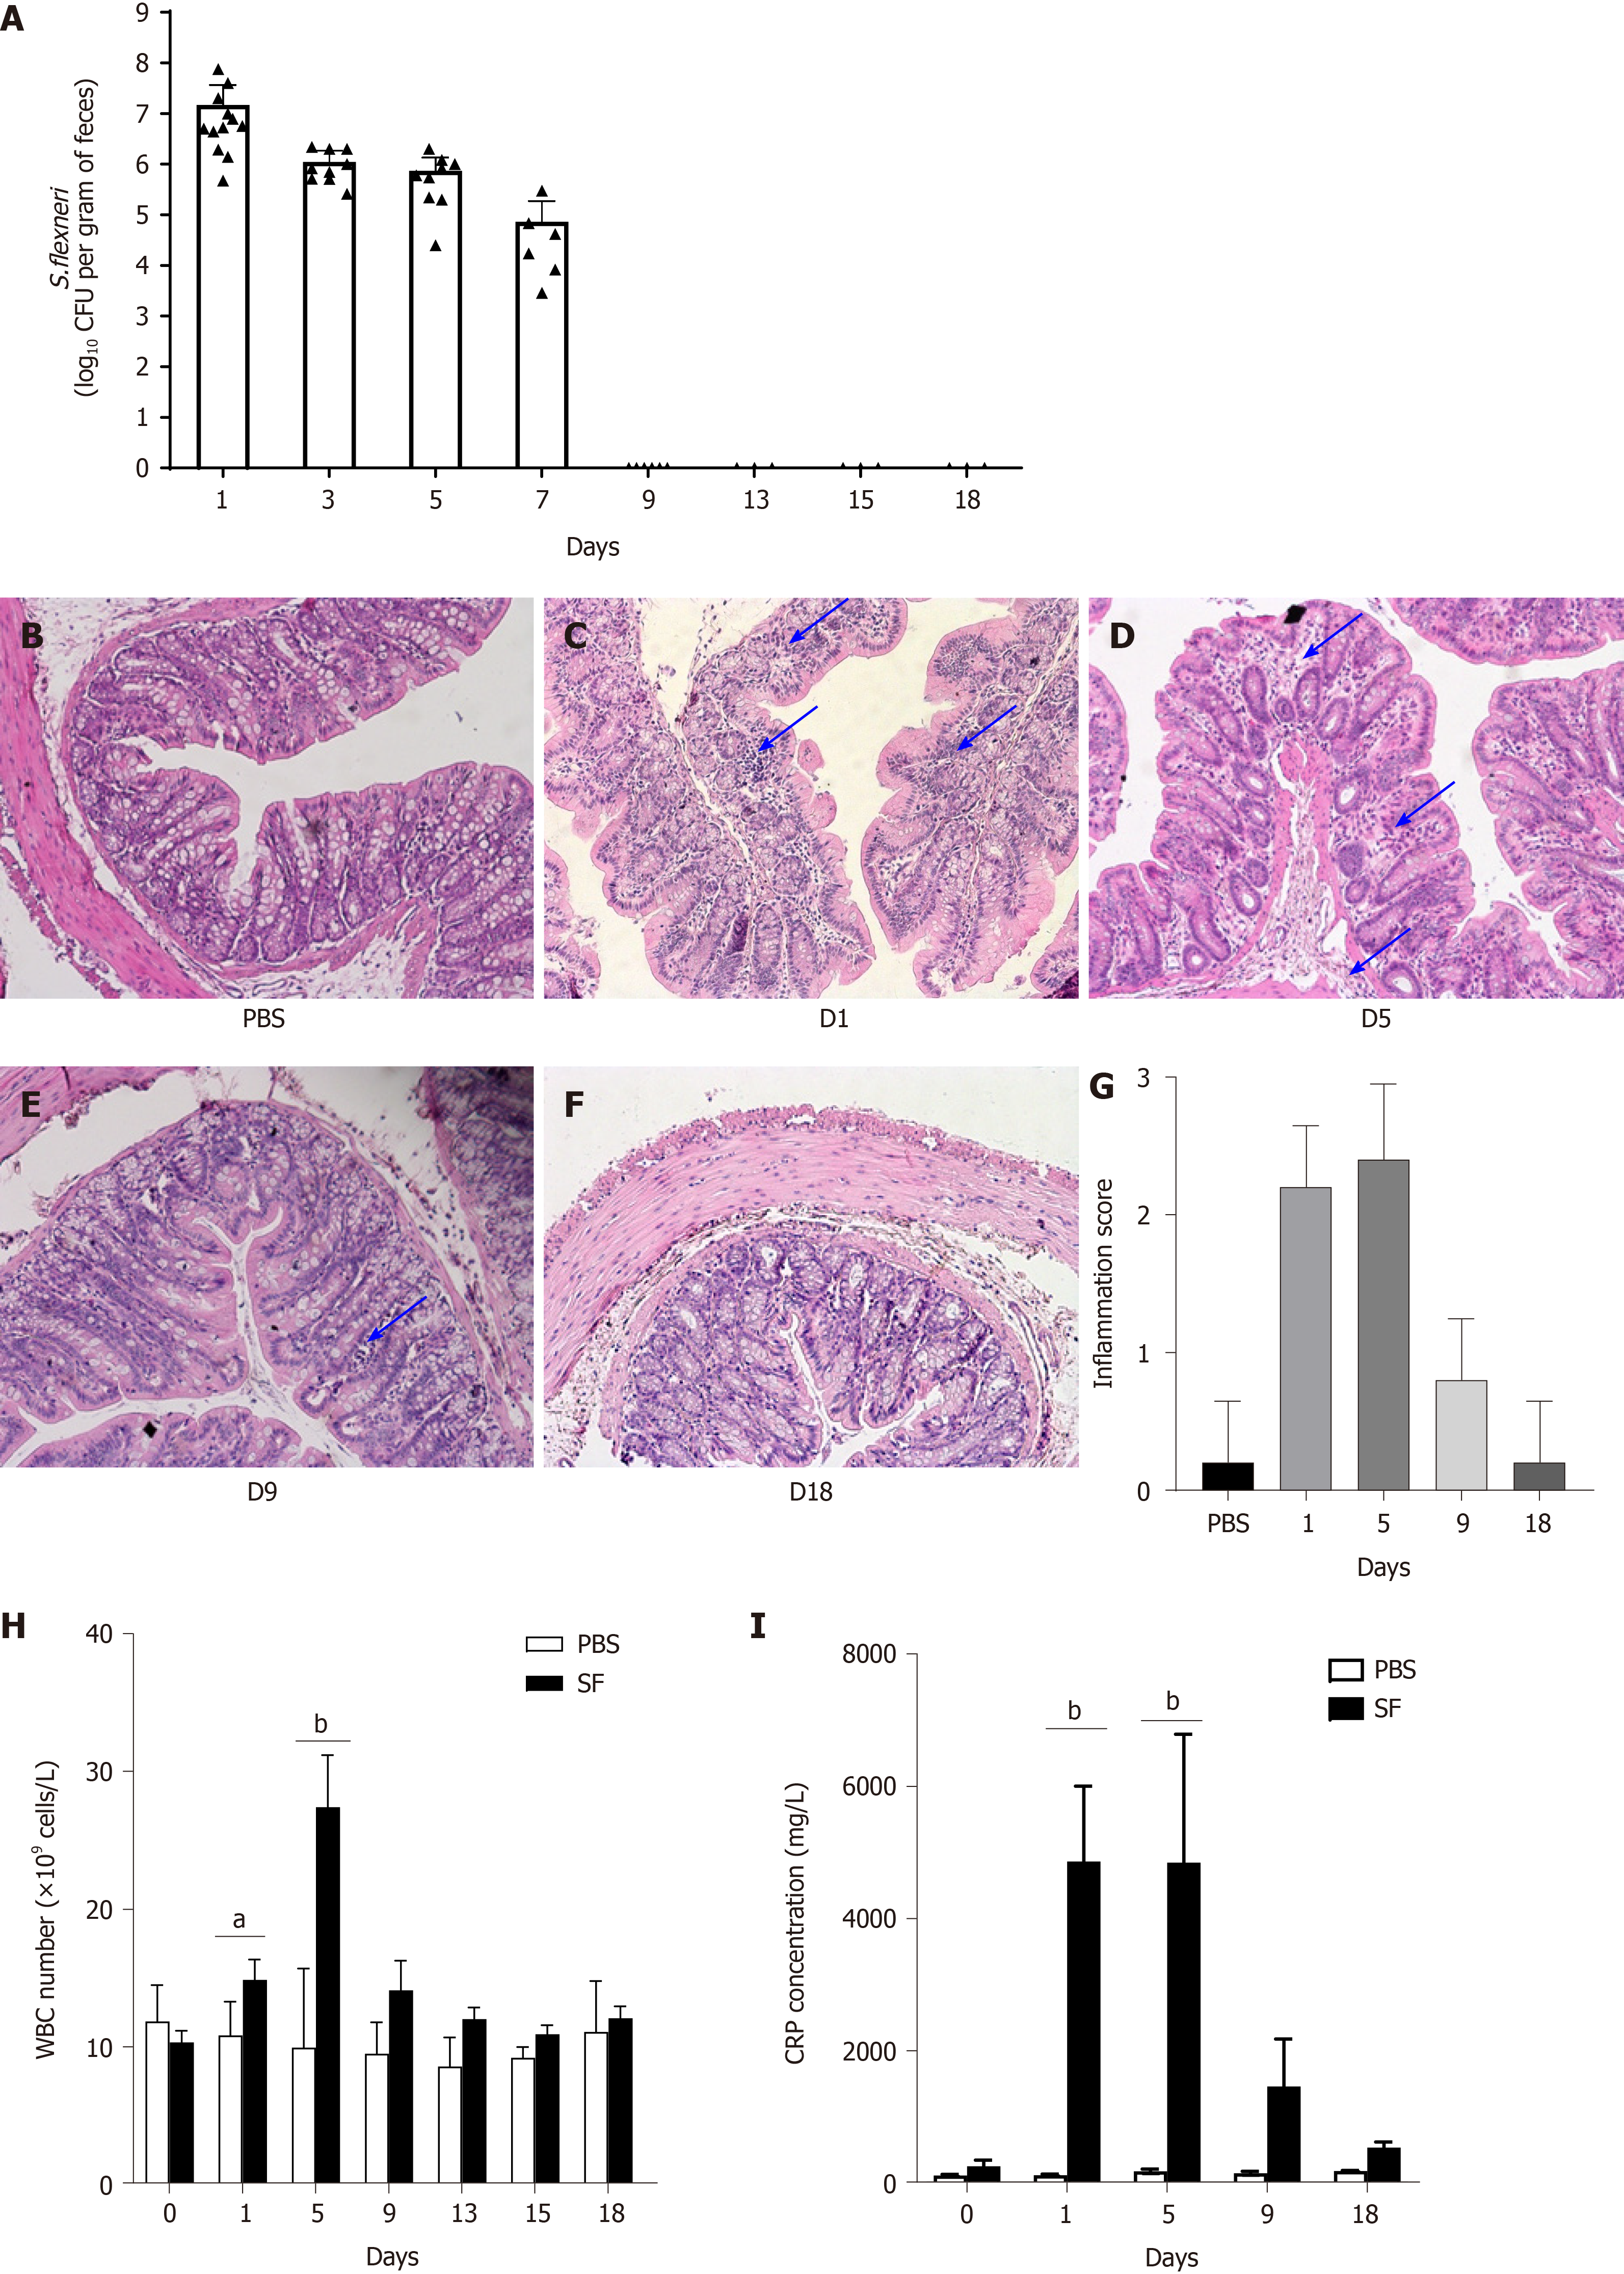
Figure 1 Pathogen colonization, intestinal inflammation, and changes in the white blood cell count and C-reactive protein level after Shigellaflexneri infection in rats.
A: Quantitative detection of Shigella flexneri (S. flexneri) in feces of Sprague-Dawley rats after infection; B-G: Representative hematoxylin & eosin (H&E) staining (100 × magnification) of colon tissue from control and S. flexneri-infected groups; B: H&E staining of normal colon tissue in the control group; C: H&E staining of colon tissue after S. flexneri infection at day 1; D: H&E staining of colon tissue on day 5; E: H&E staining of colon tissue on day 9; F: H&E staining of colon tissue on day 18; G: Inflammation scores of the control and infection groups at different time points; H: White blood cells counts in the S. flexneri infection and control groups; I: C-reactive protein in the S. flexneri infection and control groups. aP < 0.05; bP < 0.01; and cP < 0.001. Scale bar, 100 μm. Black arrows indicate inflammatory cell infiltration. PBS: Phosphate-buffered saline; WBC: White blood cell; CRP: C-reactive protein; CFU: Colony-forming units; S. flexneri: Shigella flexneri.
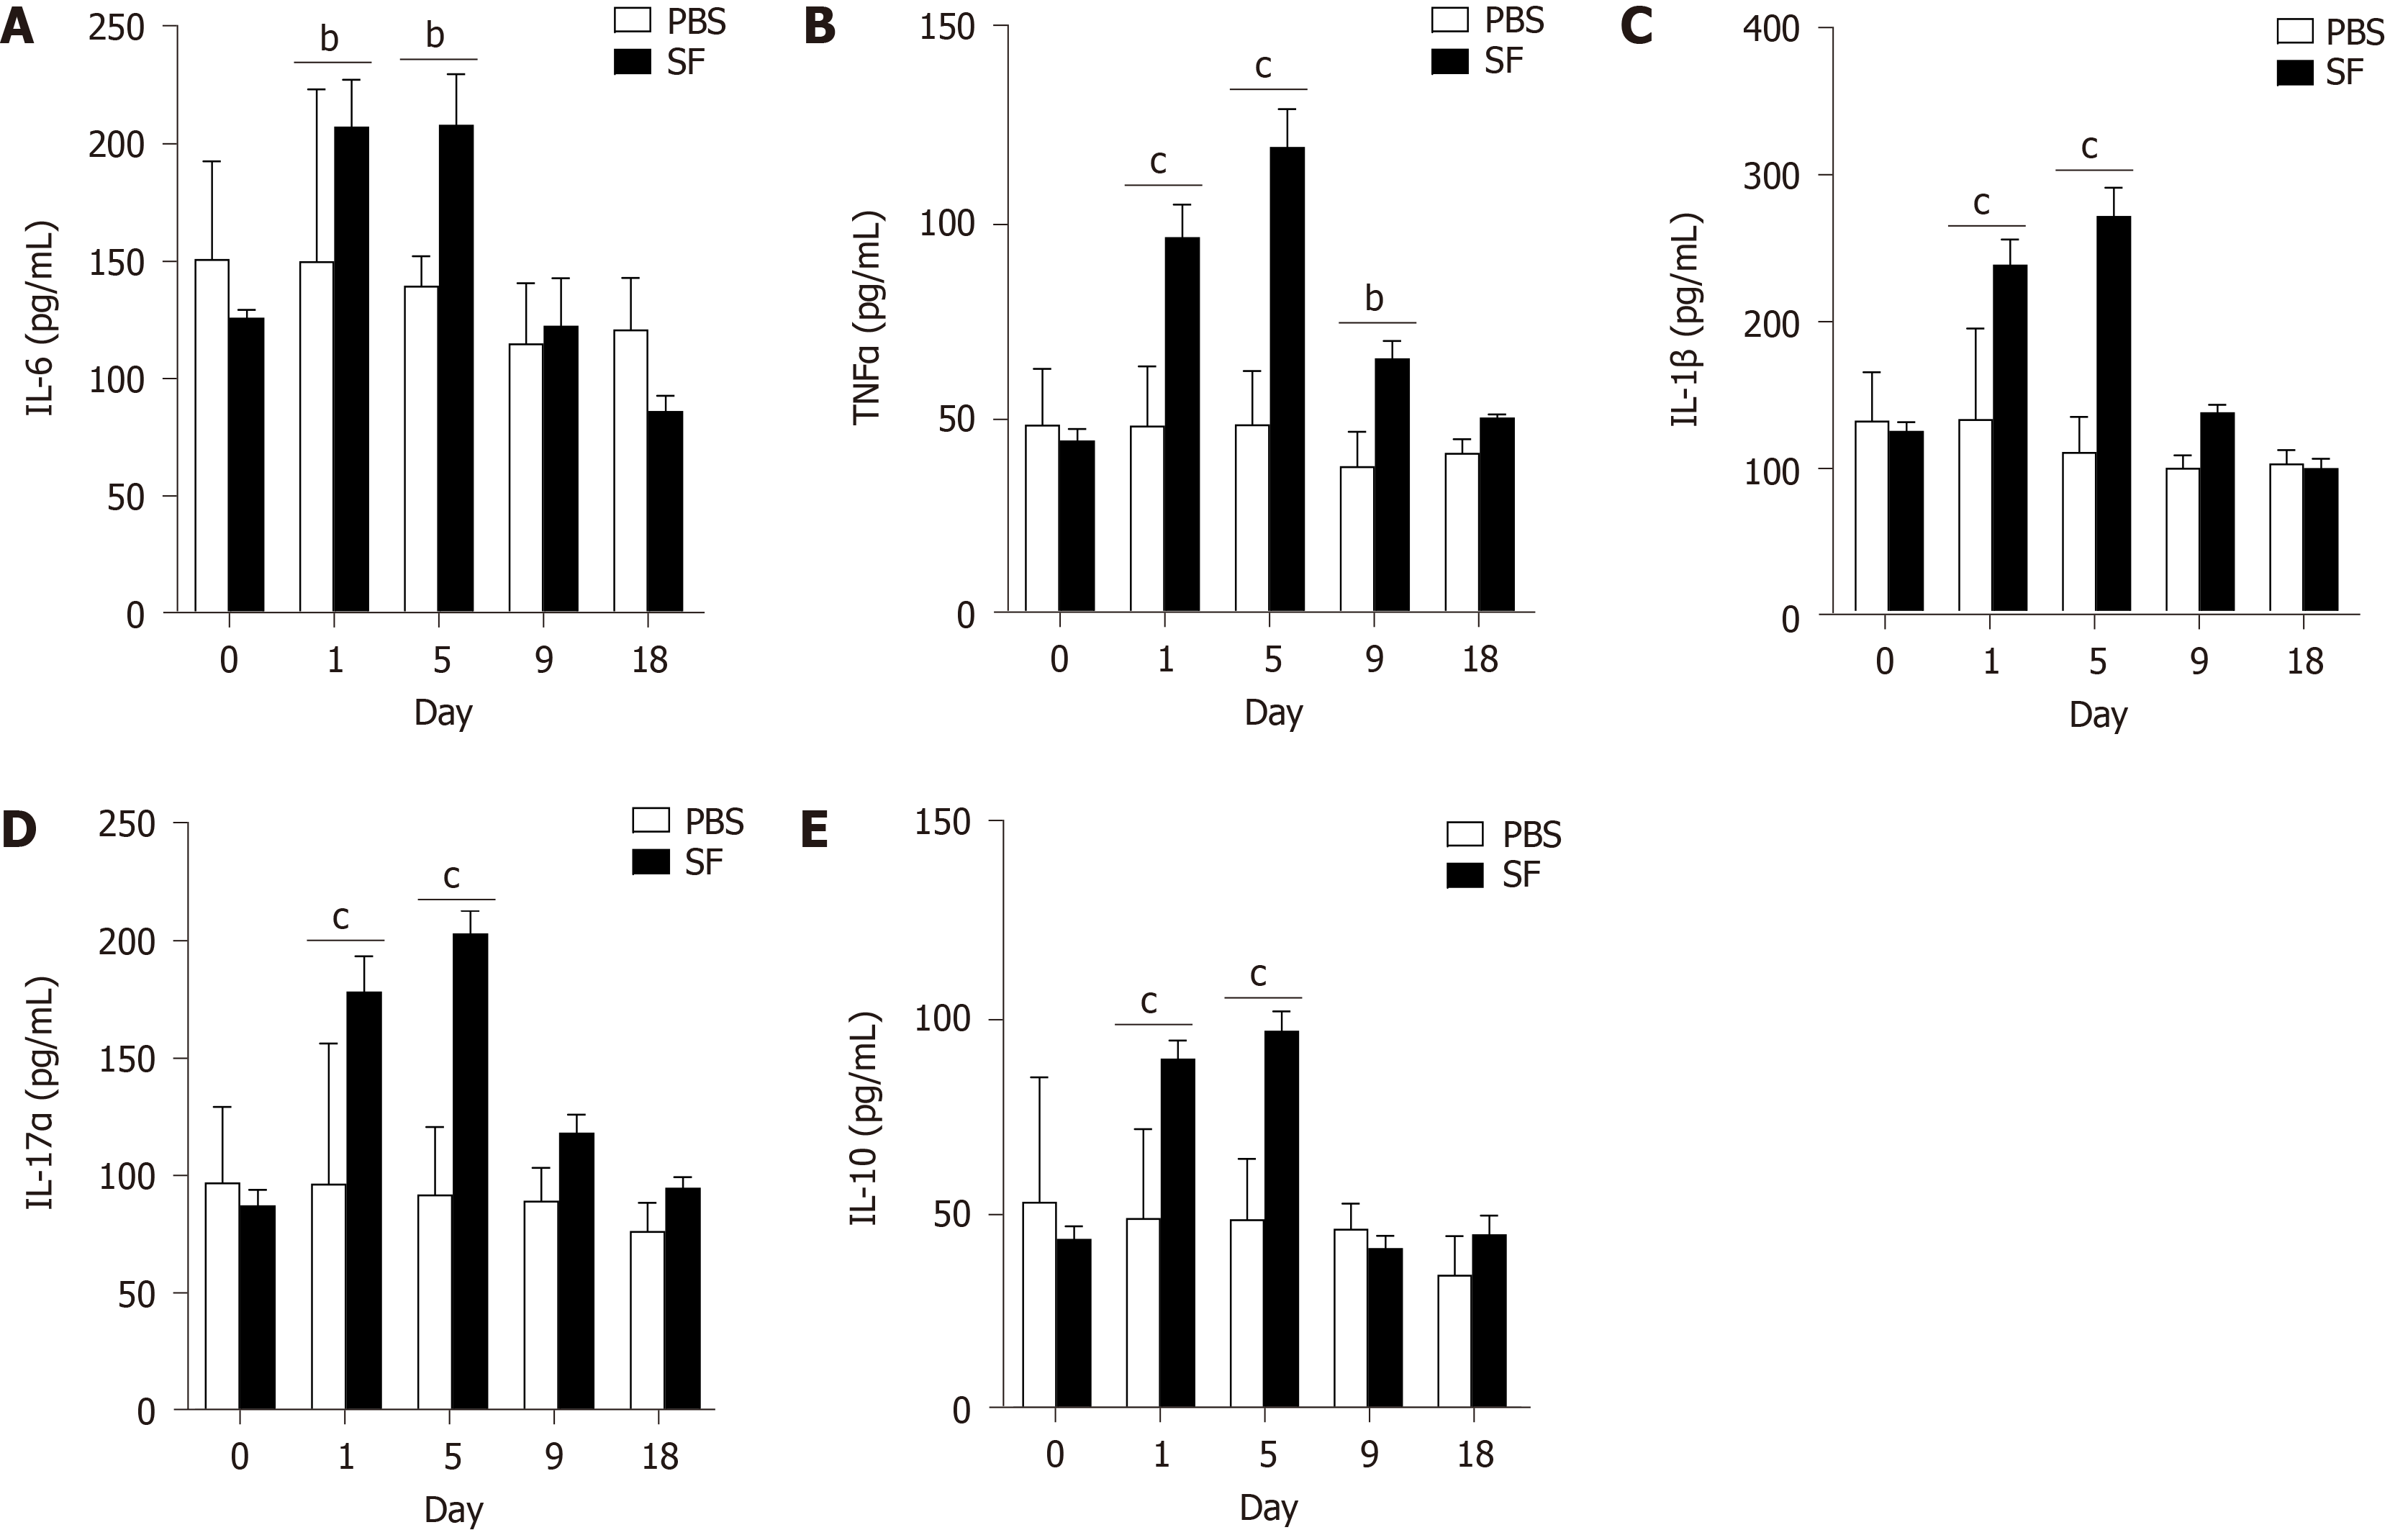
Figure 2 Inflammatory cytokines interleukin-6, tumor necrosis factor-α, interleukin-1β, interleukin-17α, and interleukin-10 detected in serum samples of Shigellaflexneri infected rats.
A: Interleukin (IL)-6; B: Tumor necrosis factor-α; C: IL-1β; D: IL-17α; E: IL-10. 0: Before infection. 1-18: The number of days after the establishment of the Shigella flexneri infection model. n = 12 per group on day 0 and day 1; n = 9 per group on day 5; n = 6 per group on day 9; n = 3 per group on day 18. Data are presented as the mean ± SEM. aP < 0.05; bP < 0.01; and cP < 0.001 (two-tailed unpaired Student’s t-test). PBS: Phosphate-buffered saline; IL: Interleukin; TNF: Tumor necrosis factor.
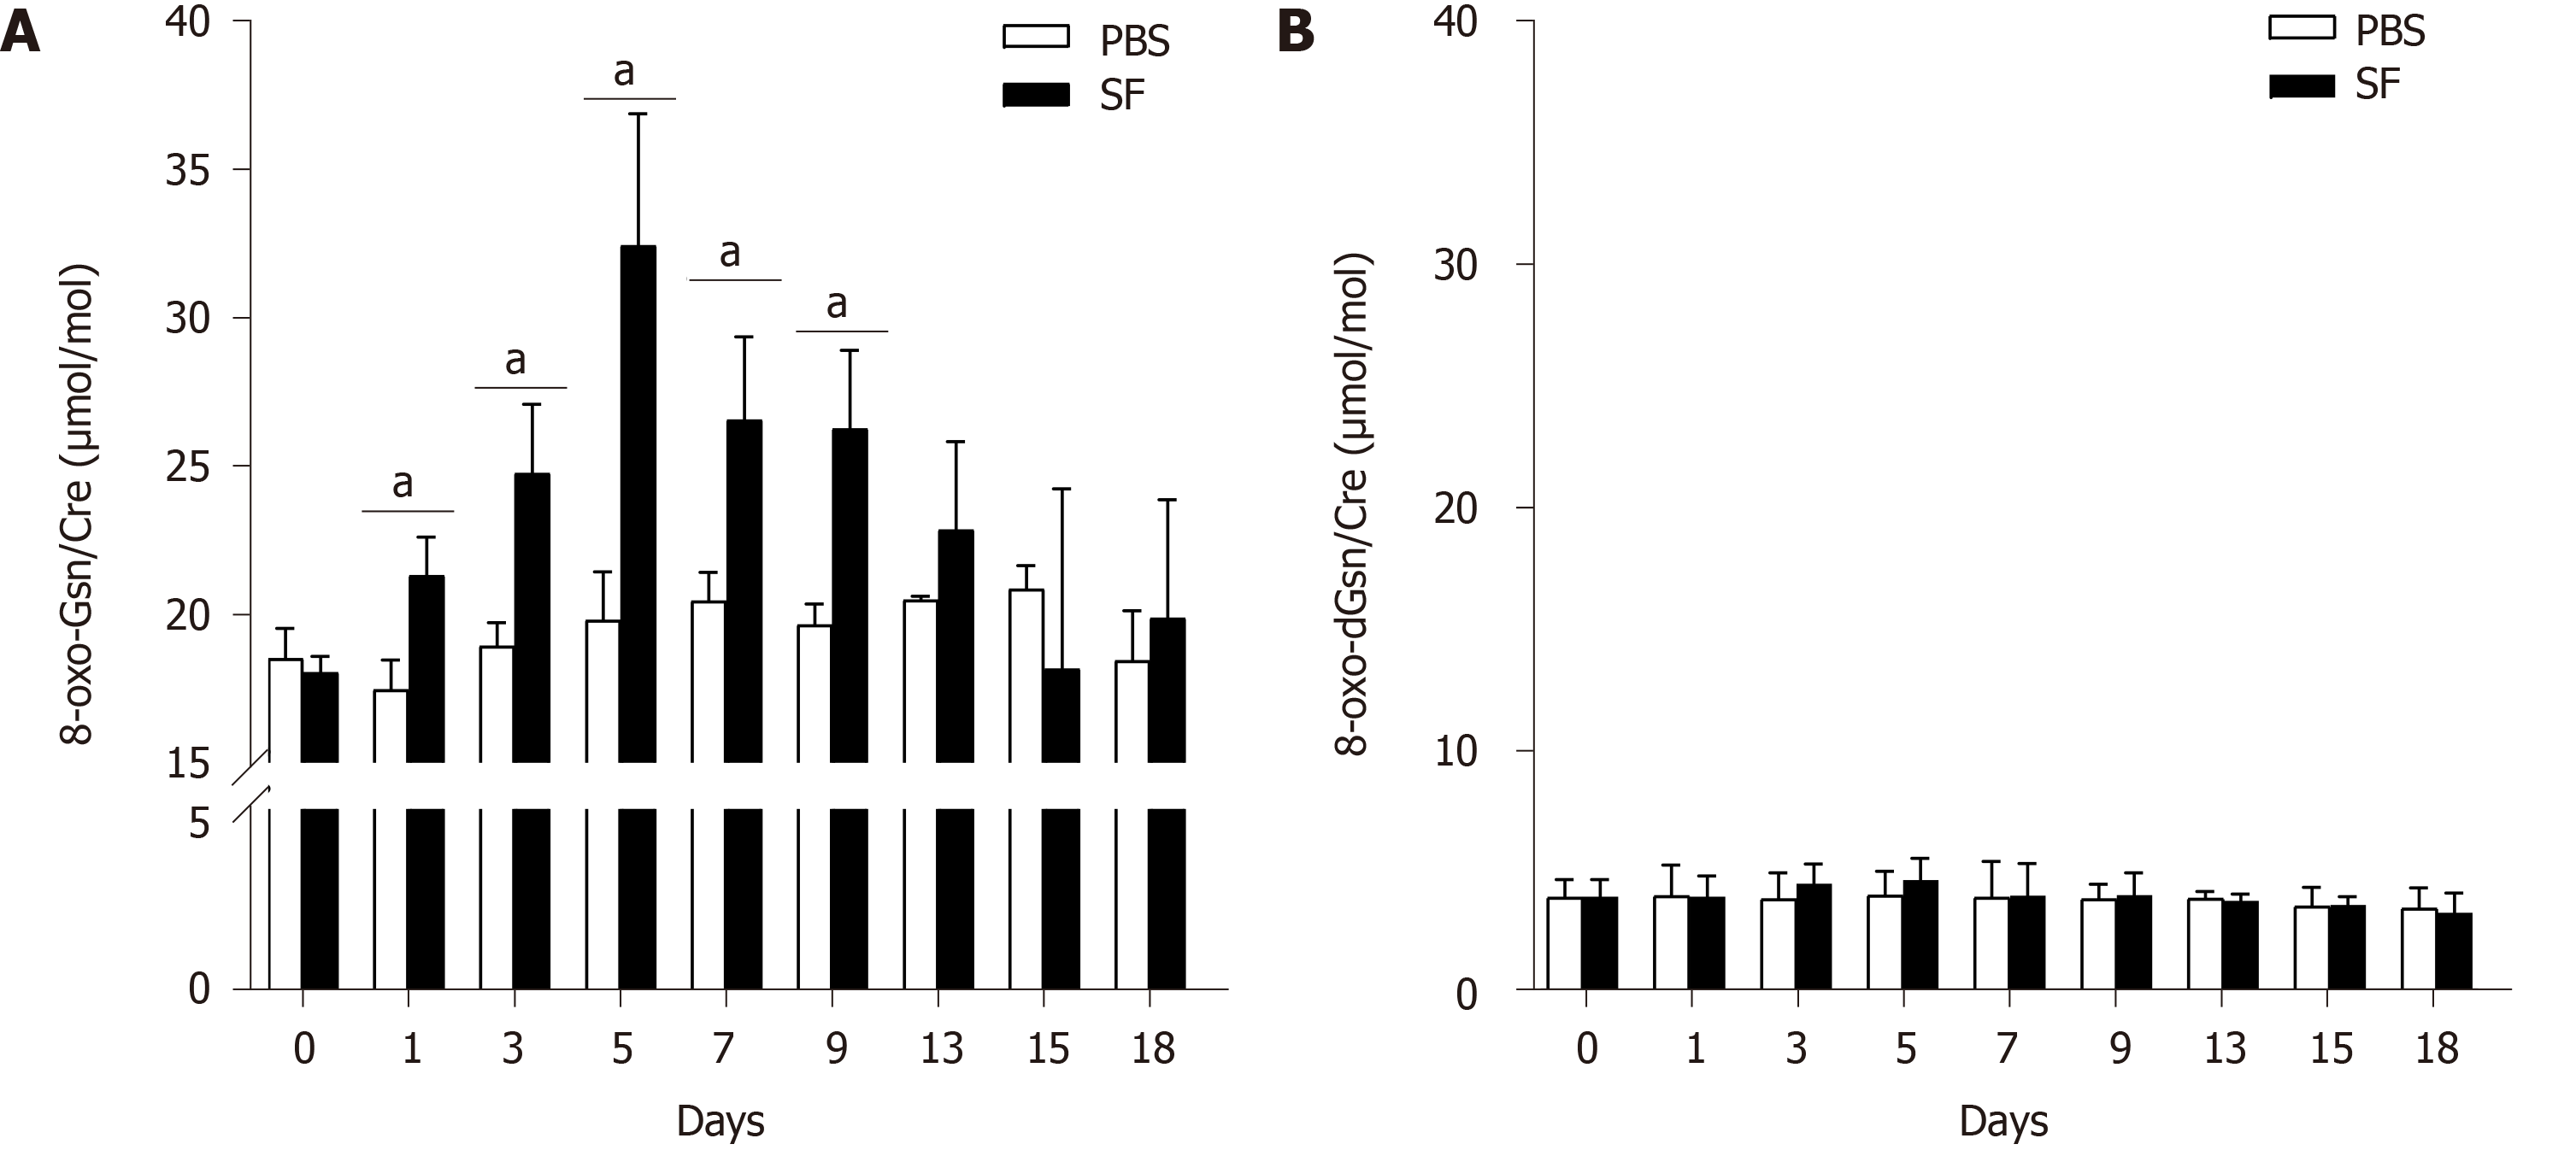
Figure 3 Liquid chromatography-tandem mass spectrometry measurement of 8-oxo-7,8-dihydroguanosine and 8-oxo-7,8-dihydro-2-deoxyguanosine in the urine of Sprague-Dawley rats.
A: Urinary 8-oxo-7,8-dihydroguanosine; B: Urinary 8-oxo-7,8-dihydro-2-deoxyguanosine. n = 12 per group on day 0 and day 1; n = 9 per group on day 3 and day 5; n = 6 per group on day 9; n = 3 per group on day 13, day 15, and day 18. 0: Before infection. 1-18: The number of days after the establishment of the Shigella flexneri infection model. aP < 0.05. 8-oxo-Gsn: 8-oxo-7,8-dihydroguanosine; 8-oxo-dGsn: 8-oxo-7,8-dihydro-2-deoxyguanosine.
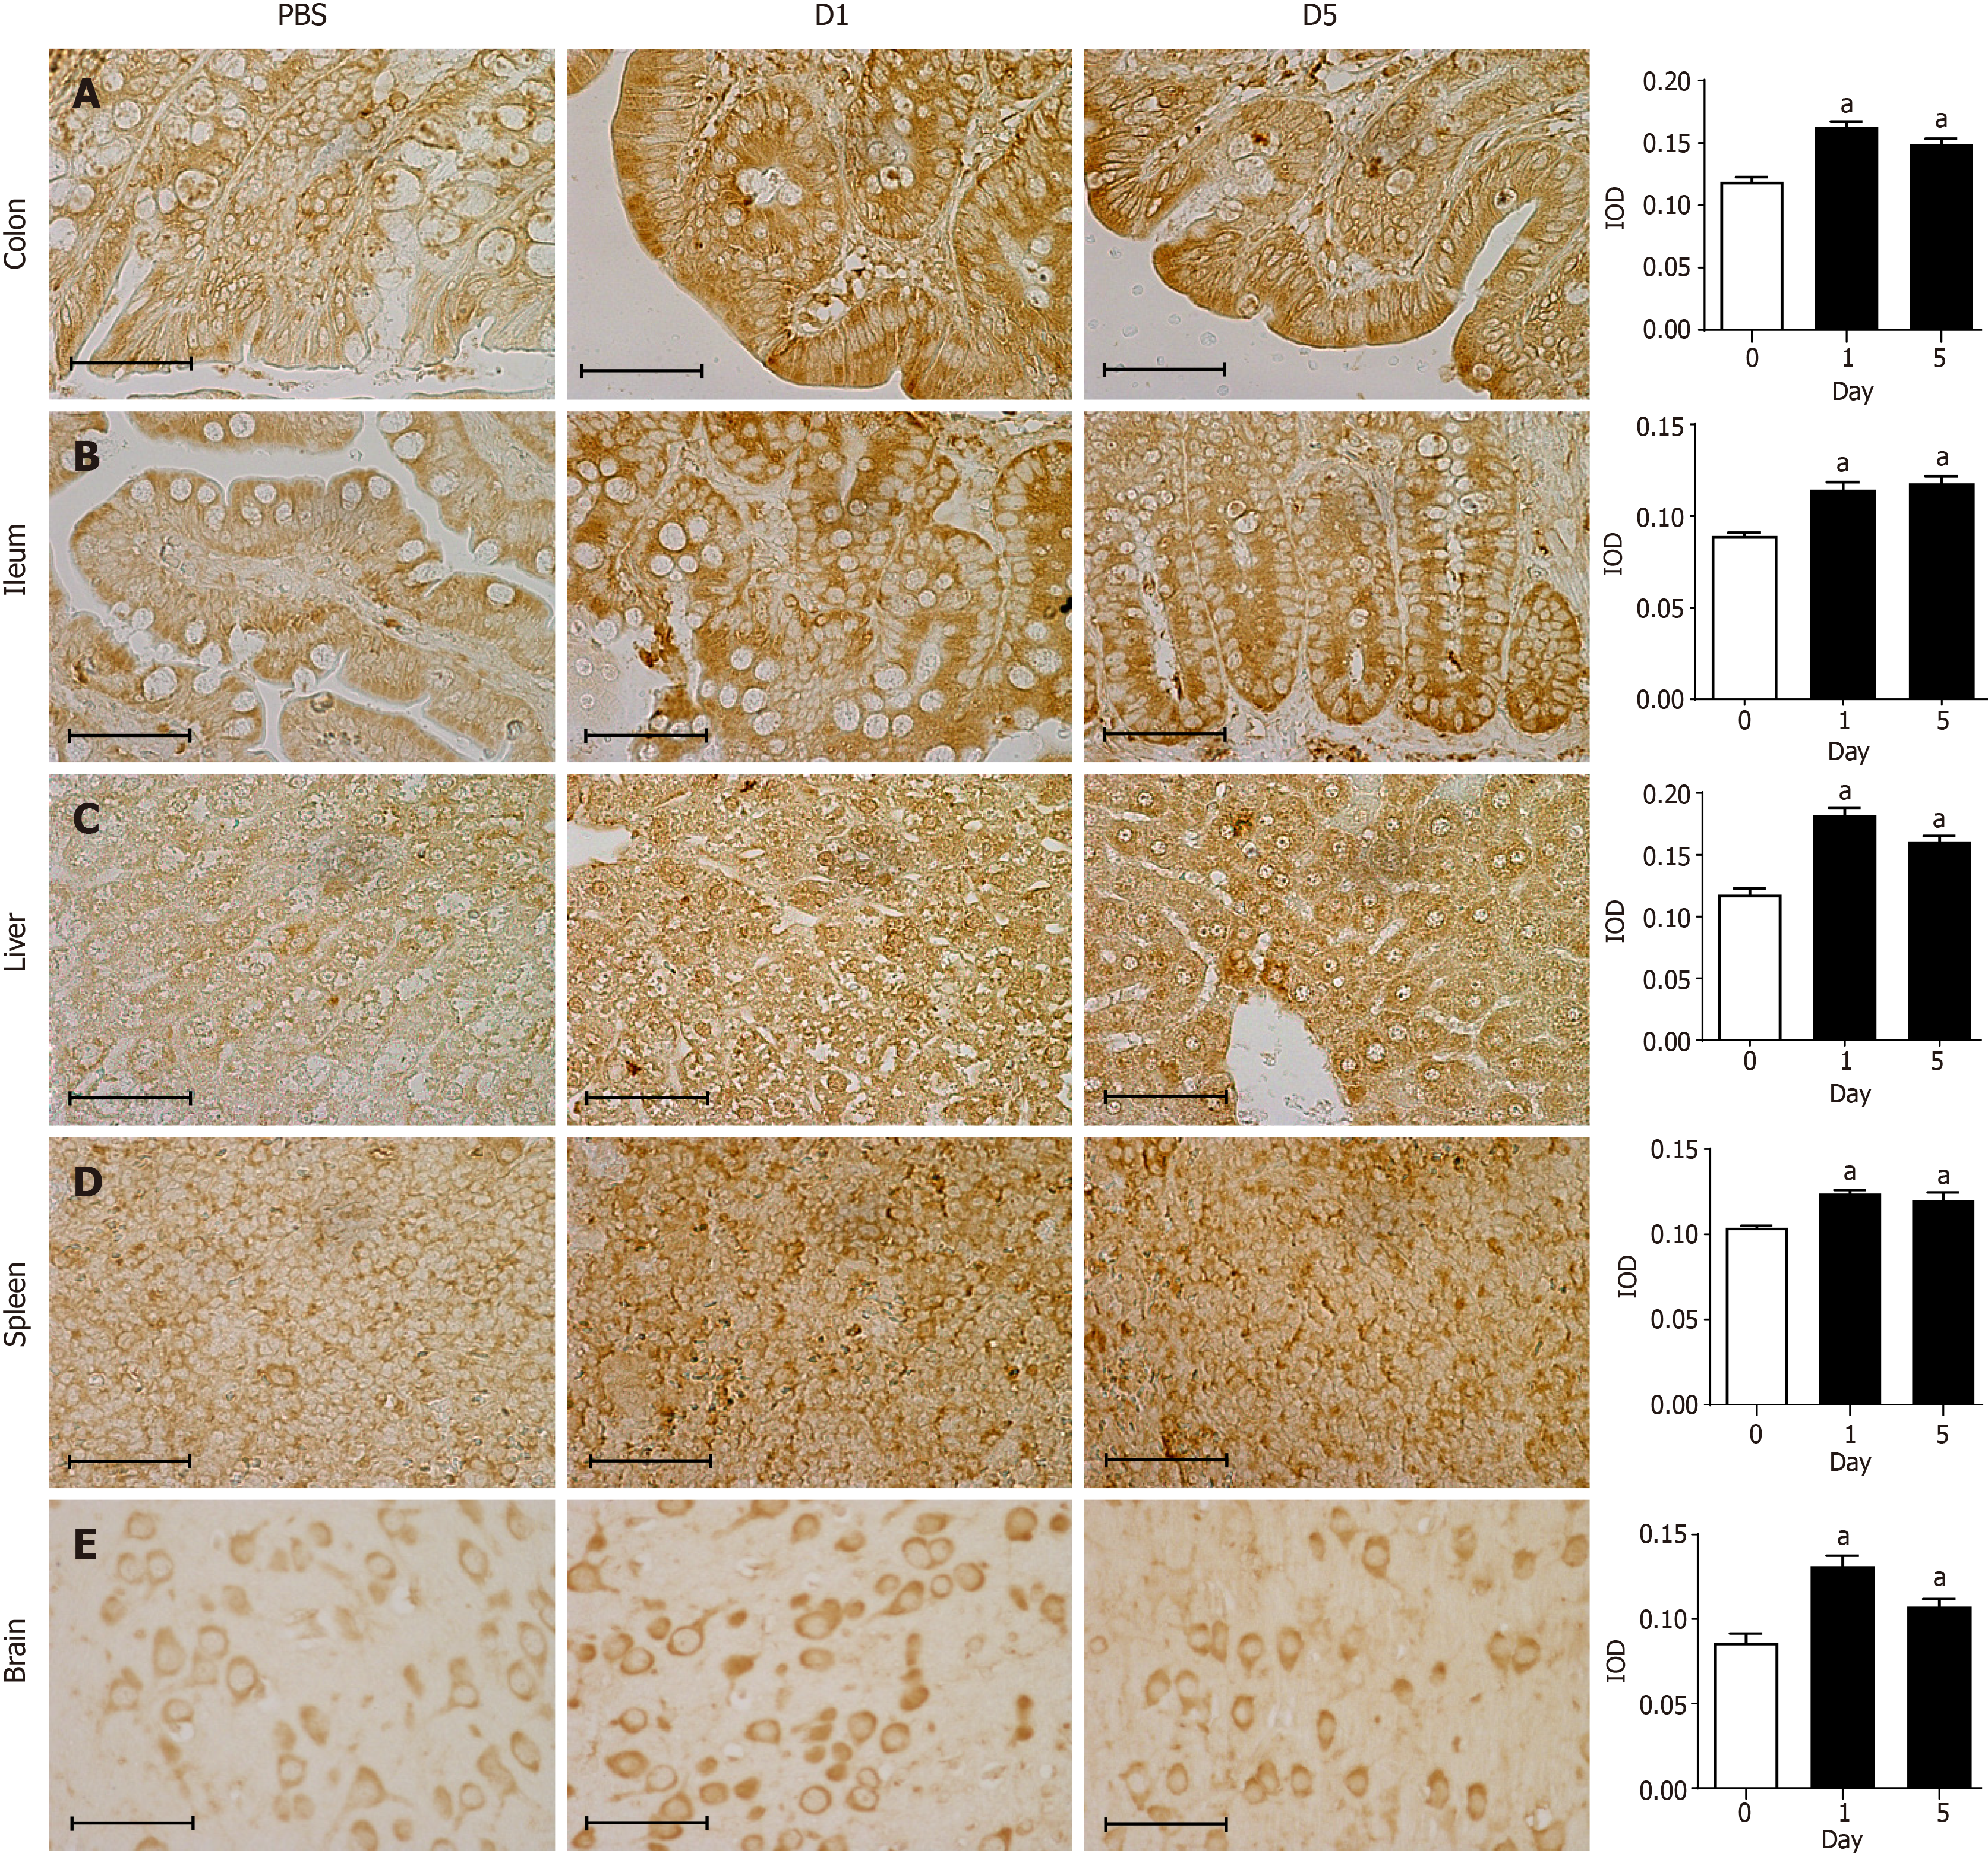
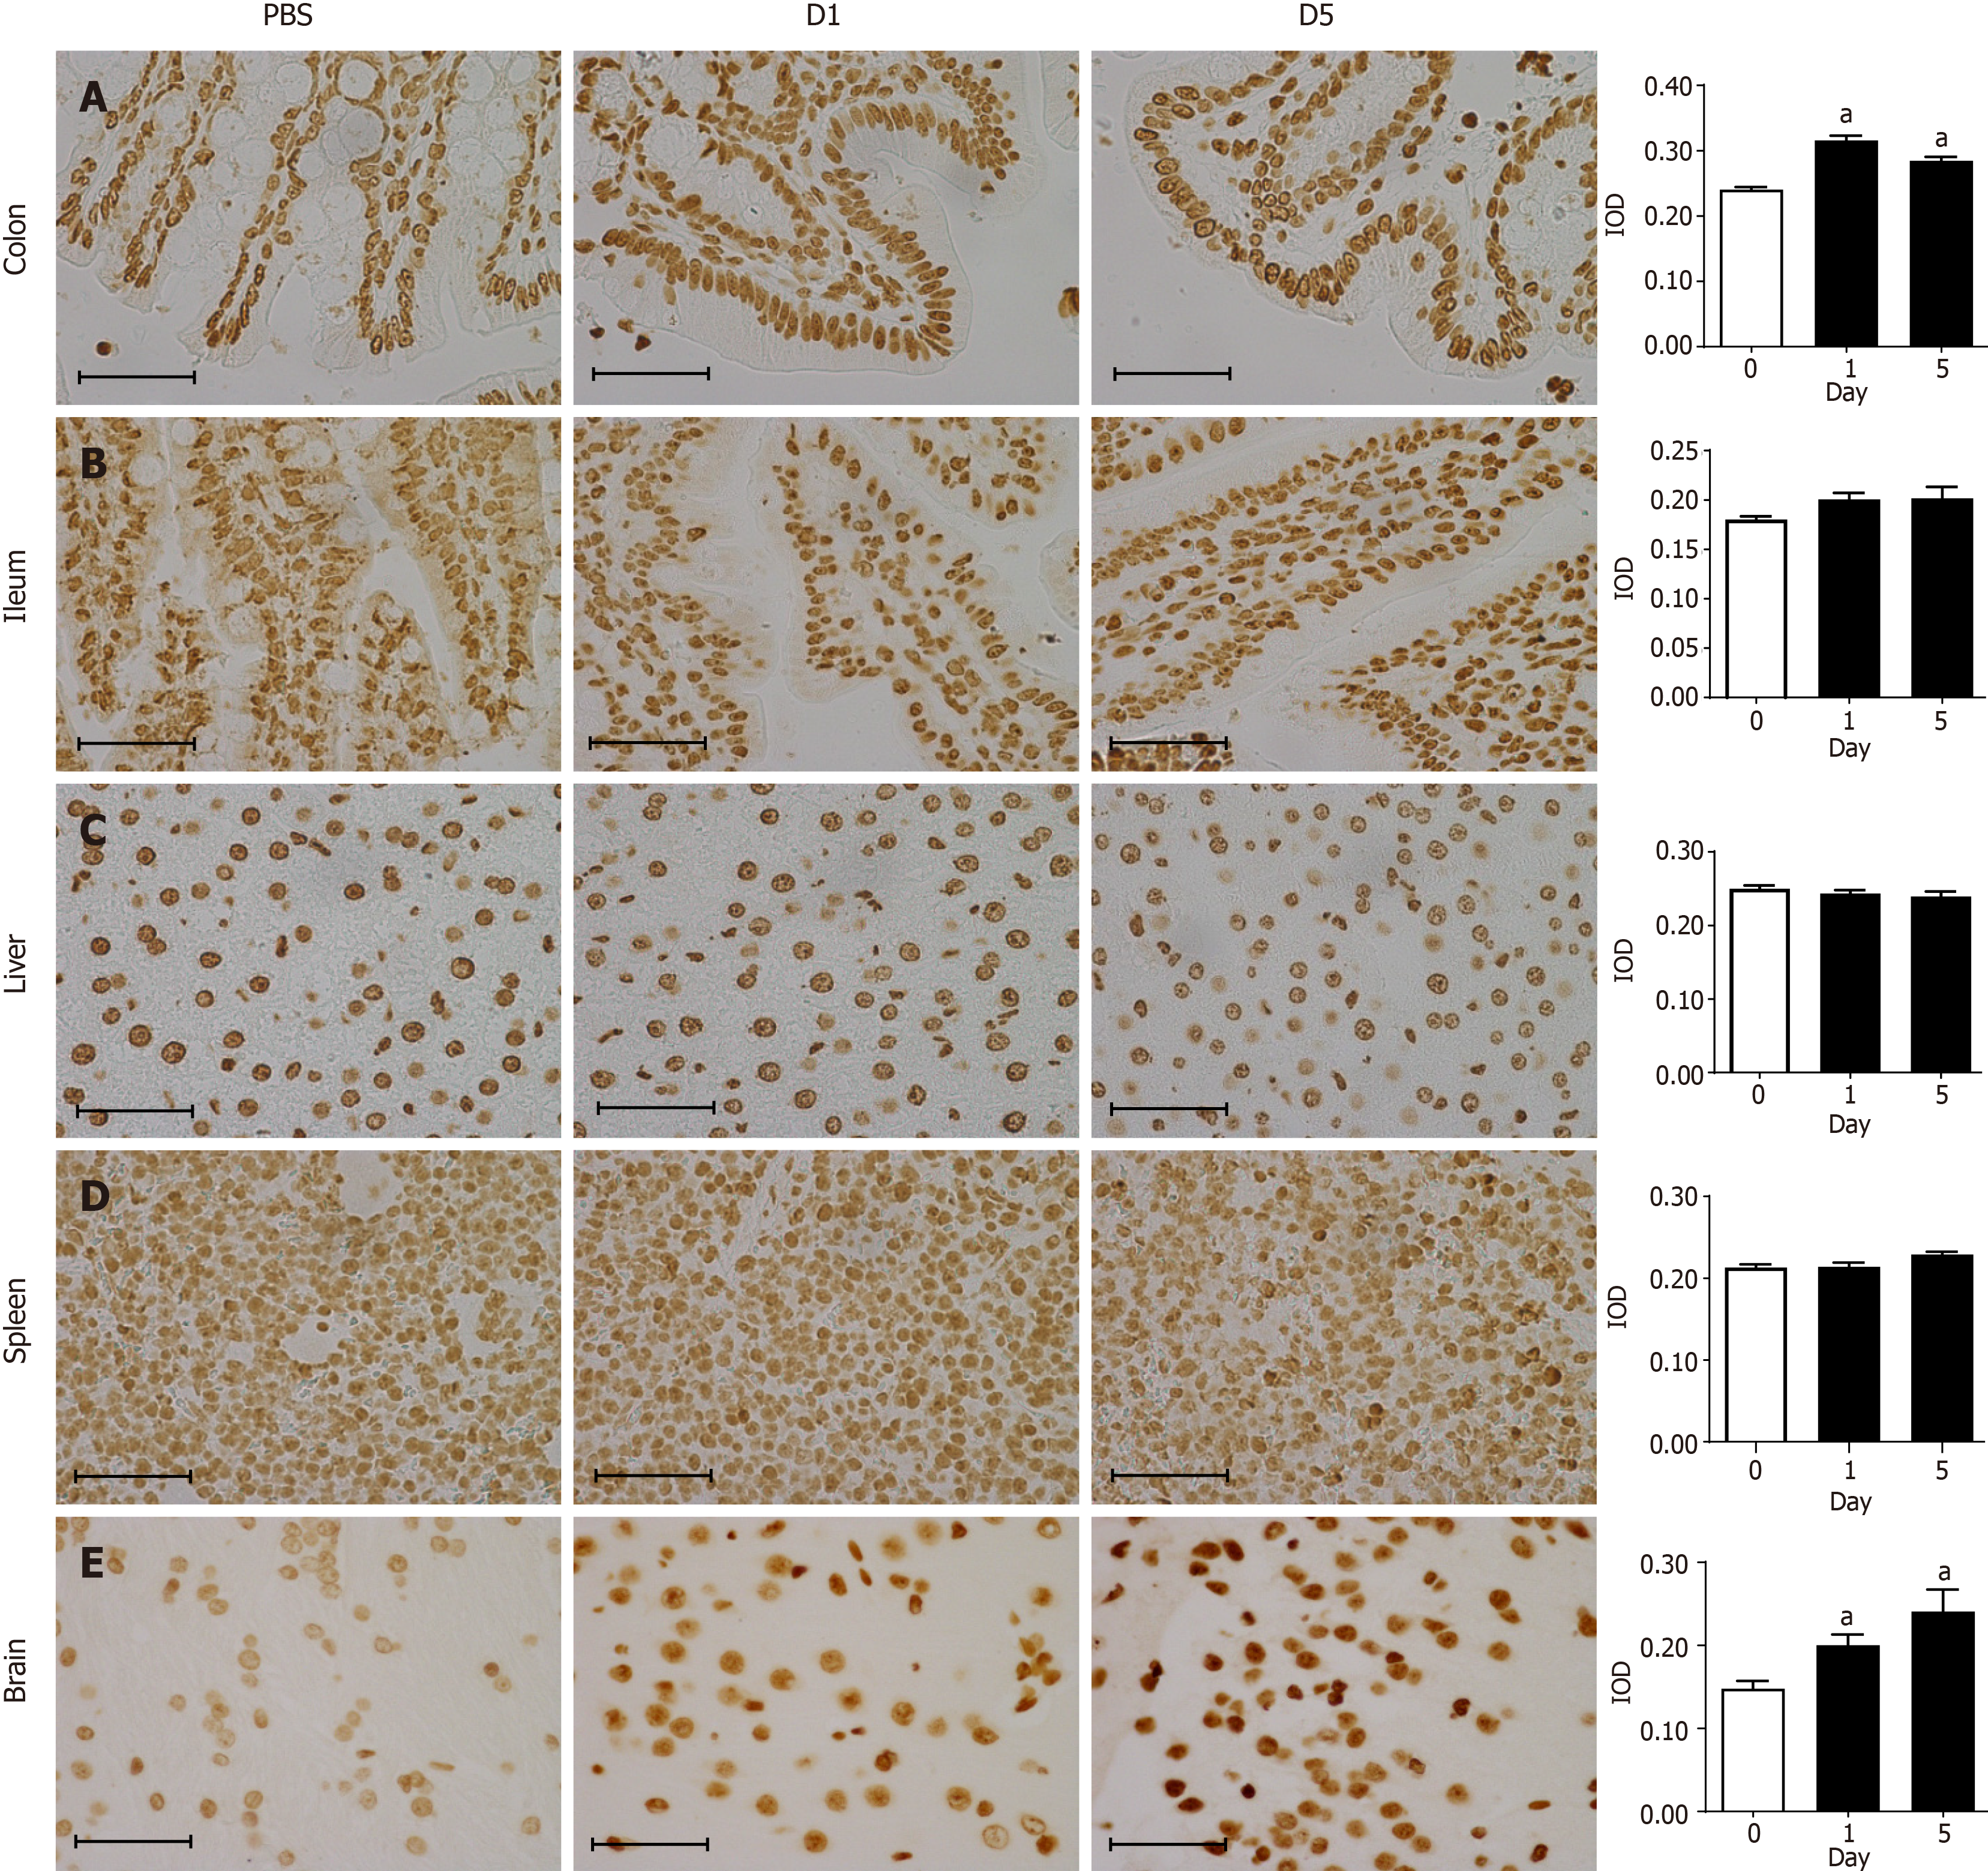
Figure 4 Immunohistochemical staining for 8-oxo-7,8-dihydroguanosine in tissues.
A: Representative images showing immunohistochemical staining (400 × magnification) of 8-oxo-7,8-dihydroguanosine (8-oxo-Gsn) in paraffin-embedded colon sections from rats. Left panel images (PBS) indicate the results of the control group. Middle panel images (D1) indicate the results one day after Shigella flexneri (S. flexneri) infection. Right panel images (D5) indicate the results five days after S. flexneri infection; B: Immunohistochemical staining for 8-oxo-Gsn in ileum sections; C: Immunohistochemical staining for 8-oxo-Gsn in liver sections; D: Immunohistochemical staining for 8-oxo-Gsn in spleen sections; E: Immunohistochemical staining for 8-oxo-Gsn in brain sections. Histogram: The quantitative analysis of immunohistochemical staining of 8-oxo-Gsn in tissues of the infection and control groups. Scale bar, 50 μm. aP < 0.05. The immunohistochemical images were analyzed using the Image Pro-Plus (IPP) software. The integrated optical density (IOD) is a representative parameter for assessing the immunostaining quantification in the IPP analyses, and it indicates the total amount of staining material in that area. IOD: Integrated optical density.
Figure 5 Immunohistochemical staining for 8-oxo-7,8-dihydro-2-deoxyguanosine in tissues.
A: Representative images showing immuno
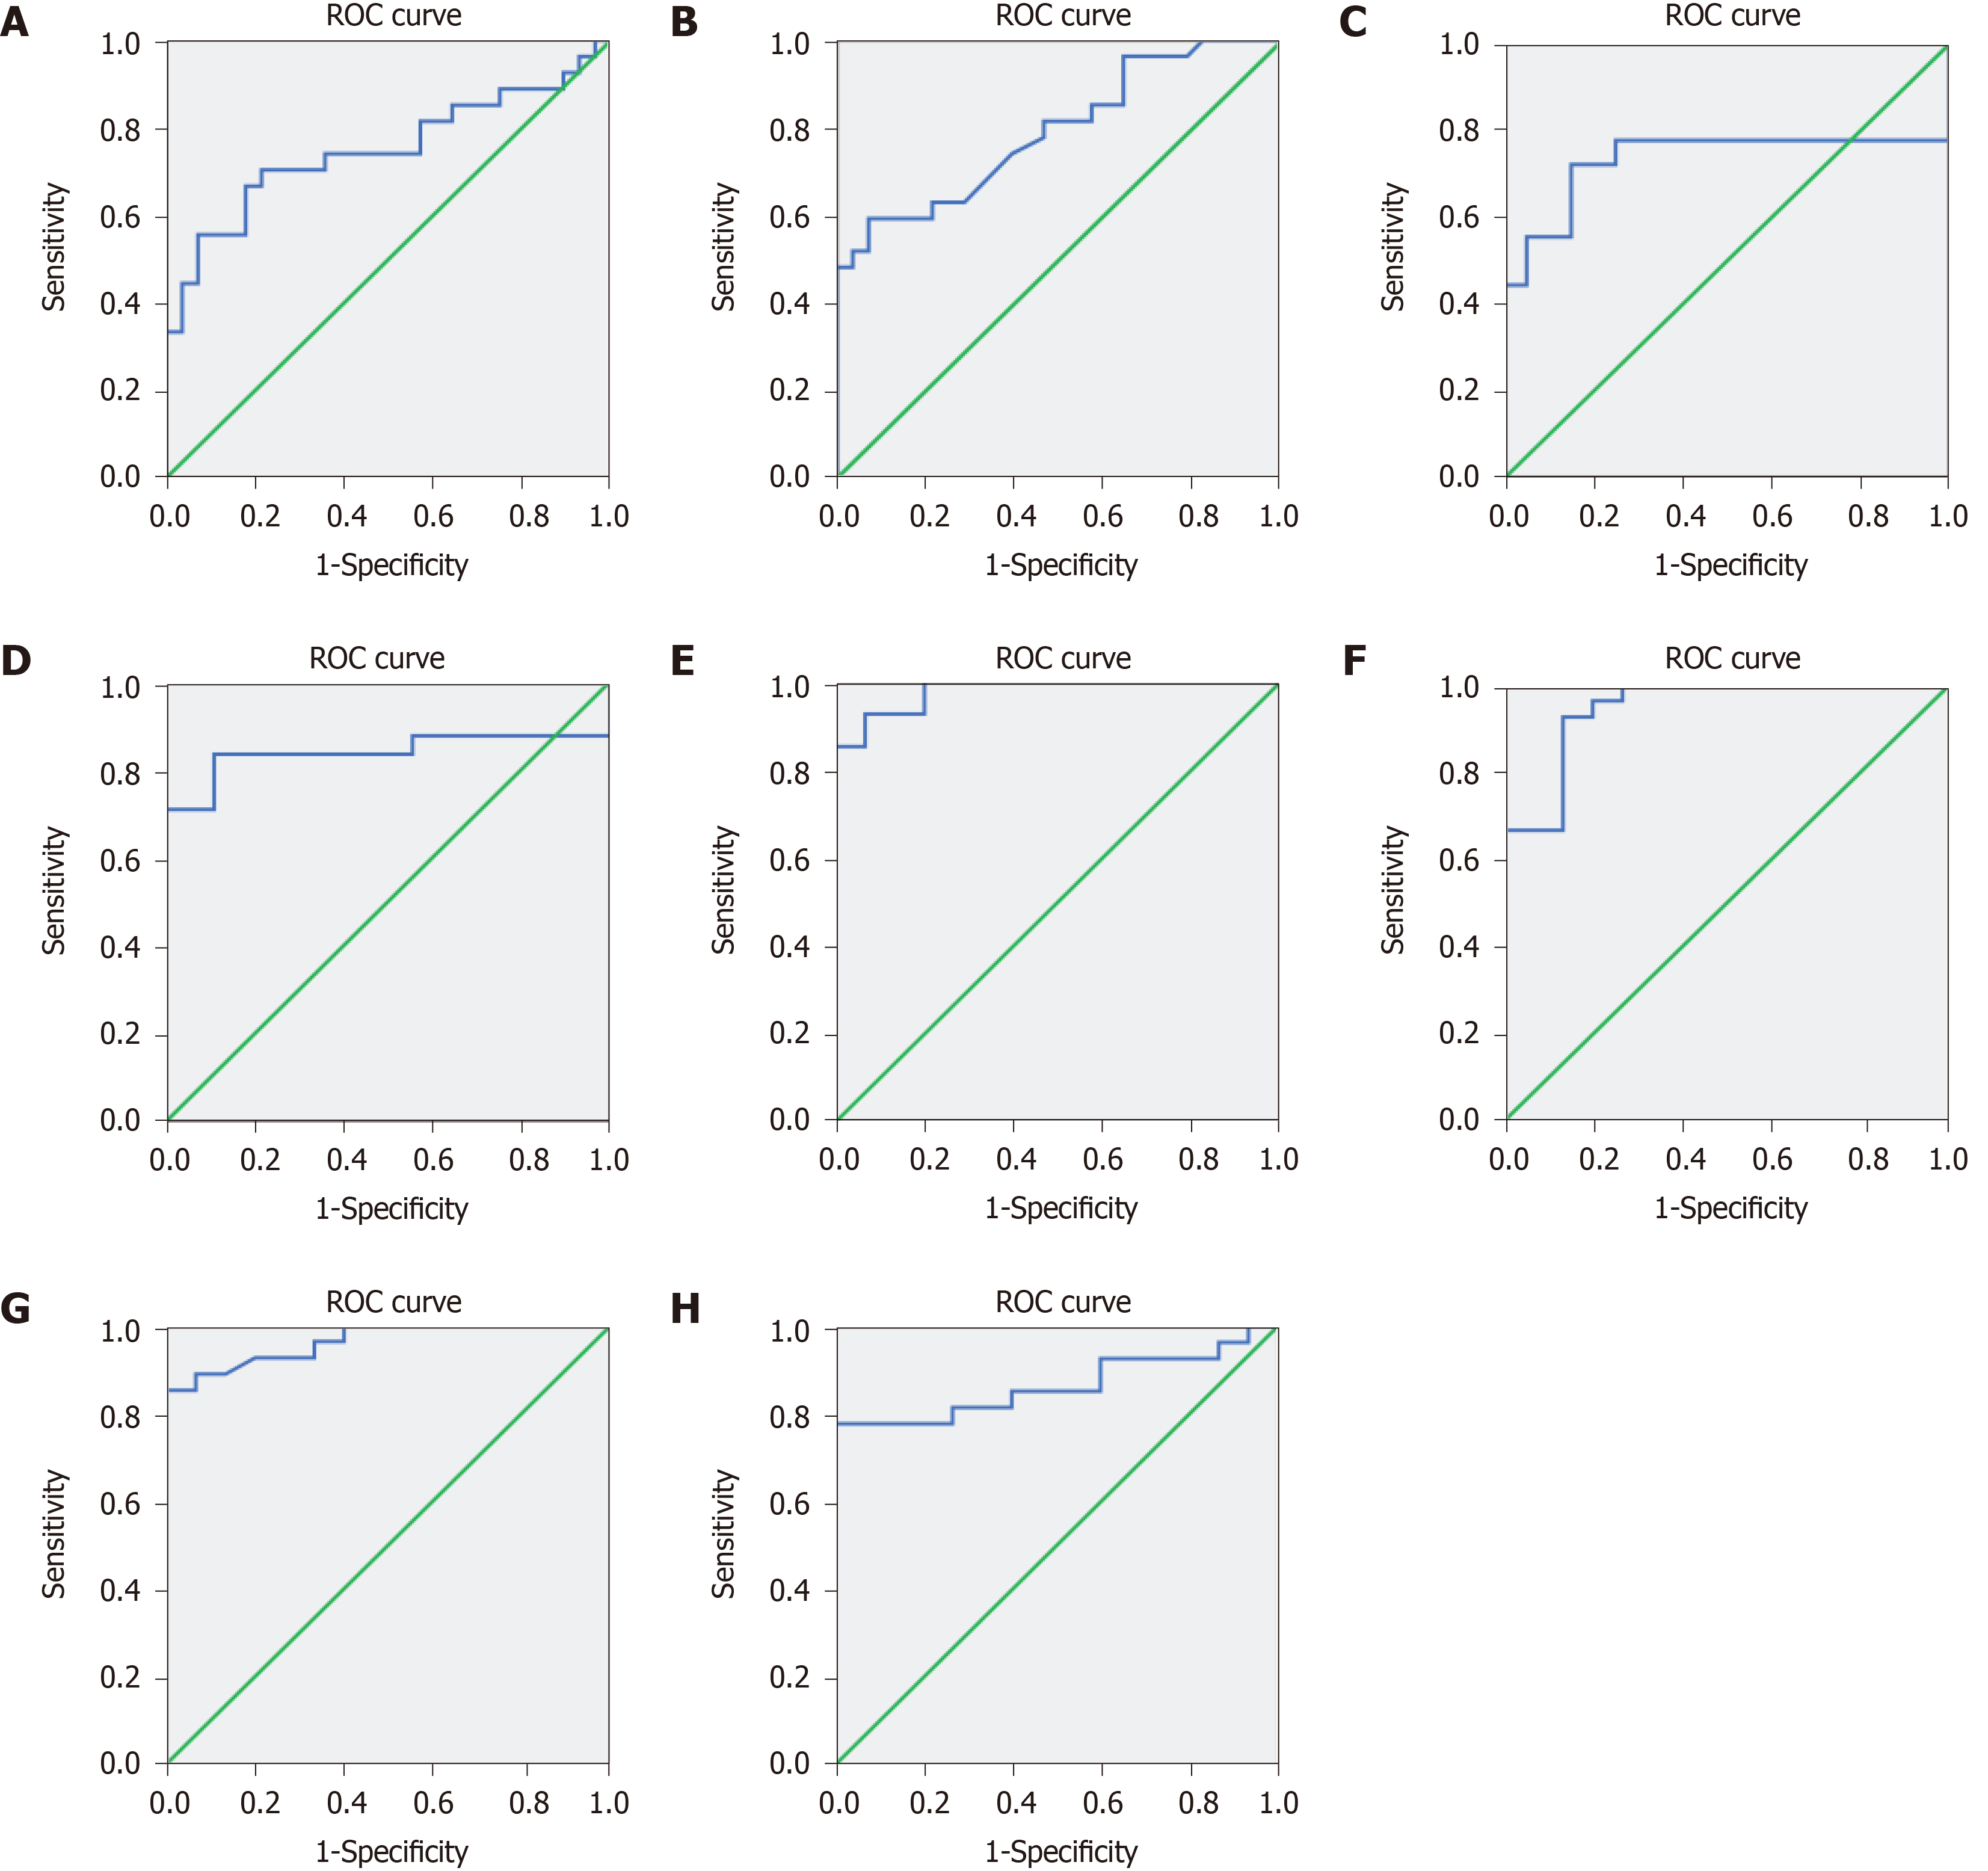
Figure 6 Receiver operator characteristic curves of 8-oxo-7,8-dihydroguanosine, white blood cell count, C-reactive protein, interleukin-6, tumor necrosis factor α, interleukin-1β, interleukin-17α, and interleukin-10 for assessing the infection status.
A: Receiver operator characteristic (ROC) curve of urinary 8-oxo-7,8-dihydroguanosine; B: ROC curve of white blood cell count; C: ROC curve of C-reactive protein; D: ROC curve of interleukin (IL)-6; E: ROC curve of tumor necrosis factor α; F: ROC curve of IL-1β; G: ROC curve of IL-17α; H: ROC curve of IL-10. ROC: Receiver operator characteristic.
- Citation: Nie JJ, Pian YY, Hu JH, Fan GQ, Zeng LT, Ouyang QG, Gao ZX, Liu Z, Wang CC, Liu Q, Cai JP. Increased systemic RNA oxidative damage and diagnostic value of RNA oxidative metabolites during Shigella flexneri-induced intestinal infection. World J Gastroenterol 2021; 27(37): 6248-6261
- URL: https://www.wjgnet.com/1007-9327/full/v27/i37/6248.htm
- DOI: https://dx.doi.org/10.3748/wjg.v27.i37.6248


