Copyright
©The Author(s) 2021.
World J Gastroenterol. Jul 28, 2021; 27(28): 4653-4666
Published online Jul 28, 2021. doi: 10.3748/wjg.v27.i28.4653
Published online Jul 28, 2021. doi: 10.3748/wjg.v27.i28.4653
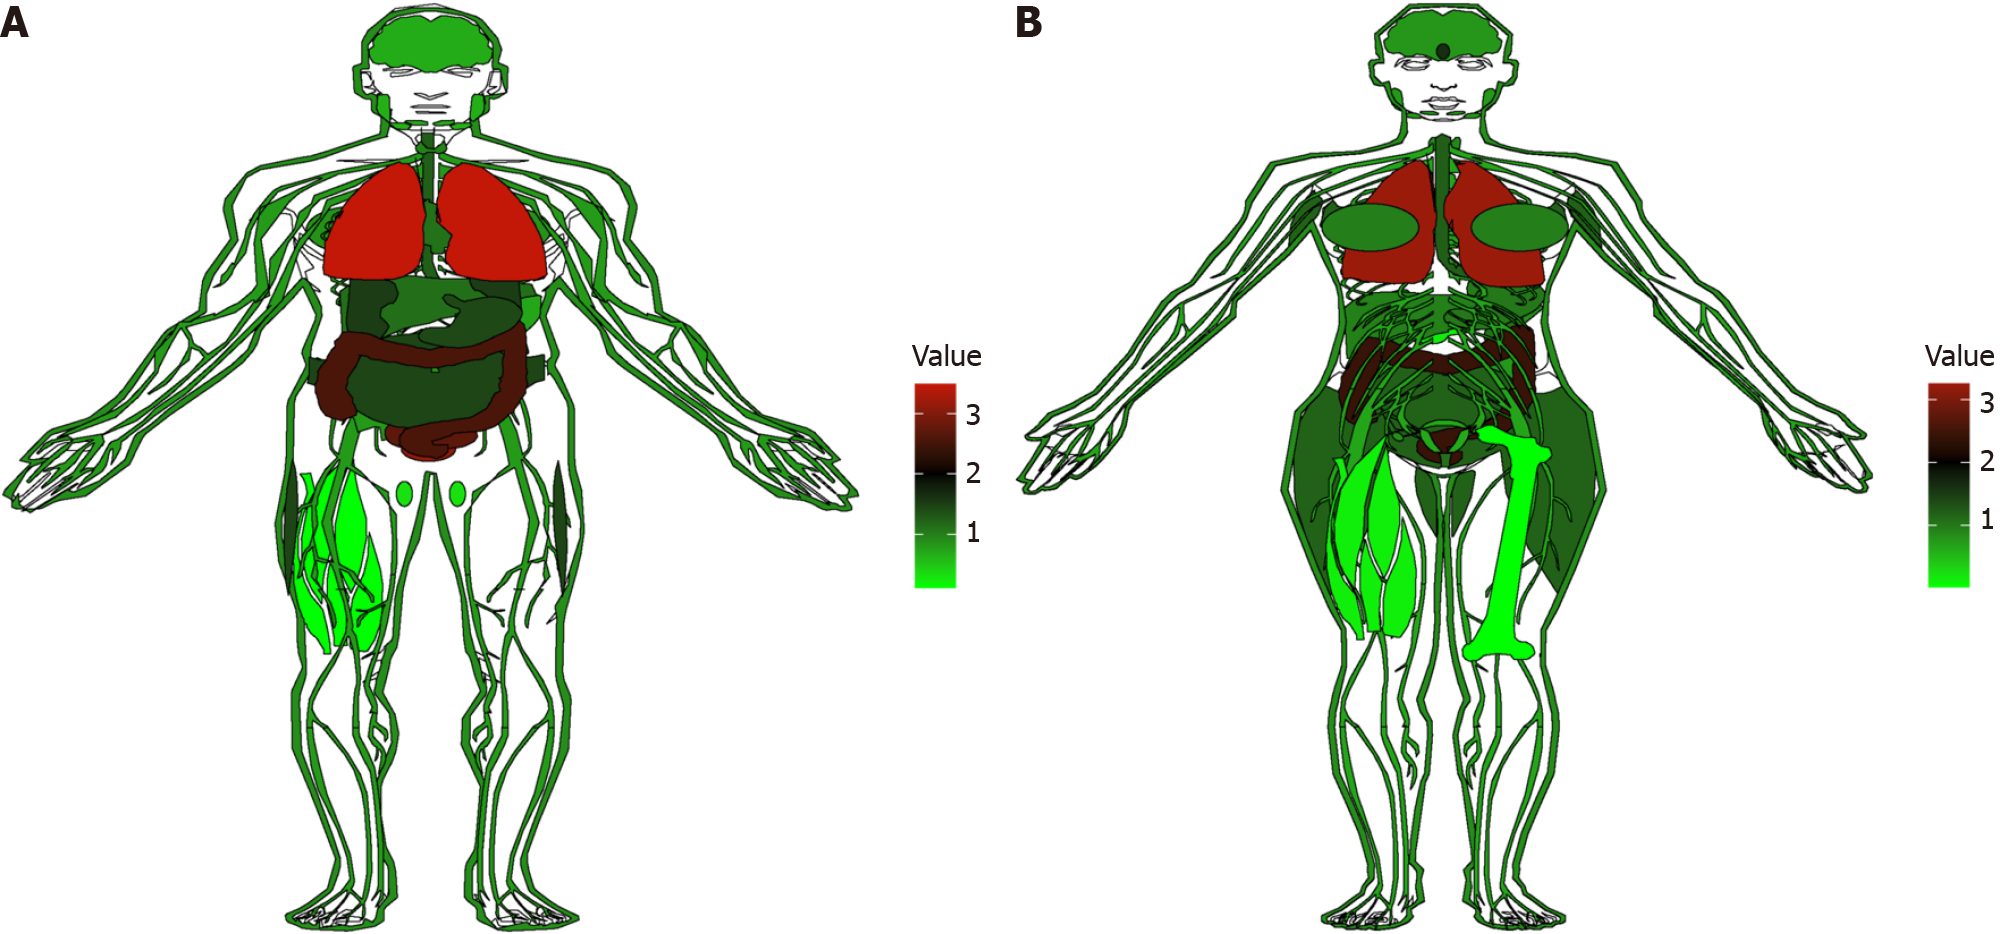
Figure 1 Visualization of cyclooxygenase-2 expression in normal tissues from the genotypic tissue expression database.
The red parts indicate the organs with more cyclooxygenase-2 distribution, while the green parts indicate less distribution. A: Distribution of expression in males; B: Distribution of expression in females.
Figure 2
General location of cyclooxygenase-2 single nucleotide polymorphisms searched by bioinformatics (based on The Cancer Genome Atlas, NCBI, and UCSC).
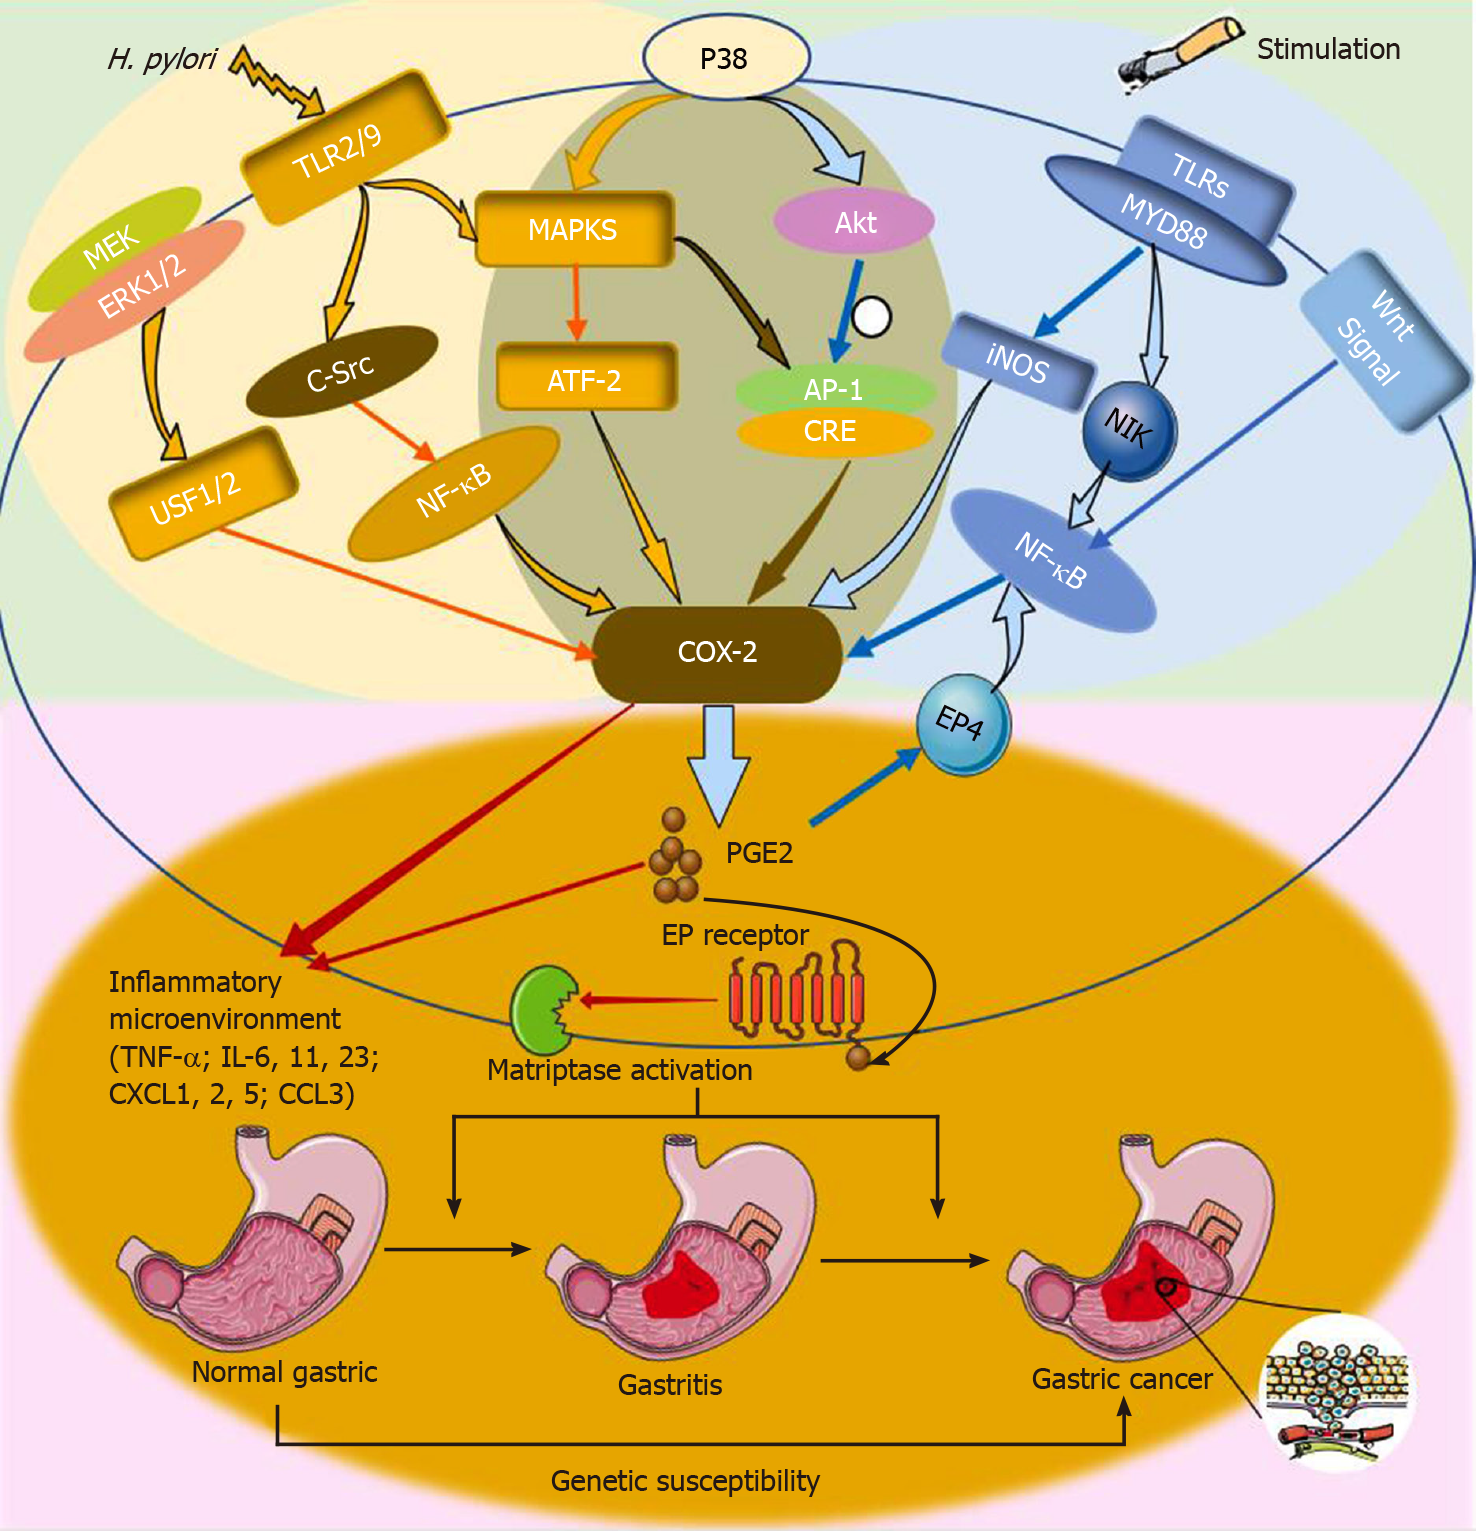
Figure 3 Schematic representation of interactions in regulation of cyclooxygenase-2 to generate an inflammatory microenvironment that has been described in the review.
The active pathway of Helicobacter pylori infection is shown on the right. TLR: Toll-like receptor; NF-κB: Nuclear factor κB; PGE2: Prostaglandin E2; EP4: Prostaglandin E receptor subtype 4; C-Src: Cellular src; Akt: Protein kinase B; AP-1: Activator protein 1; MEK1: MAP kinase kinase 1; USF: Upstream stimulatory factor; NIK: Mitogen-activated protein kinase kinase kinase 14; Inos: Inducible nitric oxide synthase; MAPK: Mitogen-activated protein kinase; ATF-2: Activating transcription factor 2; TNF-α: tumor necrosis factor-α; IL: Interleukin; CXCL: Chemokine (CXC motif) ligand; CCL: Chemokine (C-C motif) ligand; COX-2: Cyclooxygenase-2.
- Citation: Ji XK, Madhurapantula SV, He G, Wang KY, Song CH, Zhang JY, Wang KJ. Genetic variant of cyclooxygenase-2 in gastric cancer: More inflammation and susceptibility. World J Gastroenterol 2021; 27(28): 4653-4666
- URL: https://www.wjgnet.com/1007-9327/full/v27/i28/4653.htm
- DOI: https://dx.doi.org/10.3748/wjg.v27.i28.4653


