Copyright
©The Author(s) 2021.
World J Gastroenterol. Jun 28, 2021; 27(24): 3630-3642
Published online Jun 28, 2021. doi: 10.3748/wjg.v27.i24.3630
Published online Jun 28, 2021. doi: 10.3748/wjg.v27.i24.3630
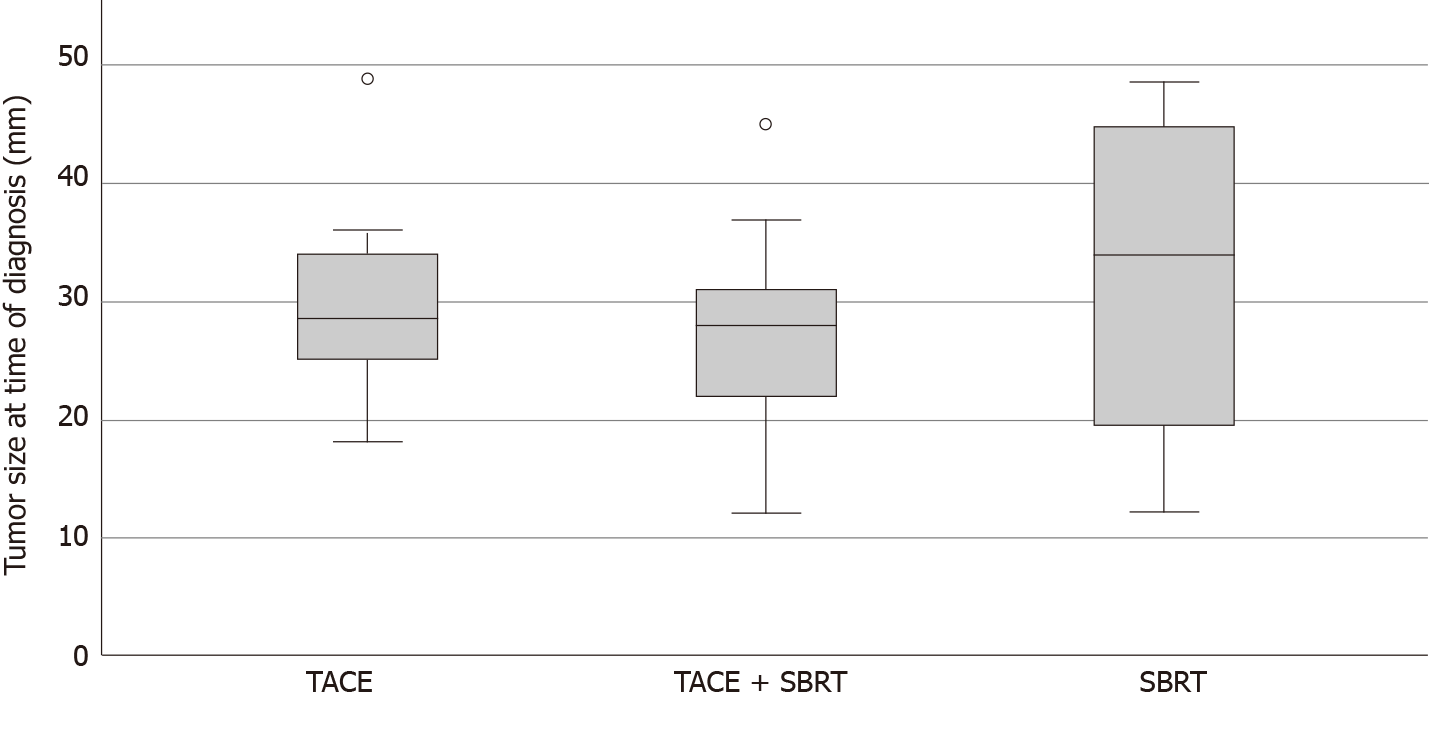
Figure 1 Box plot showing tumor size in each treatment group.
Median is represented by bars, 25%-75% percentiles by boxes and outliers by markers. There were no statistically significant differences between groups. TACE: Transarterial chemoembolization; SBRT: Stereotactic body radiation therapy.
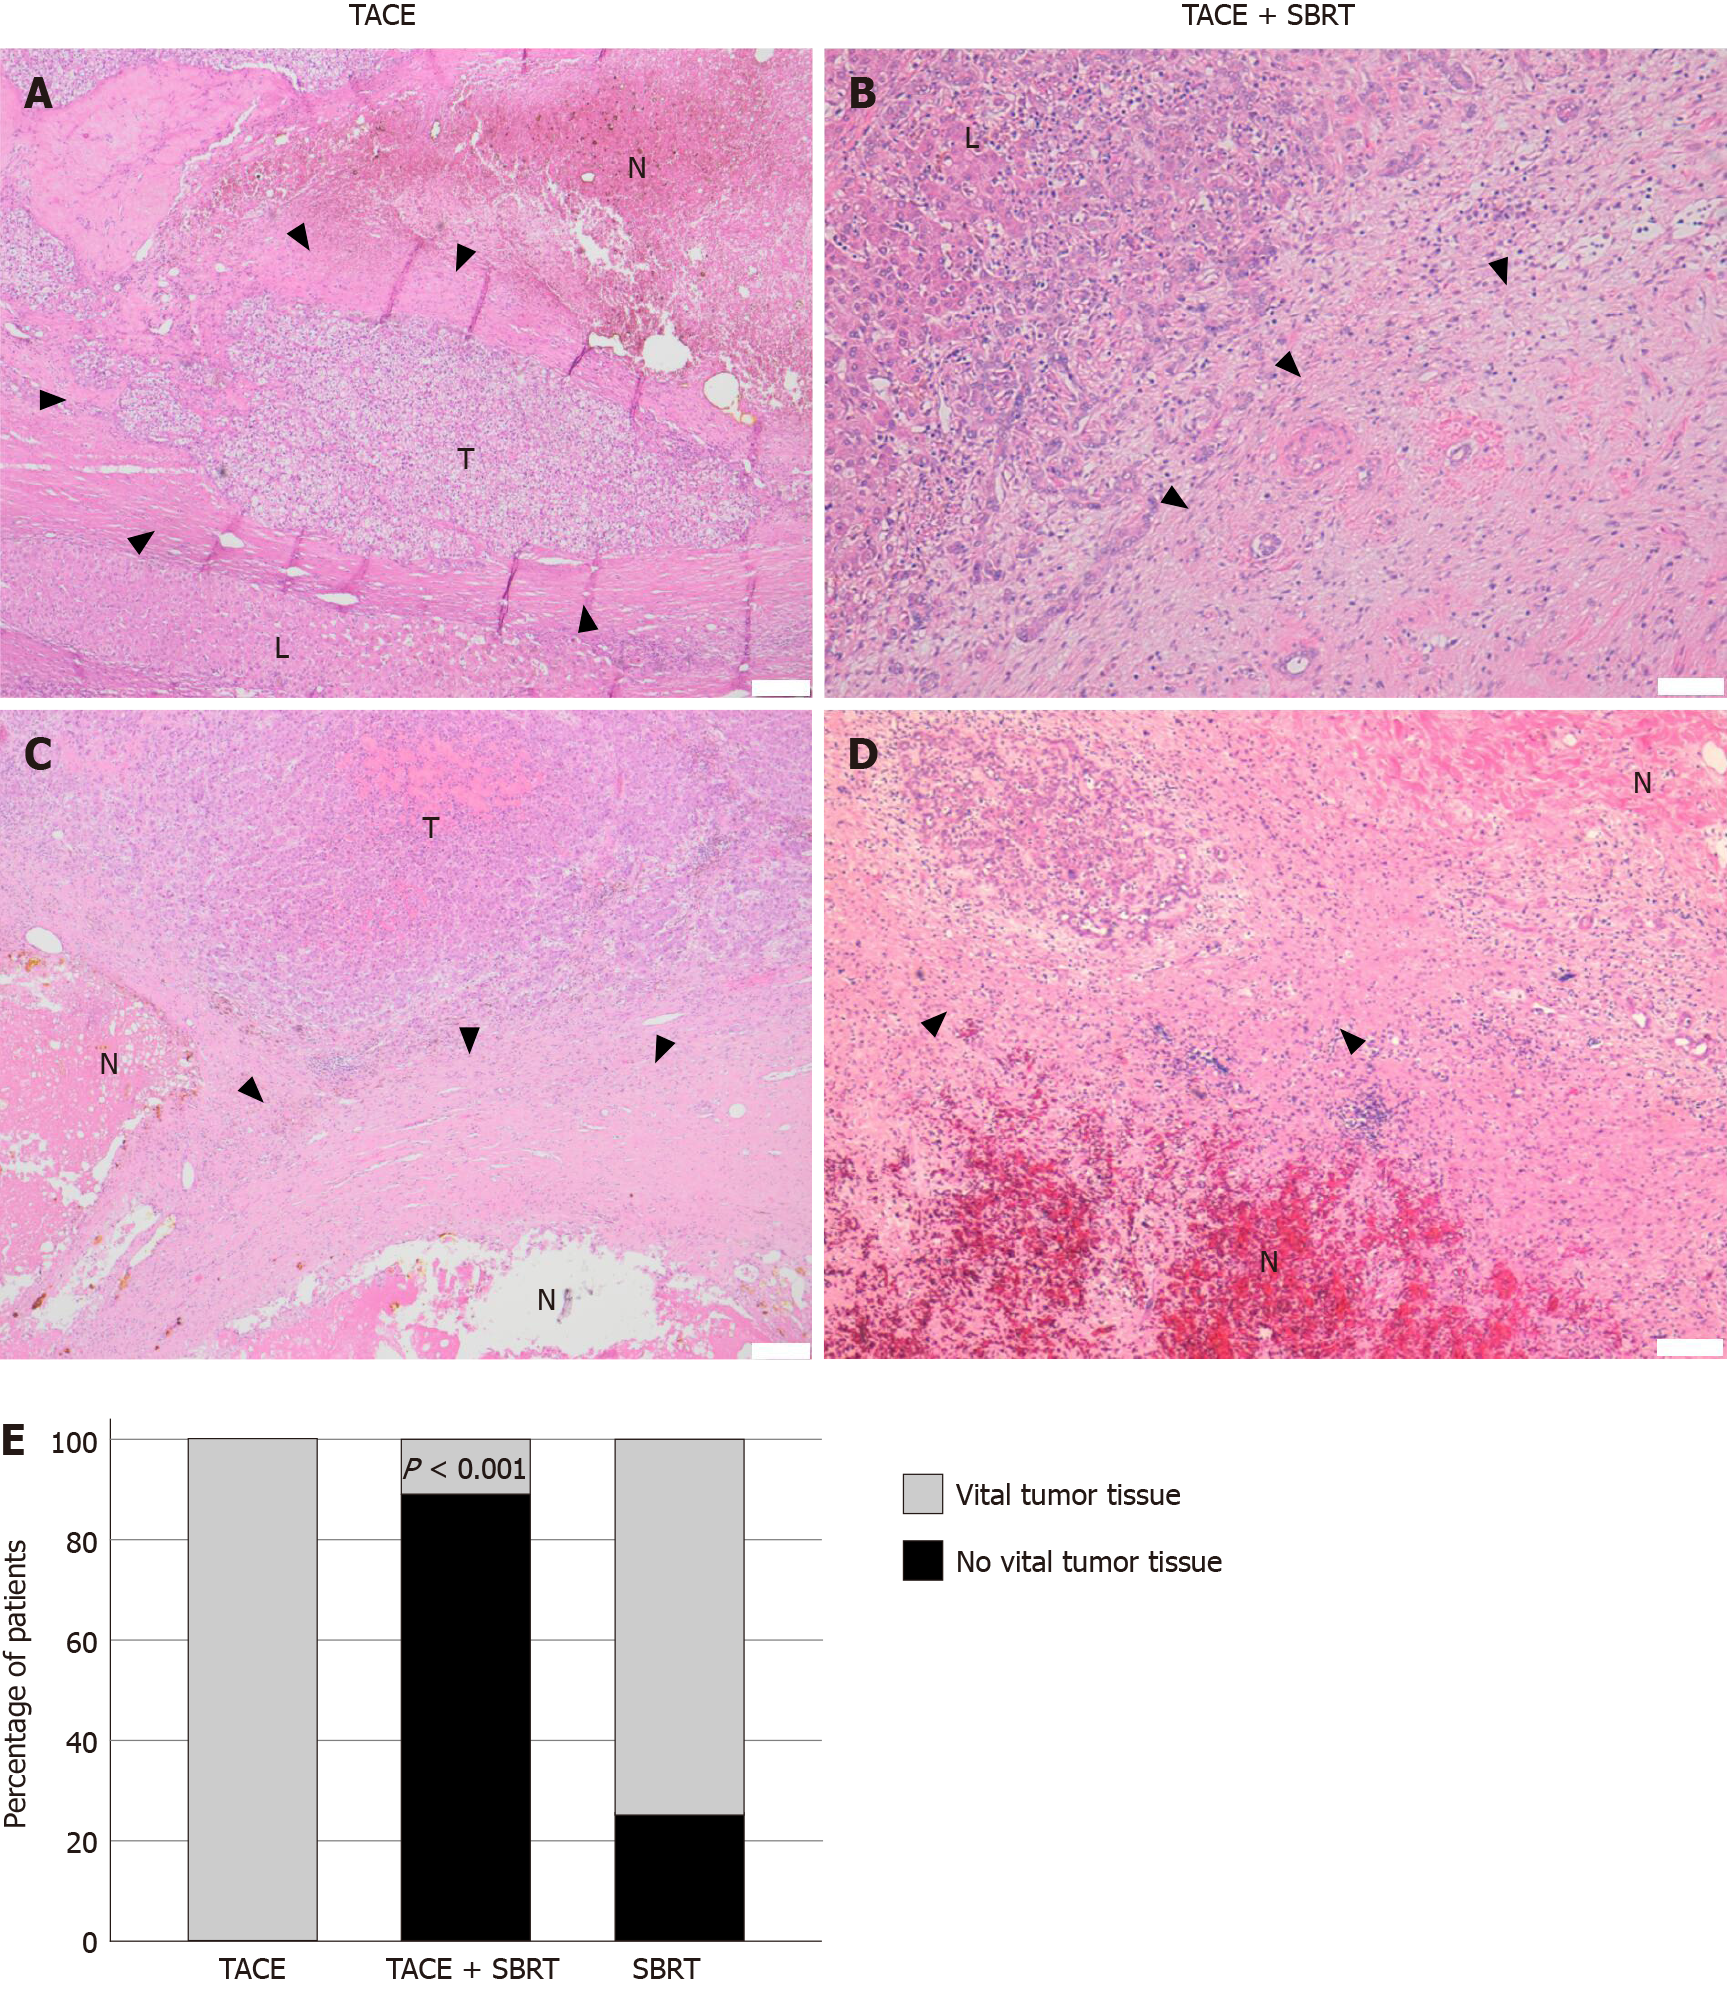
Figure 2 Tumor response by histopathology for each treatment group.
A-D: Representative histopathology (Hematoxylin and eosin stain) of tumor lesions in explant livers after transarterial chemoembolization (TACE) (A, C; scale bar 200 µm) or TACE + stereotactic body radiation therapy (SBRT) (B, D; scale bar 100 µm). Samples show necrosis with granulation tissue and organization by connective tissue at the border area (arrowheads) to normal liver. Residual tumor tissue was observed in TACE only samples, while no vital tumor cells could be detected in most patients in the TACE + SBRT group (B, D); E: Bar graph displaying the proportion of vital tumor tissue in each treatment group. Combination therapy with TACE and SBRT leads to a statistically significantly lower number of residual tumor tissue in explant livers (P < 0.001). TACE: Transarterial chemoembolization; SBRT: Stereotactic body radiation therapy; N: Necrosis; L: Normal liver; T: Tumor tissue.
Figure 3 Tumor size at time of diagnosis and in explant histology for each treatment group.
Tumor size at initial diagnosis was determined by radiology. When more than one tumor was present, the size of the largest tumor was graphed. In cases where no vital tumor tissue was detected, a size of 0 mm was graphed. TACE: Transarterial chemoembolization; SBRT: Stereotactic body radiation therapy.
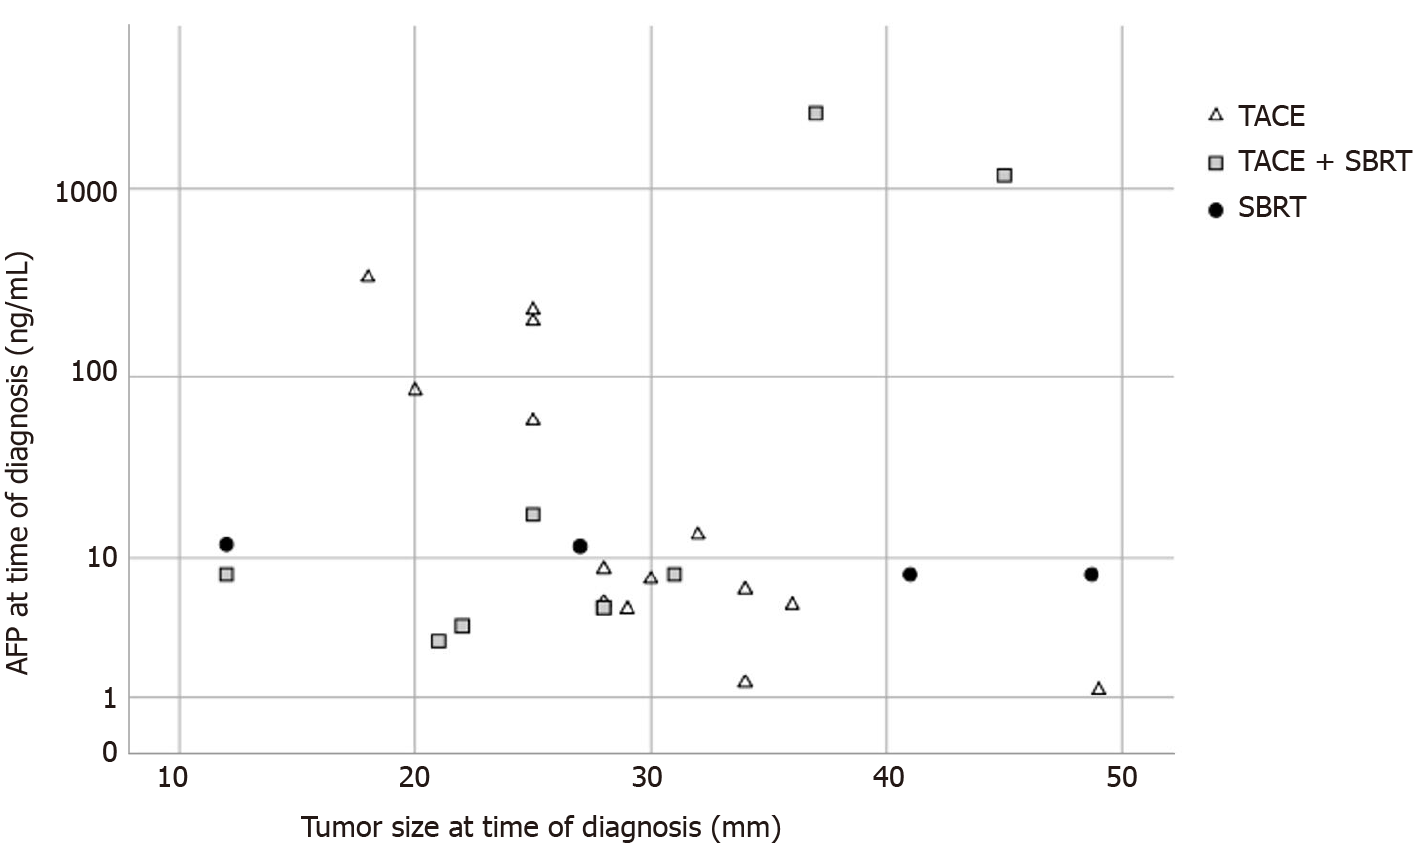
Figure 4 Correlation of alpha-fetoprotein and tumor size for each group.
Scatter chart showing the correlation of alpha-fetoprotein in ng / mL and tumor size in mm for each group. AFP: Alpha-fetoprotein; TACE: Transarterial chemoembolization; SBRT: Stereotactic body radiation therapy.
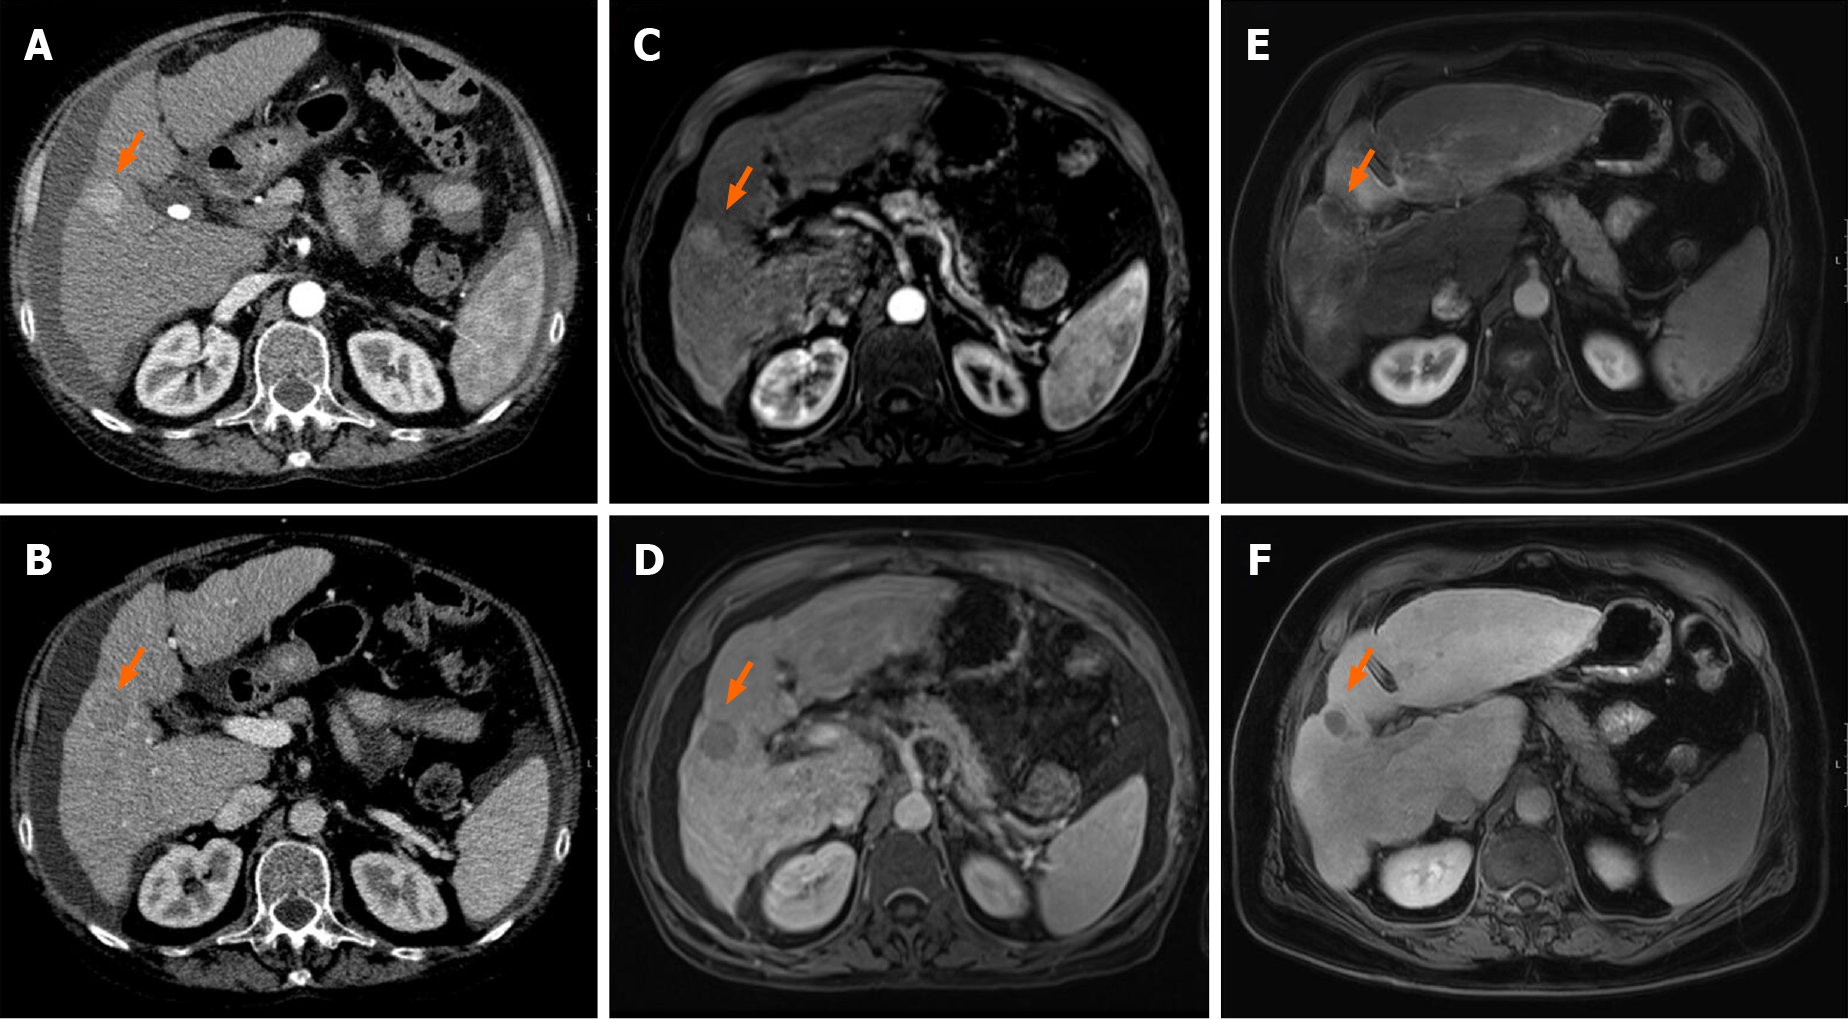
Figure 5 Imaging from before and after combination therapy in one patient in the transarterial chemoembolization + stereotactic body radiation therapy cohort.
A, B: Contrast enhanced computed tomography (CT); C-F: Magnetic resonance imaging (MRI). Contrast enhanced CT and MRI, arterial phase (top row) and portal venous phase (bottom row) cross sectional imaging from before (A–D) and after (E, F) treatment. At baseline CT and MRI, a well-defined nodular lesion with typical contrast agent dynamics is noted in the right liver lobe (Arrows). After treatment, typical radiation induced peri-lesional hyperenhancement and no hepatocellular carcinoma-specific contrast agent uptake is noted.
- Citation: Bauer U, Gerum S, Roeder F, Münch S, Combs SE, Philipp AB, De Toni EN, Kirstein MM, Vogel A, Mogler C, Haller B, Neumann J, Braren RF, Makowski MR, Paprottka P, Guba M, Geisler F, Schmid RM, Umgelter A, Ehmer U. High rate of complete histopathological response in hepatocellular carcinoma patients after combined transarterial chemoembolization and stereotactic body radiation therapy. World J Gastroenterol 2021; 27(24): 3630-3642
- URL: https://www.wjgnet.com/1007-9327/full/v27/i24/3630.htm
- DOI: https://dx.doi.org/10.3748/wjg.v27.i24.3630


