Copyright
©The Author(s) 2021.
World J Gastroenterol. May 28, 2021; 27(20): 2630-2642
Published online May 28, 2021. doi: 10.3748/wjg.v27.i20.2630
Published online May 28, 2021. doi: 10.3748/wjg.v27.i20.2630
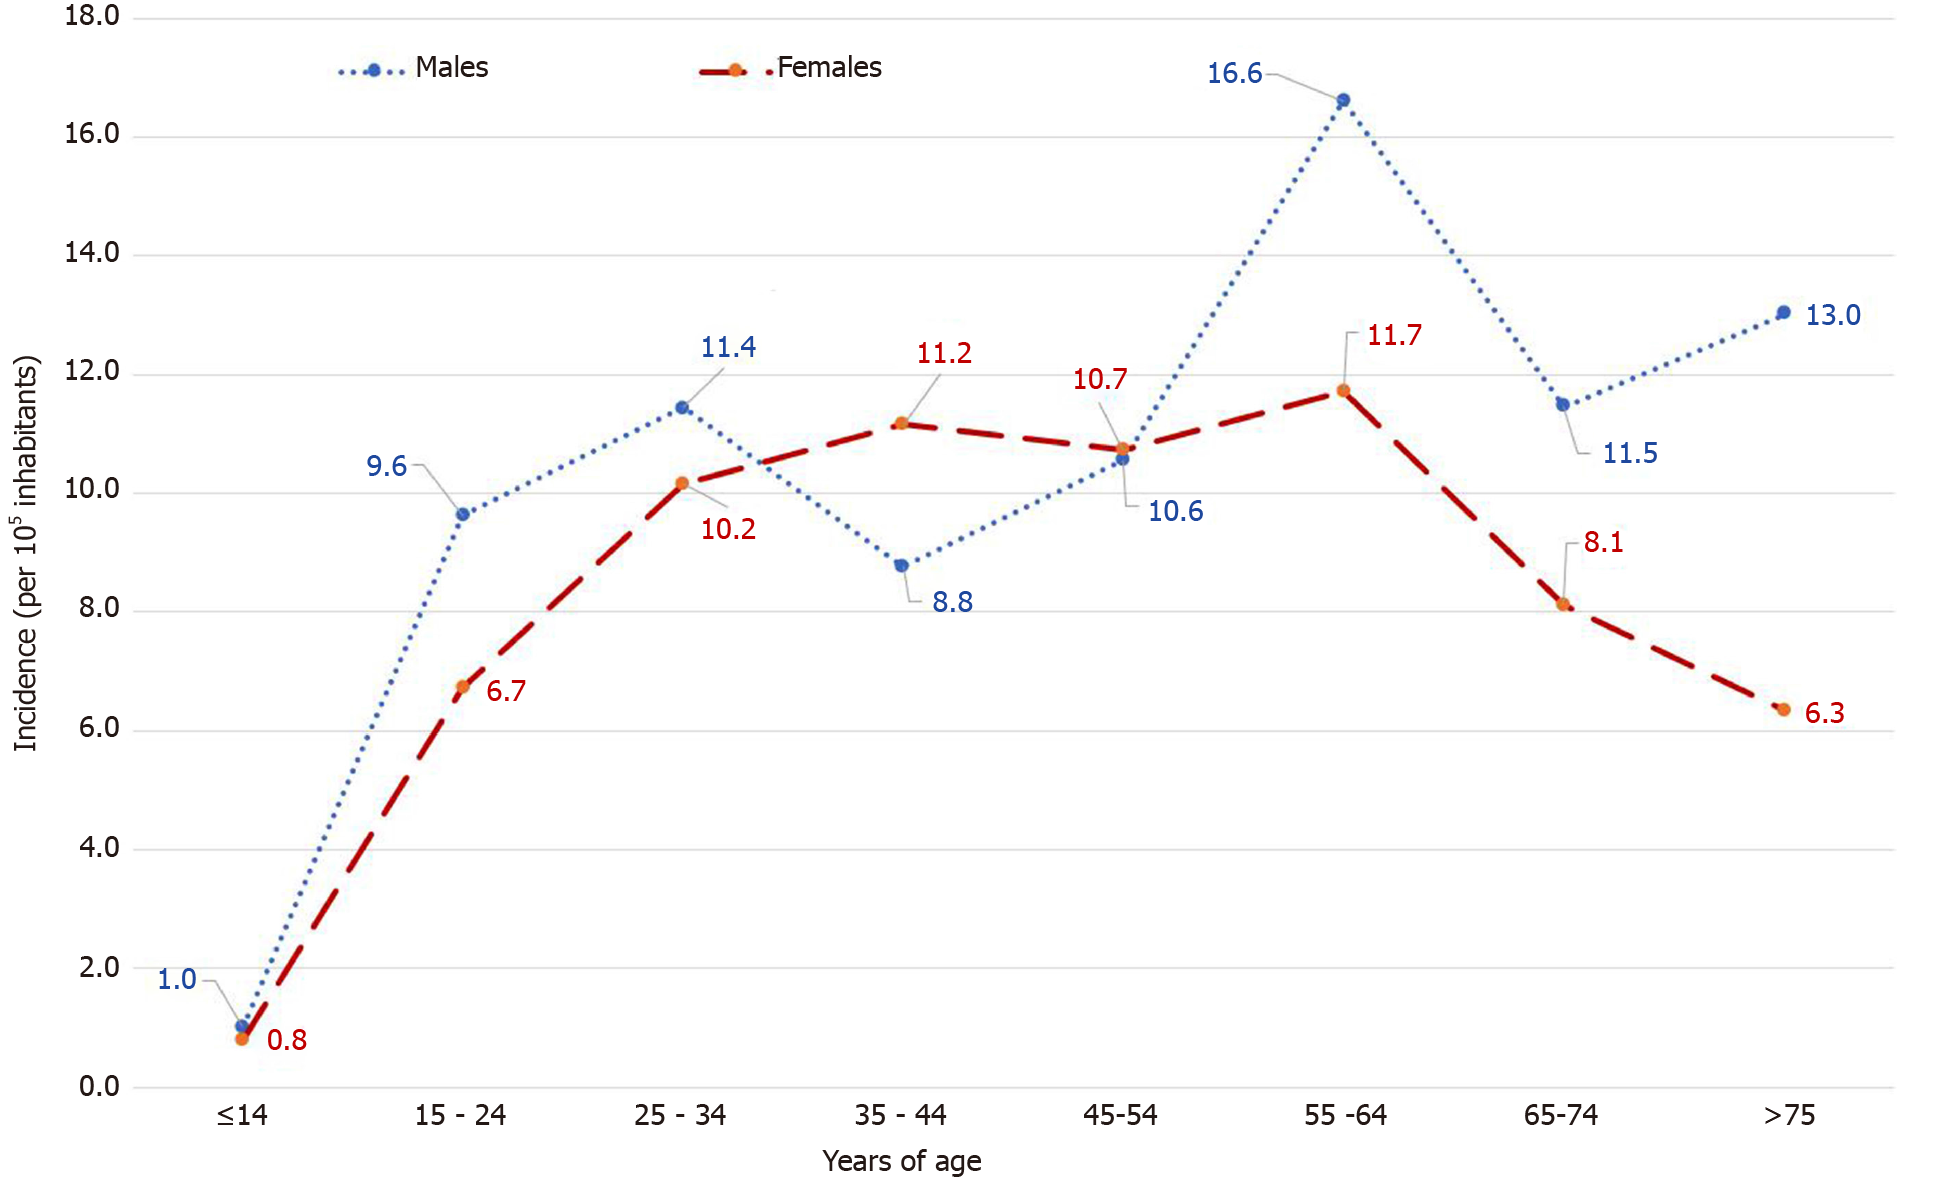
Figure 1
Inflammatory bowel diseases incidence clustered by age and gender.
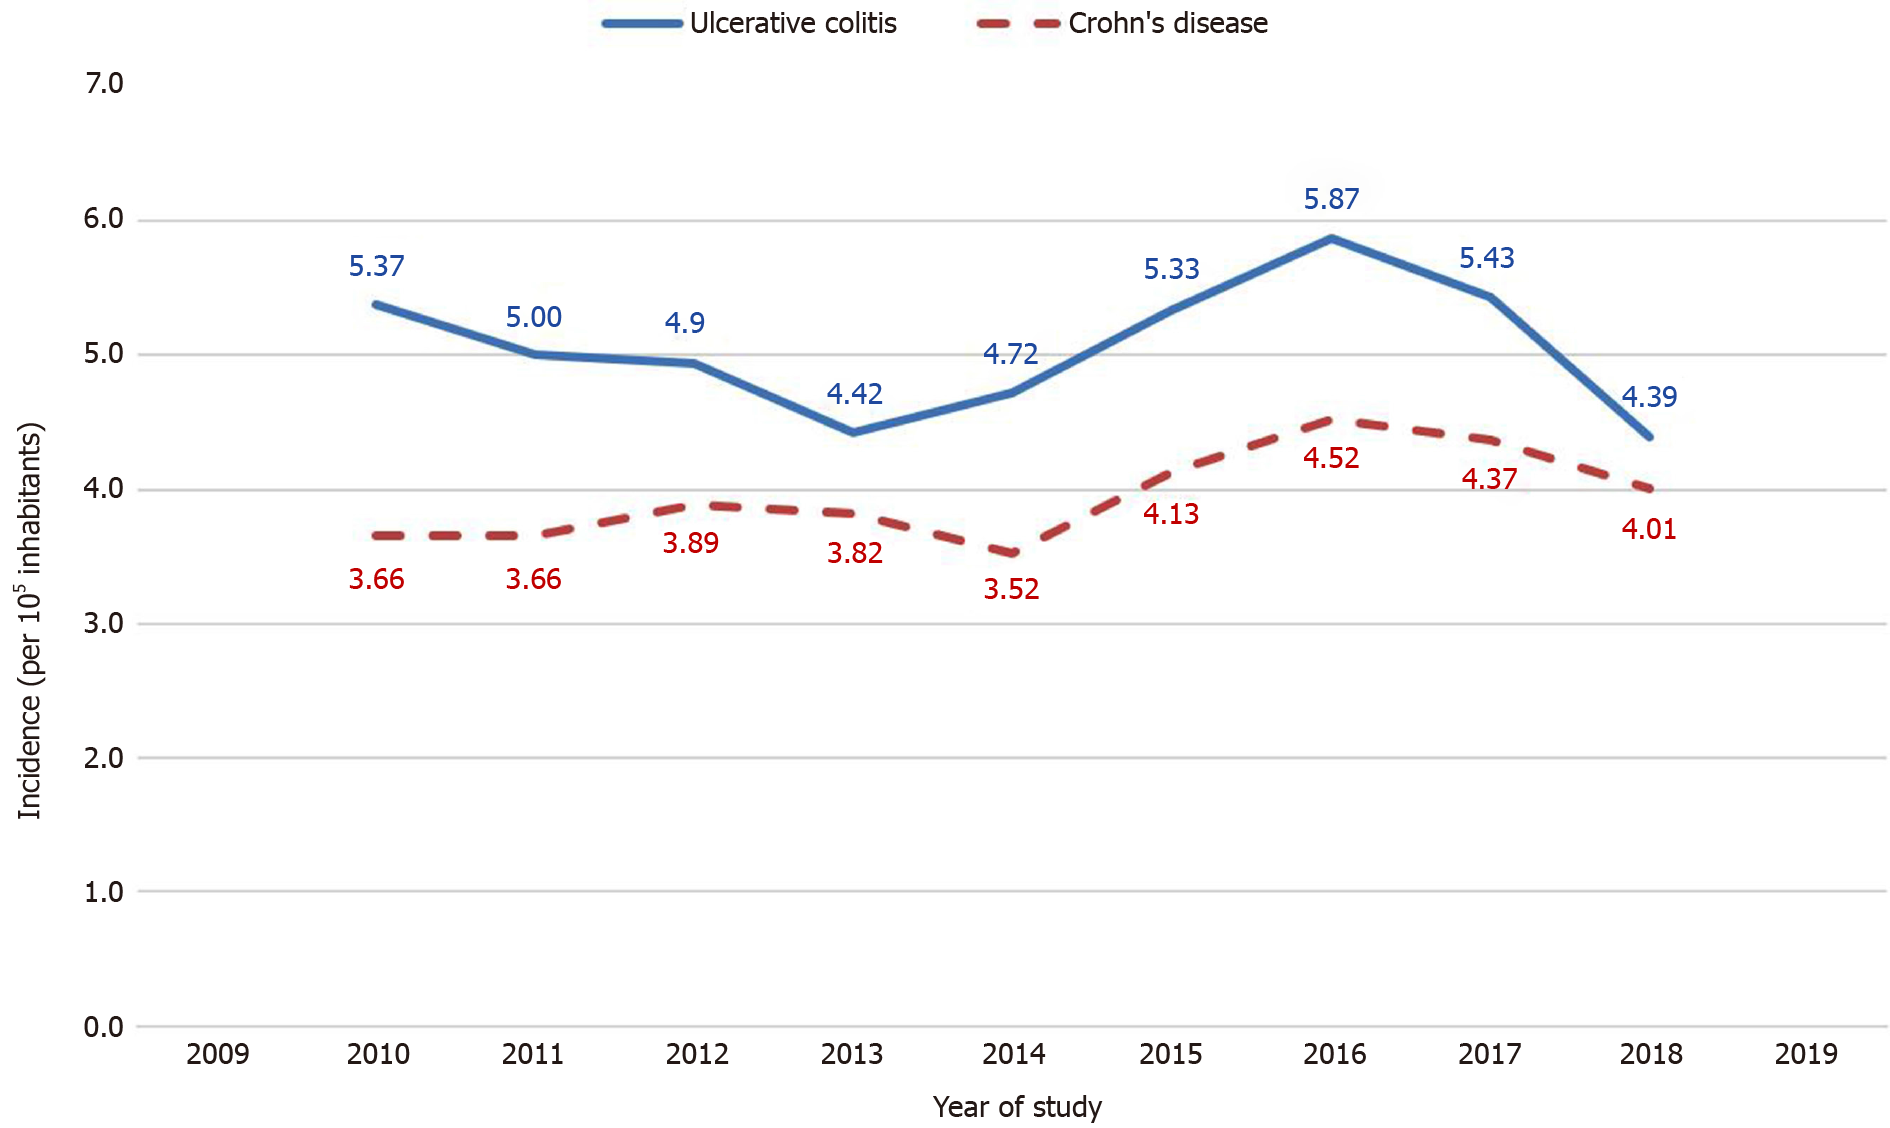
Figure 2
Annual incidence rates of two major forms of inflammatory bowel diseases presented as moving 3-yr average with a 95% confidence interval.
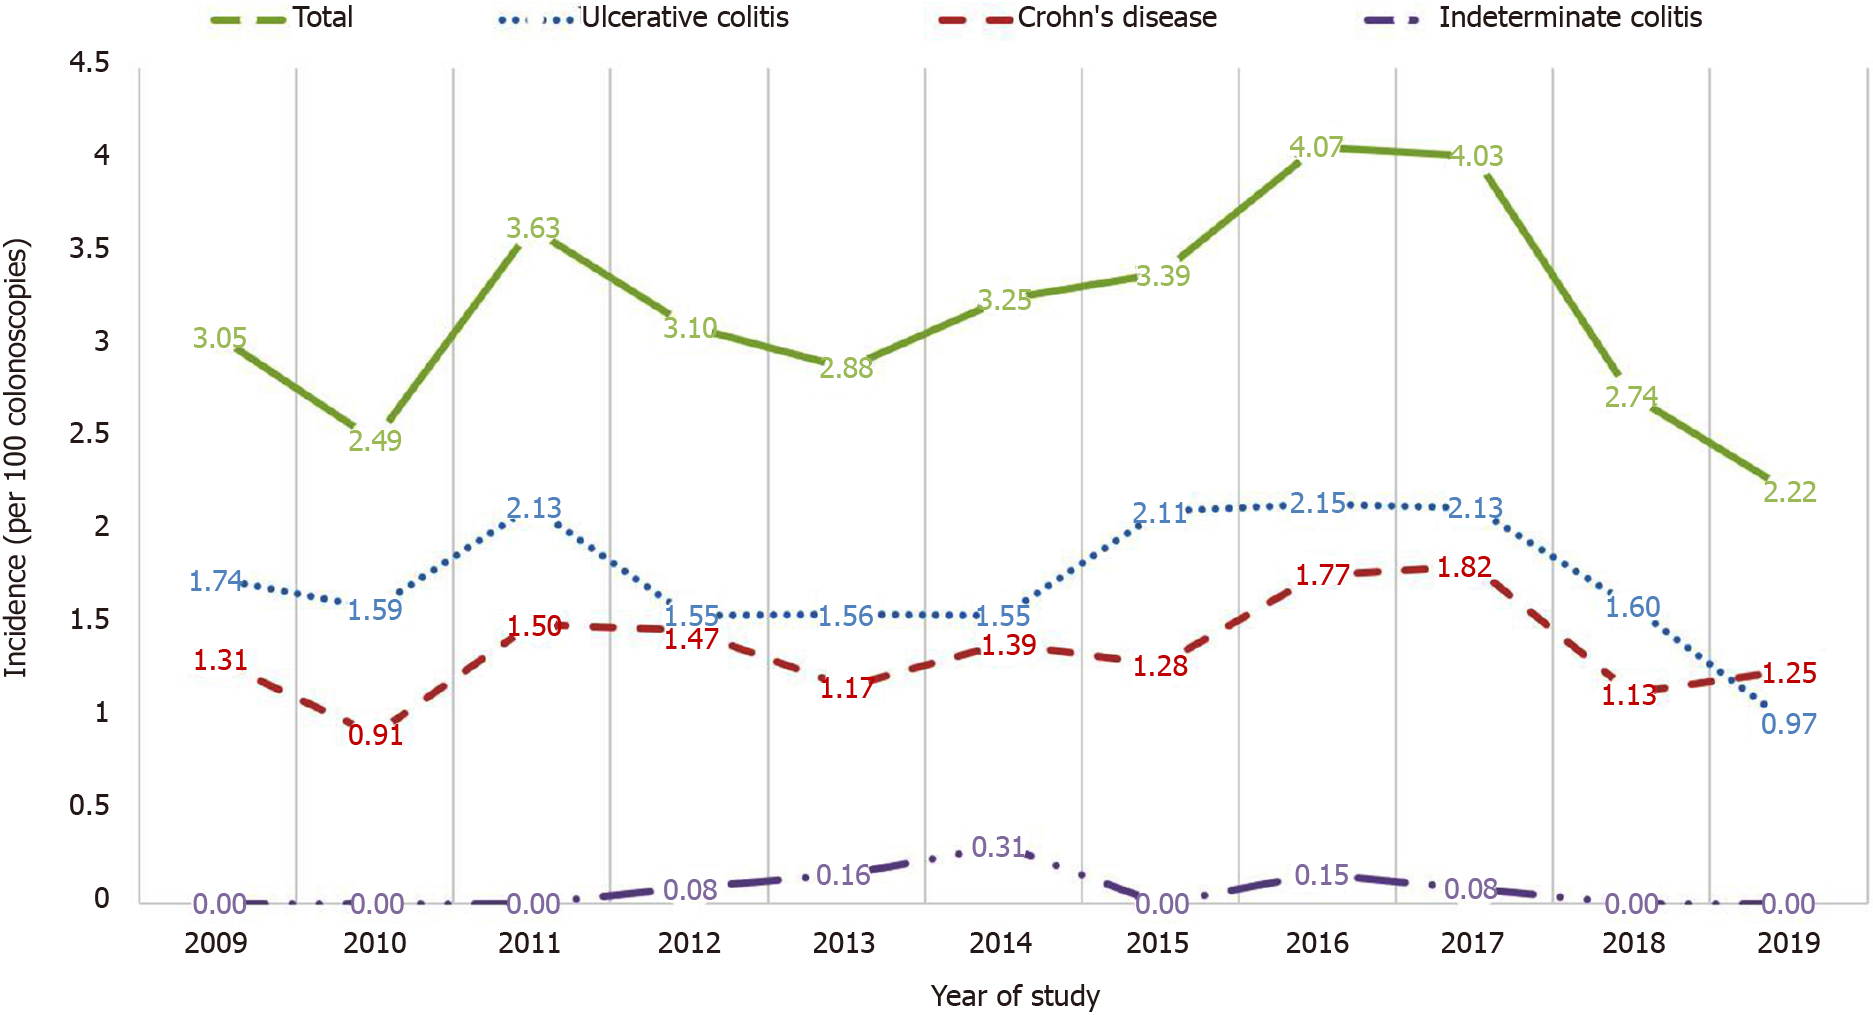
Figure 3
The trend of the annual incidence of inflammatory bowel diseases per 100 colonoscopies performed.
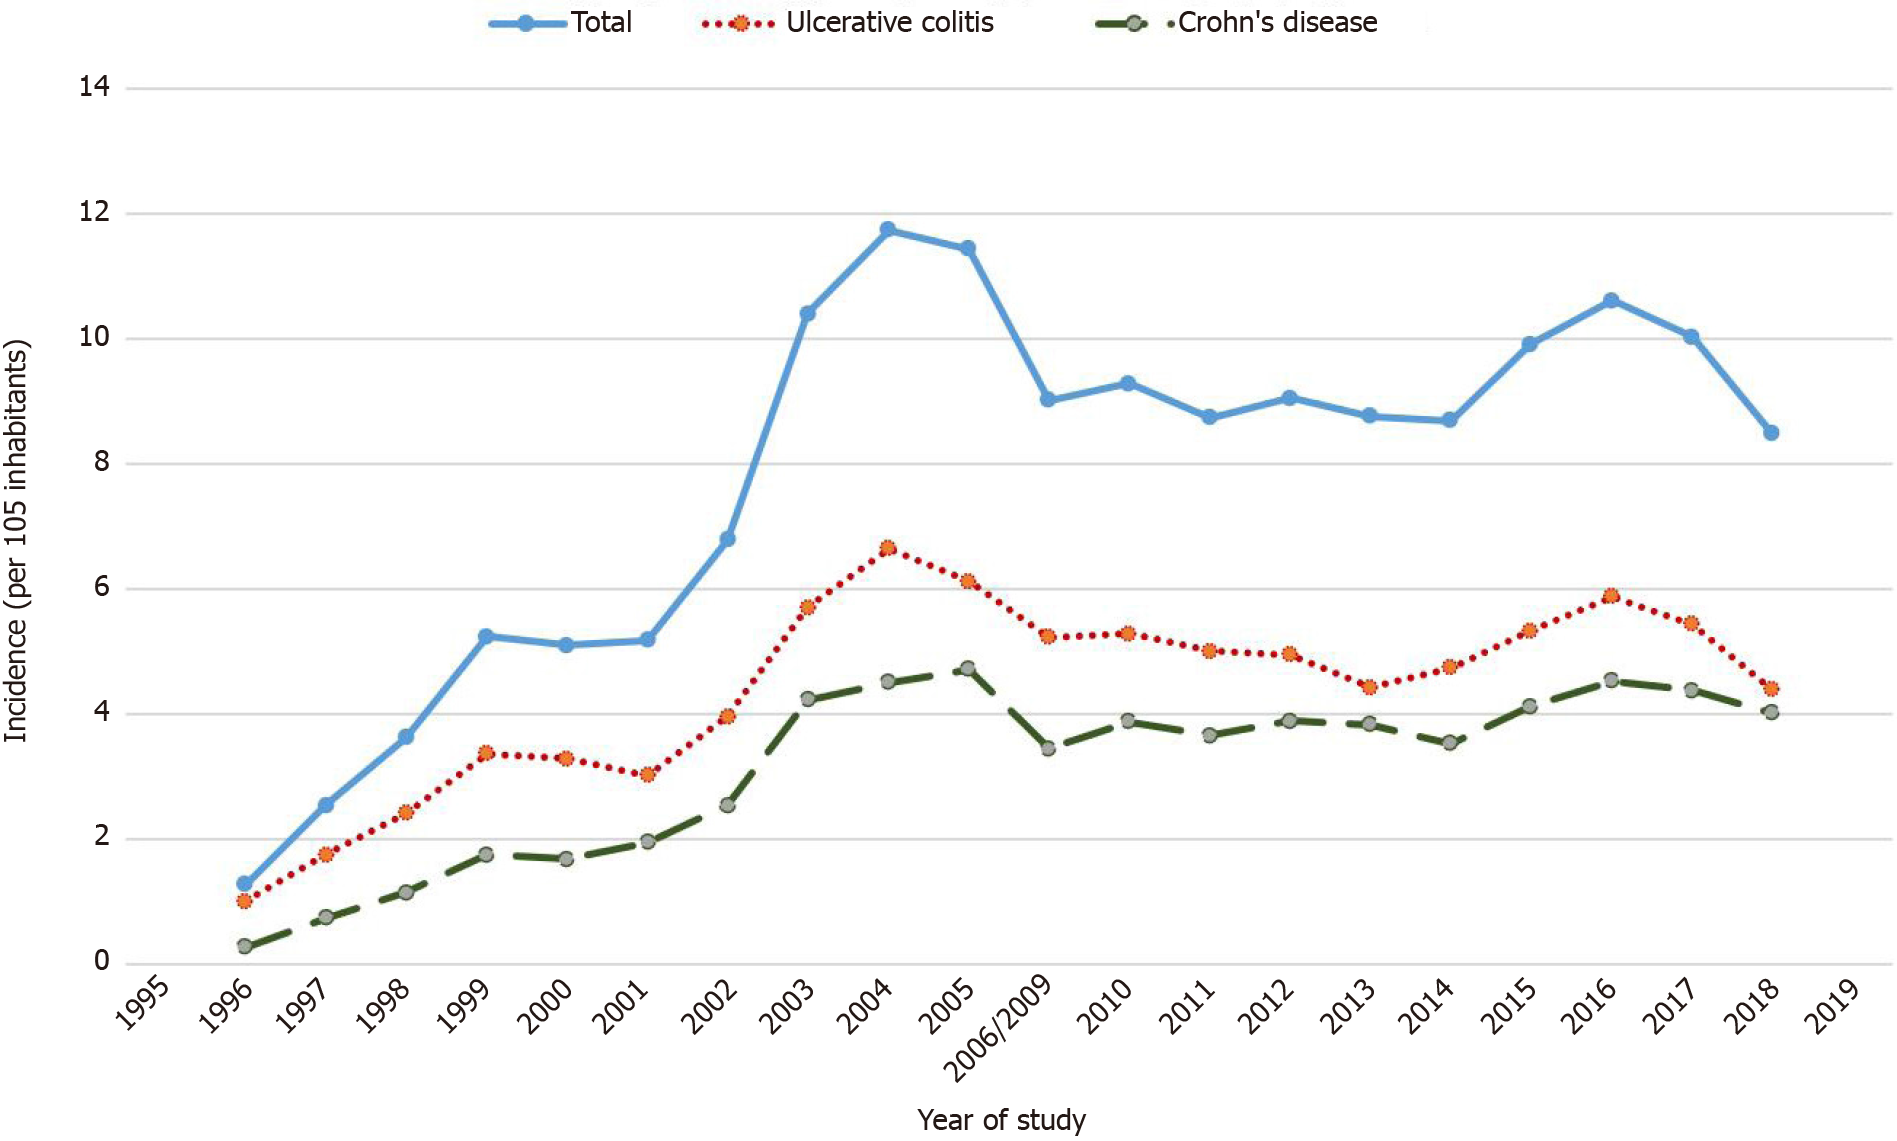
Figure 4 Summarized review of 3-yr average incidence rates on both previous and recent study.
Since the time period 2006-2009 was not evaluated, we used the calculated average of 2006 and 2009.
- Citation: Tulumović E, Salkić N, Tulumović D. Inflammatory bowel disease in Tuzla Canton, Bosnia-Herzegovina: A prospective 10-year follow-up. World J Gastroenterol 2021; 27(20): 2630-2642
- URL: https://www.wjgnet.com/1007-9327/full/v27/i20/2630.htm
- DOI: https://dx.doi.org/10.3748/wjg.v27.i20.2630


