Copyright
©The Author(s) 2021.
World J Gastroenterol. Mar 28, 2021; 27(12): 1182-1193
Published online Mar 28, 2021. doi: 10.3748/wjg.v27.i12.1182
Published online Mar 28, 2021. doi: 10.3748/wjg.v27.i12.1182
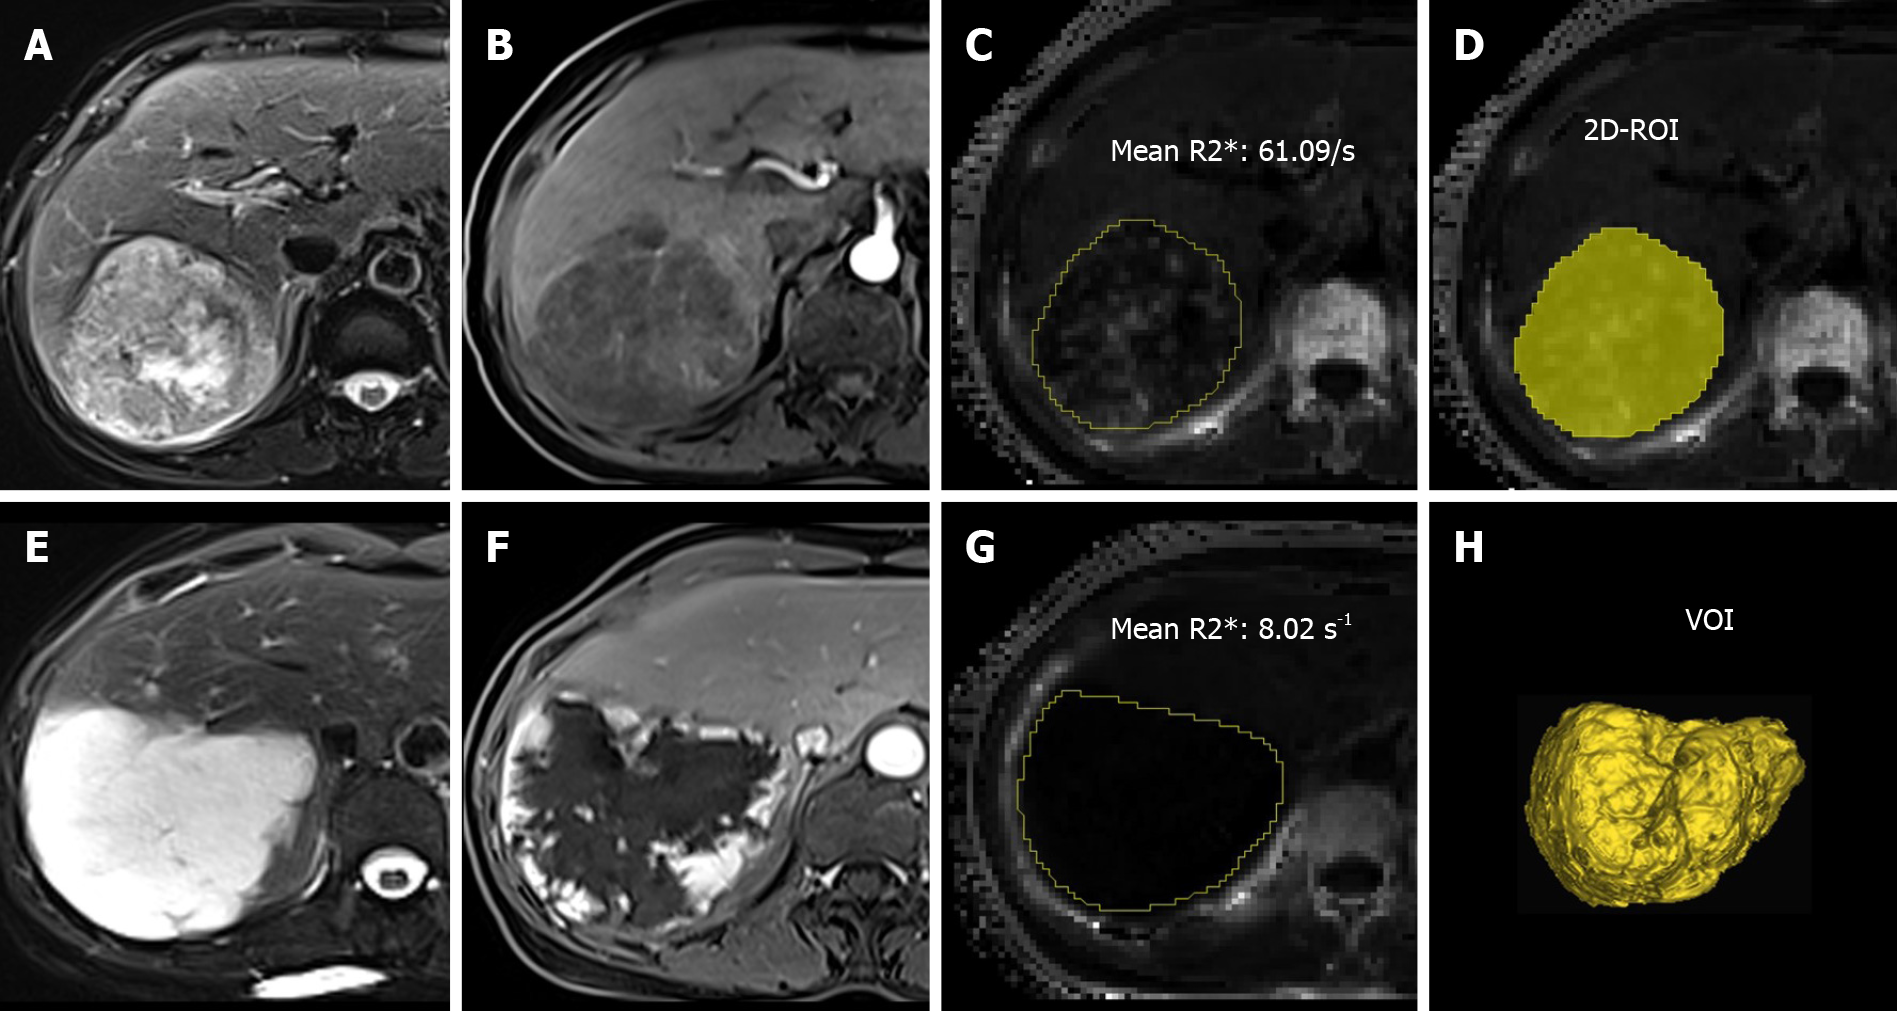
Figure 1 Two-dimensional region of interest and volume of interest.
A-C: T2-weighted imaging (T2WI) (A), arterial phase contrast-enhanced T1-weighted imaging (T1WI) (B), and R2* map showed liver metastasis (yellow line) (C) confirmed by histology in a 59-year-old woman with lung cancer; D: Two-dimensional region of interest was drawn on the section showing the maximal tumor dimension; E-G: T2WI (E), arterial phase contrast-enhanced T1WI (F), and R2* map showed a live hemangioma (yellow line) (G) in a 59-year-old woman; H: Volume of interest was placed covering the entire tumor volume on R2* map. 2D-ROI: Two-dimensional region of interest; VOI: Volume of interest.
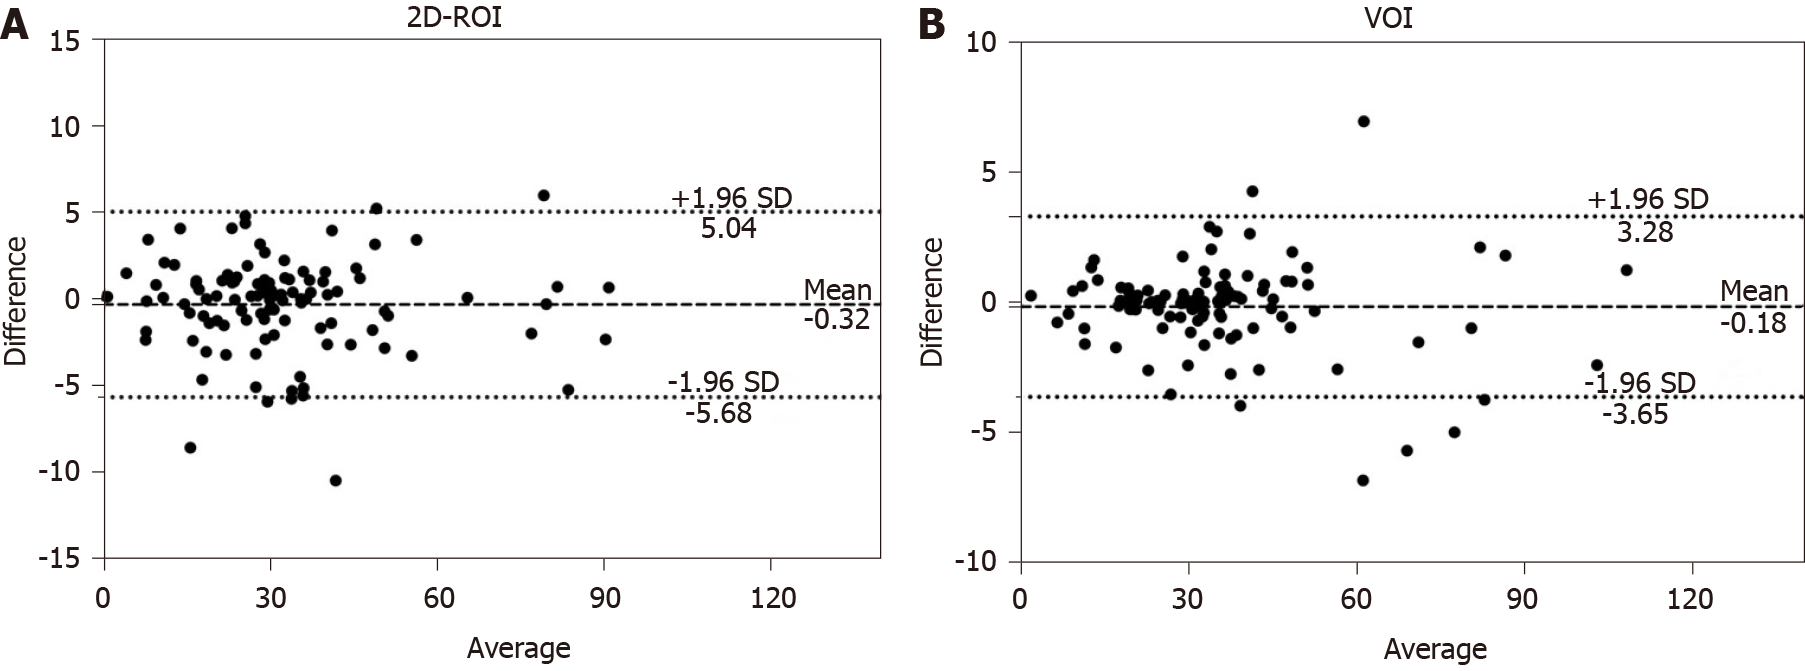
Figure 2 Bland–Altman plots showing interobserver variability in two-dimensional region of interest and volume of interest measurements.
A: Two-dimensional region of interest (ROI); B: Volume of interest. The differences between the two readers using the two different ROI positioning methods were small. 2D-ROI: Two-dimensional region of interest; VOI: Volume of interest.
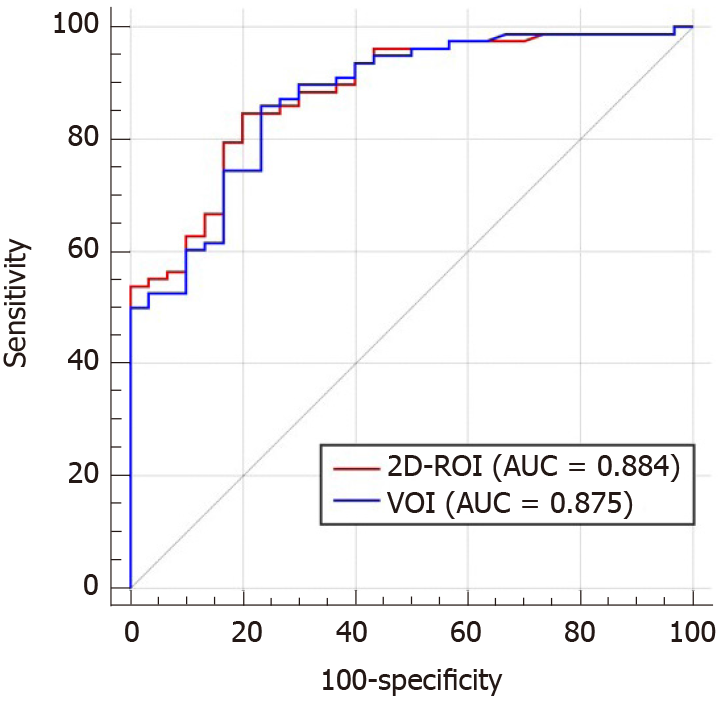
Figure 3 Receiver operating characteristic curve analysis of the two positioning methods in differentiating between malignant group and benign group.
Two-dimensional region of interest and volume of interest methods yielded similar results. 2D-ROI: Two-dimensional region of interest; VOI: Volume of interest; AUC: Area under the curve.
- Citation: Shi GZ, Chen H, Zeng WK, Gao M, Wang MZ, Zhang HT, Shen J. R2* value derived from multi-echo Dixon technique can aid discrimination between benign and malignant focal liver lesions. World J Gastroenterol 2021; 27(12): 1182-1193
- URL: https://www.wjgnet.com/1007-9327/full/v27/i12/1182.htm
- DOI: https://dx.doi.org/10.3748/wjg.v27.i12.1182


