Copyright
©The Author(s) 2021.
World J Gastroenterol. Jan 7, 2021; 27(1): 80-91
Published online Jan 7, 2021. doi: 10.3748/wjg.v27.i1.80
Published online Jan 7, 2021. doi: 10.3748/wjg.v27.i1.80
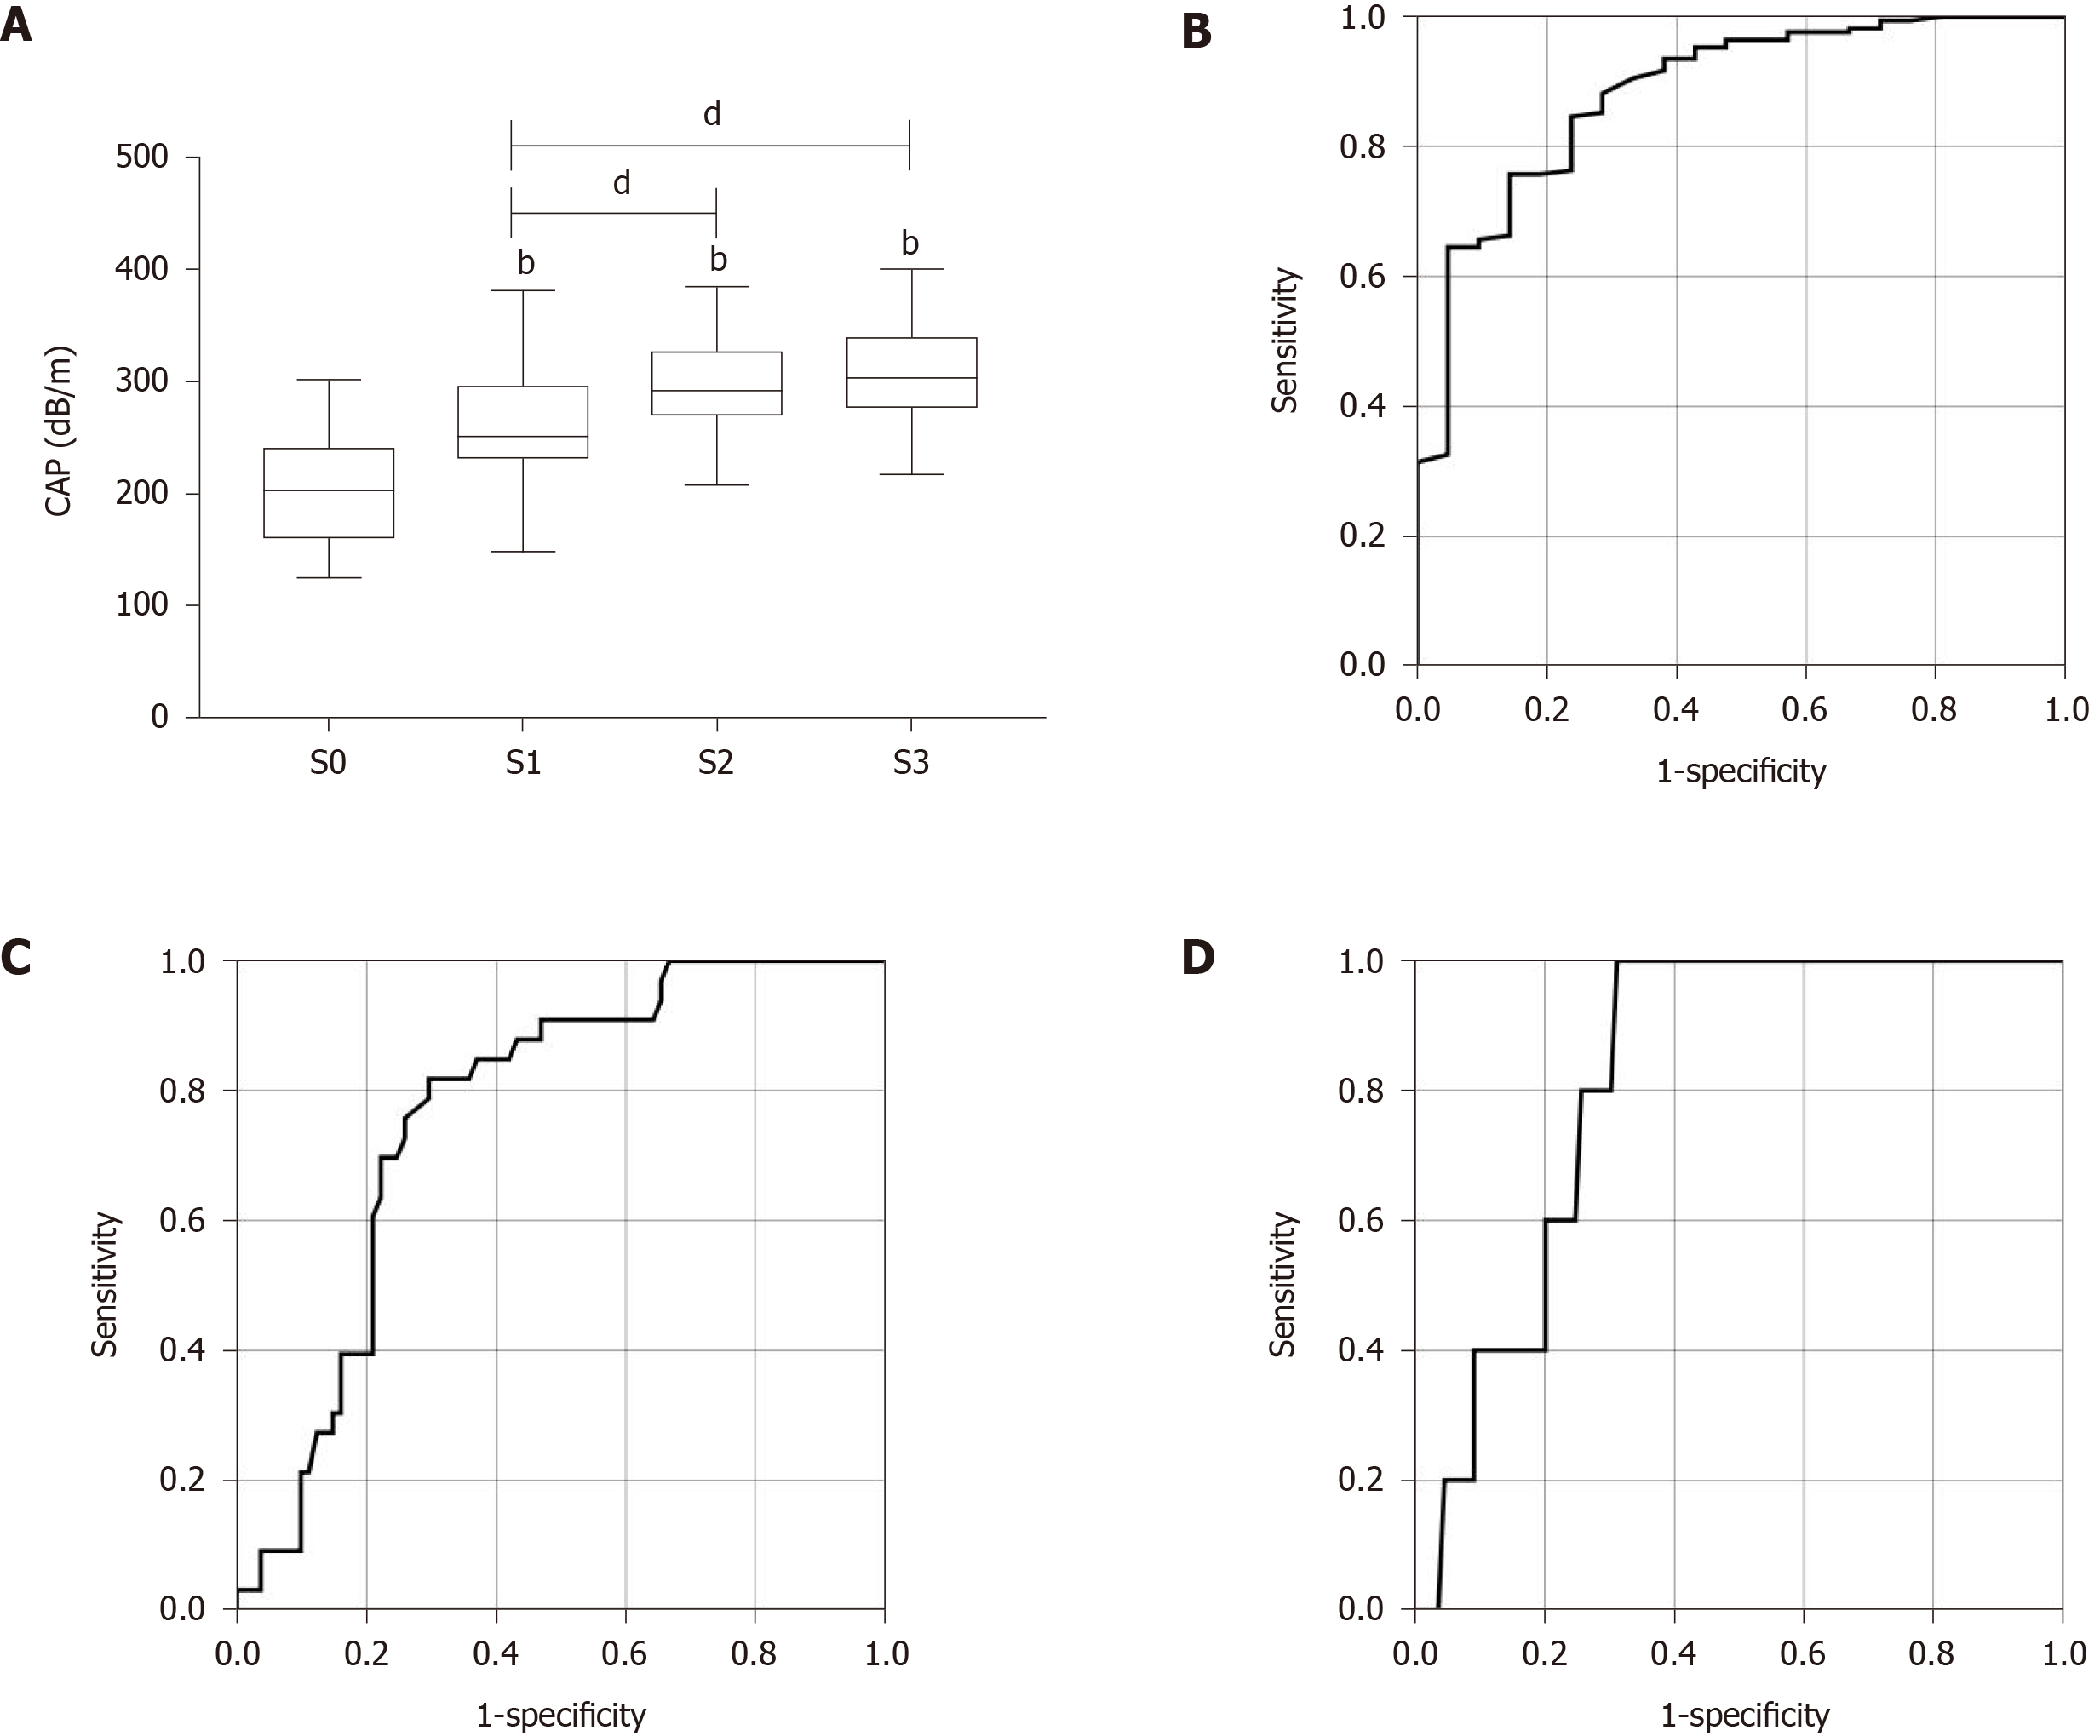
Figure 1 The receiver operator characteristic curve of controlled attenuation parameter for diagnosis of hepatic steatosis grade in patients with mixed etiology liver disease.
A: Correlation between the controlled attenuation parameter (CAP) and the grade of hepatic steatosis (ρ = 0.549, P < 0.001); B-D: The receiver operator characteristic curve of CAP for diagnosis of (B) steatosis grade ≥ S1, (C) steatosis grade ≥ S2, and (D) steatosis grade ≥ S3 in patients with mixed etiology liver disease. bP < 0.01 vs S0; dP < 0.01. CAP: Controlled attenuation parameter.
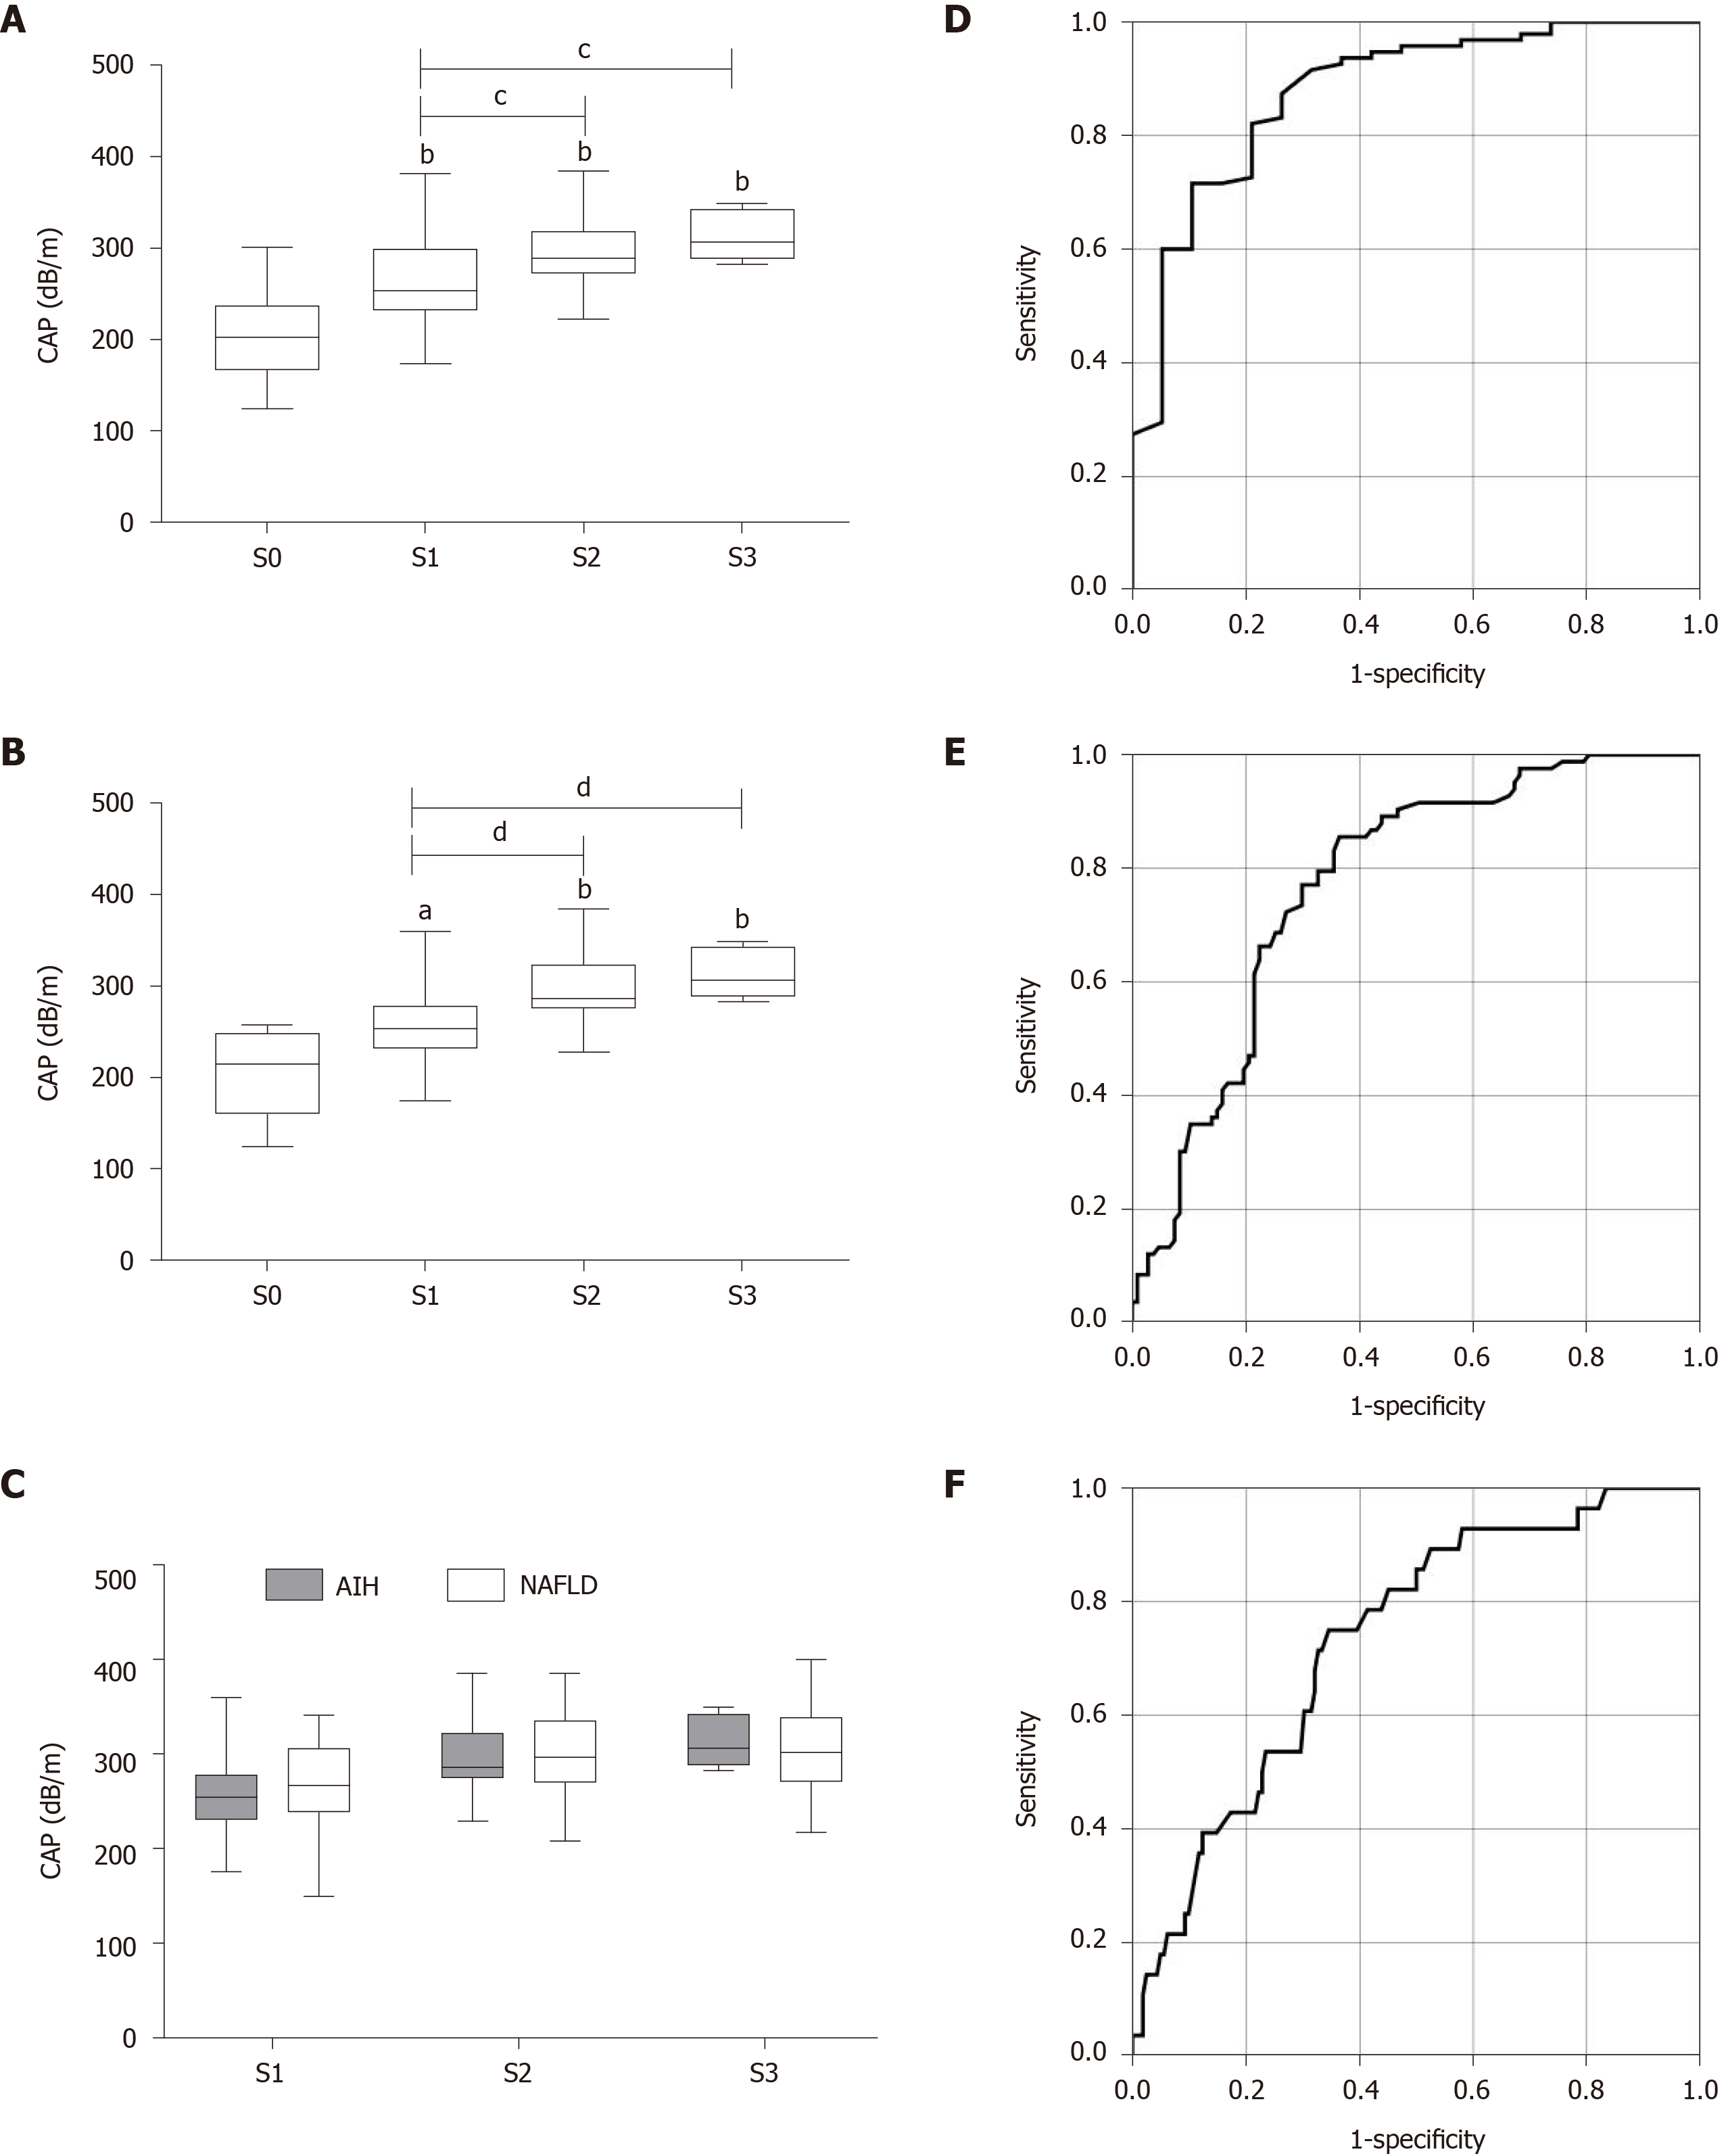
Figure 2 Controlled attenuation parameter value in different hepatic steatosis grades and etiologies and the receiver operator characteristic curve of controlled attenuation parameter for diagnosis of hepatic steatosis grade in patients with autoimmune liver diseases.
A and B: Correlation between the controlled attenuation parameter (CAP) and the grade of hepatic steatosis in patients with (A) autoimmune liver diseases (AILDs) or (B) autoimmune hepatitis (AIH); C: Comparison of the CAP value in patients with AIH and nonalcoholic fatty liver disease in different hepatic steatosis grades; D-F: The receiver operator characteristic curve of CAP for diagnosis of (D) steatosis grade ≥ S1, (E) steatosis grade ≥ S2, and (F) steatosis grade ≥ S3 in patients with AILDs. aP < 0.05; bP < 0.01 vs S0; cP < 0.05; dP < 0.01. CAP: Controlled attenuation parameter; AIH: Autoimmune hepatitis; NAFLD: Nonalcoholic fatty liver disease.
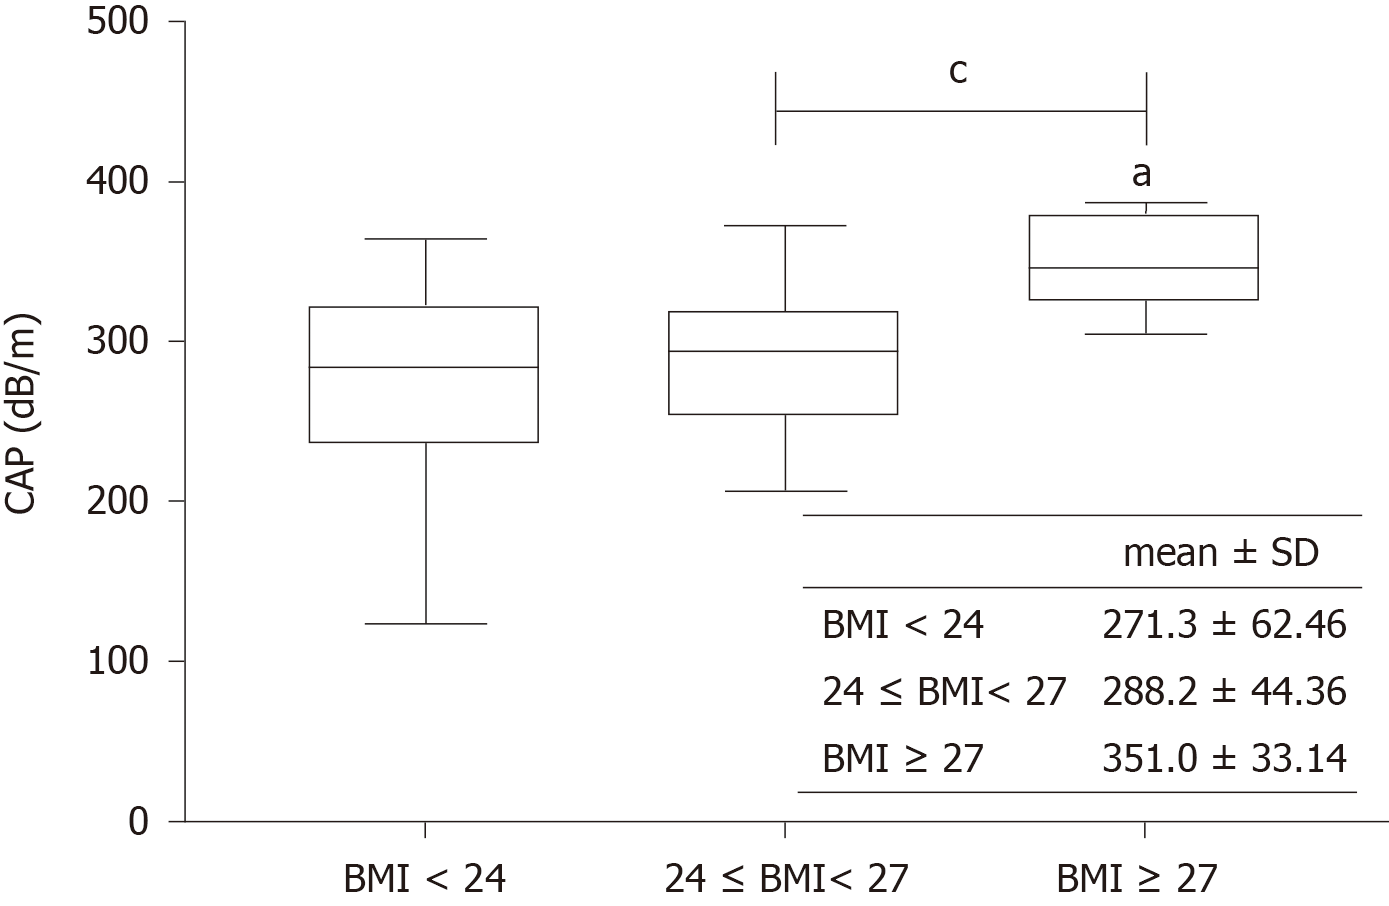
Figure 3 Controlled attenuation parameter in patients with different body mass indexes.
aP < 0.05 vs S0; cP < 0.05. CAP: Controlled attenuation parameter; BMI: Body mass index.
- Citation: Ni XX, Lian M, Wu HM, Li XY, Sheng L, Bao H, Miao Q, Xiao X, Guo CJ, Li H, Ma X, Hua J. Evaluation of controlled attenuation parameter in assessing hepatic steatosis in patients with autoimmune liver diseases. World J Gastroenterol 2021; 27(1): 80-91
- URL: https://www.wjgnet.com/1007-9327/full/v27/i1/80.htm
- DOI: https://dx.doi.org/10.3748/wjg.v27.i1.80


