Copyright
©The Author(s) 2020.
World J Gastroenterol. Mar 7, 2020; 26(9): 960-972
Published online Mar 7, 2020. doi: 10.3748/wjg.v26.i9.960
Published online Mar 7, 2020. doi: 10.3748/wjg.v26.i9.960
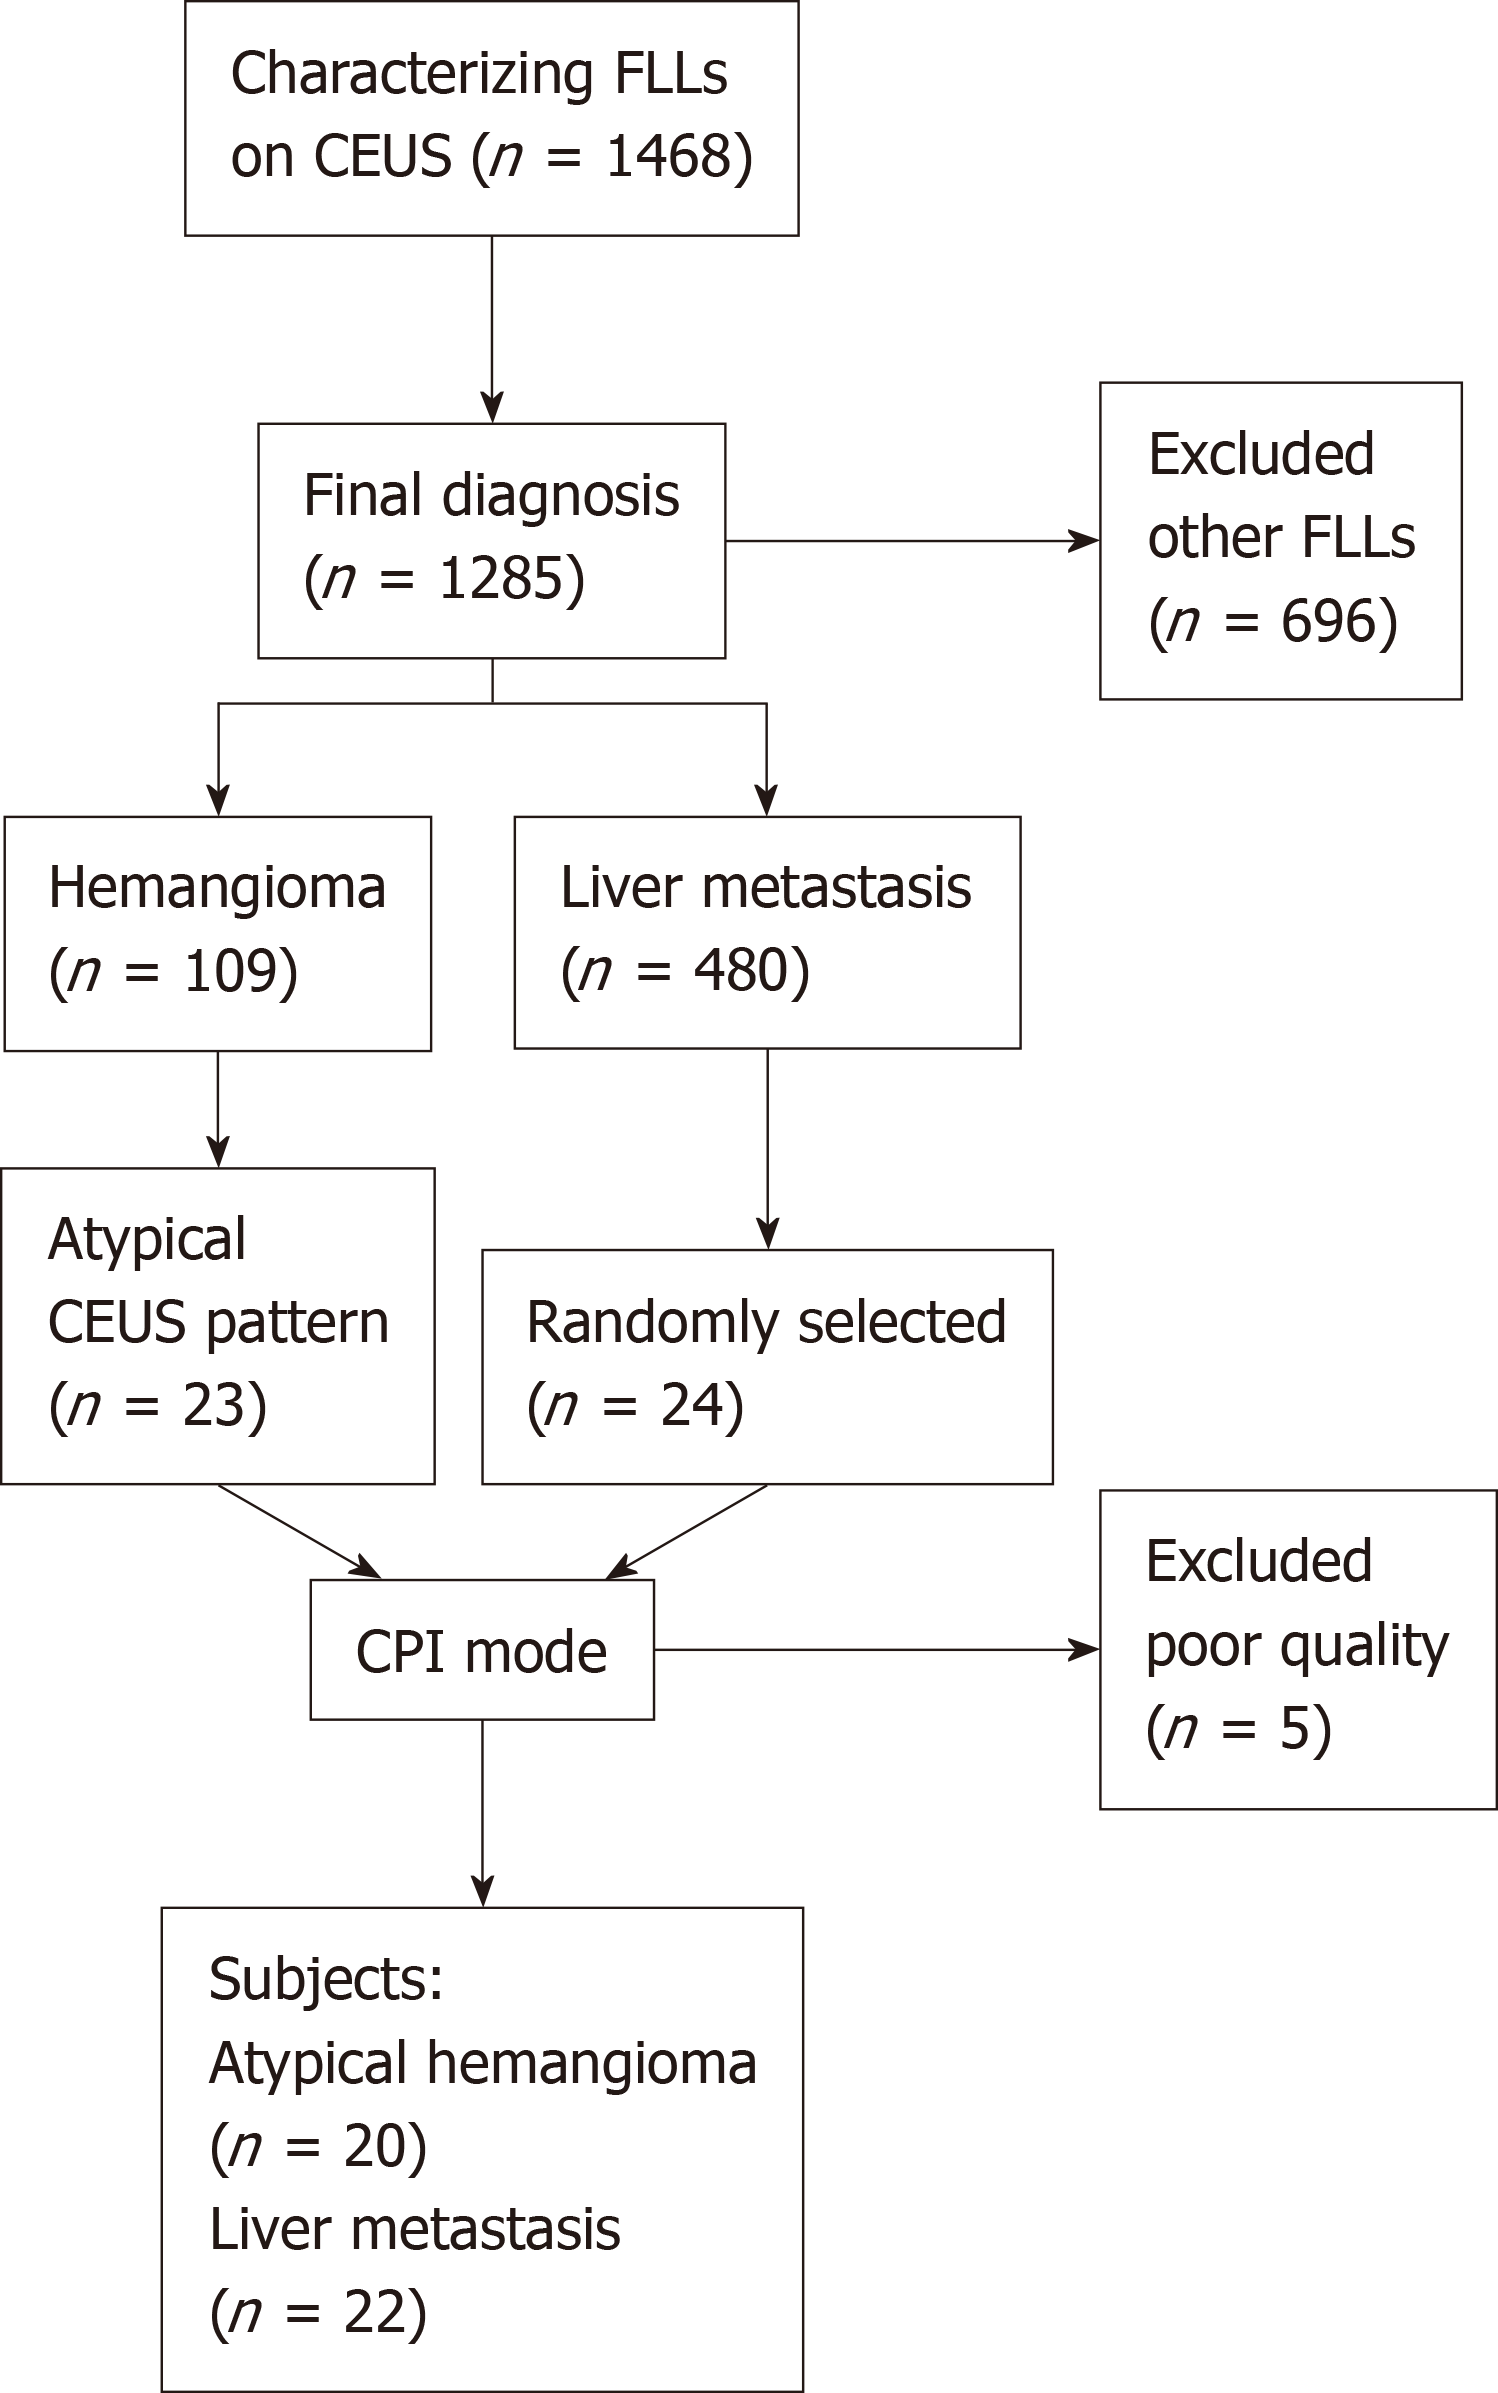
Figure 1 Flow diagram of the study population.
CPI: Color parametric imaging; FLL: Focal liver lesions, CEUS: Contrast enhanced ultrasound.
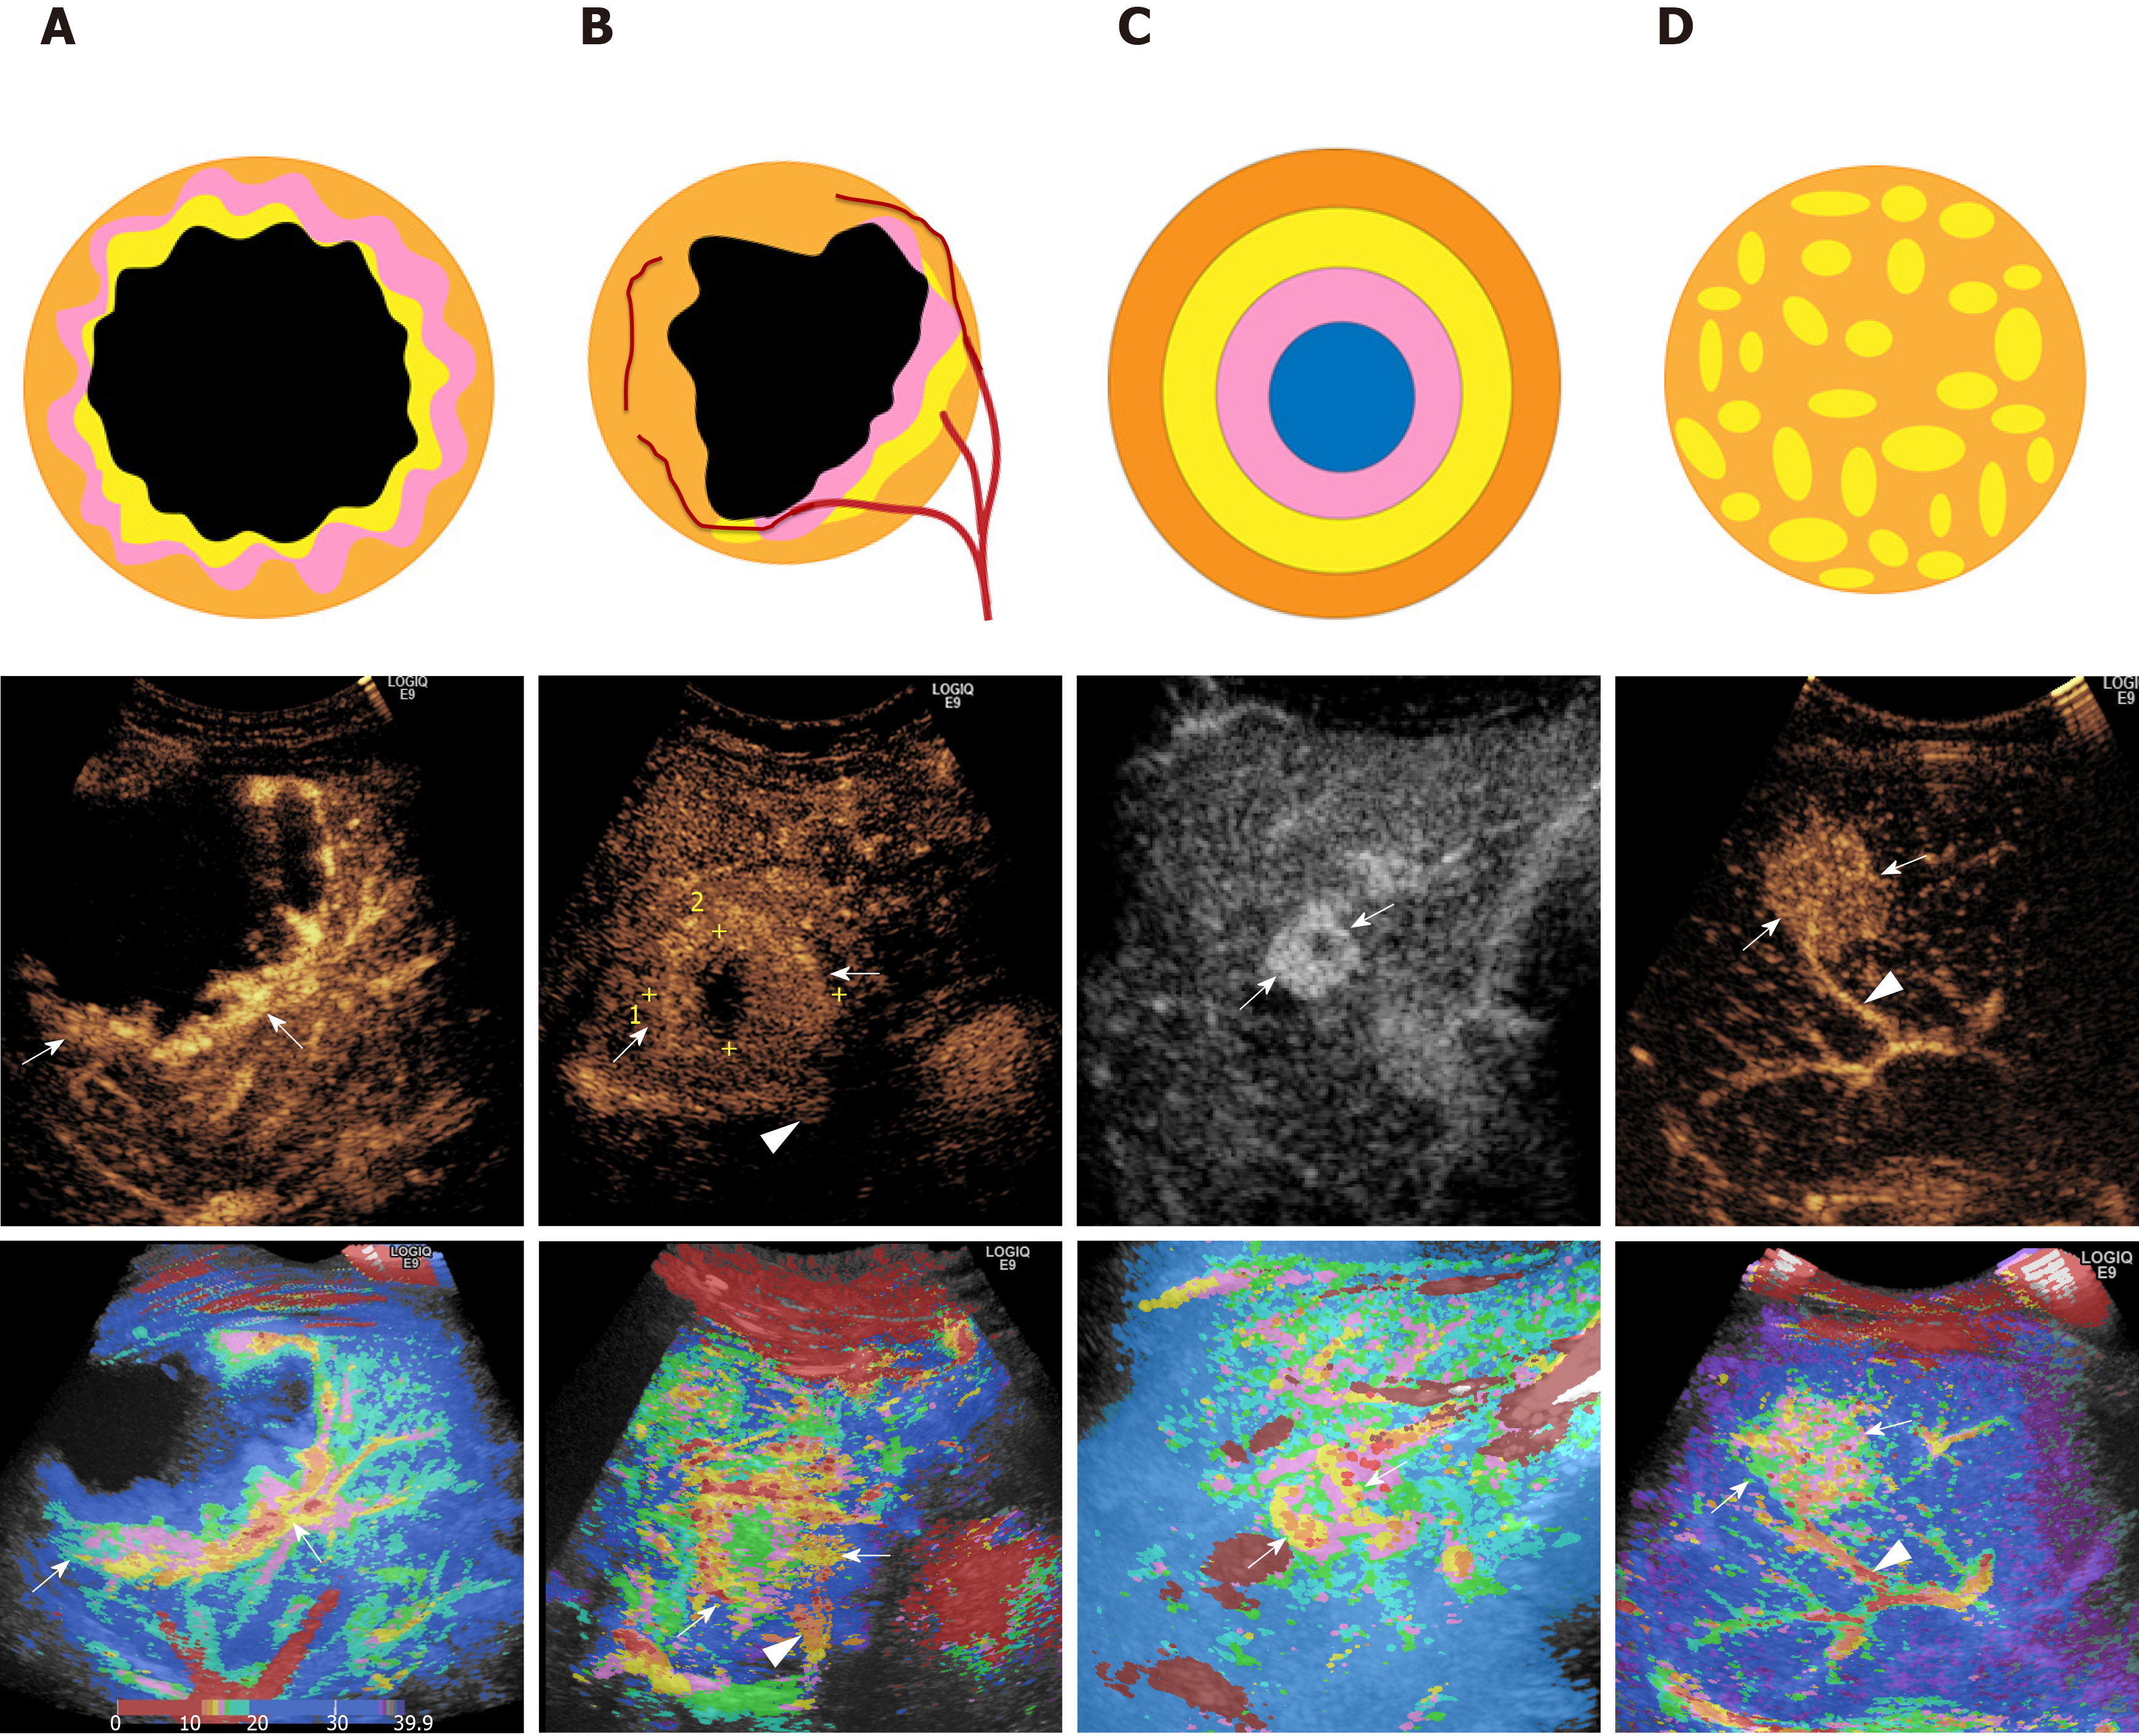
Figure 2 color parametric imaging patterns of liver atypical hemangioma and liver metastases.
First line was sketch figures for the four enhancement patterns of color parametric imaging. Second line was representative routine contrast-enhanced ultrasound images corresponding to the four enhancement patterns. Third line was representative color parametric images corresponding to the four patterns. A: Peripheral nodular enhancement; B: Peripheral rim-like with feeding artery (▲); C: Concentric circles enhancement; D: Mosaic enhancement with feeding artery (▲).
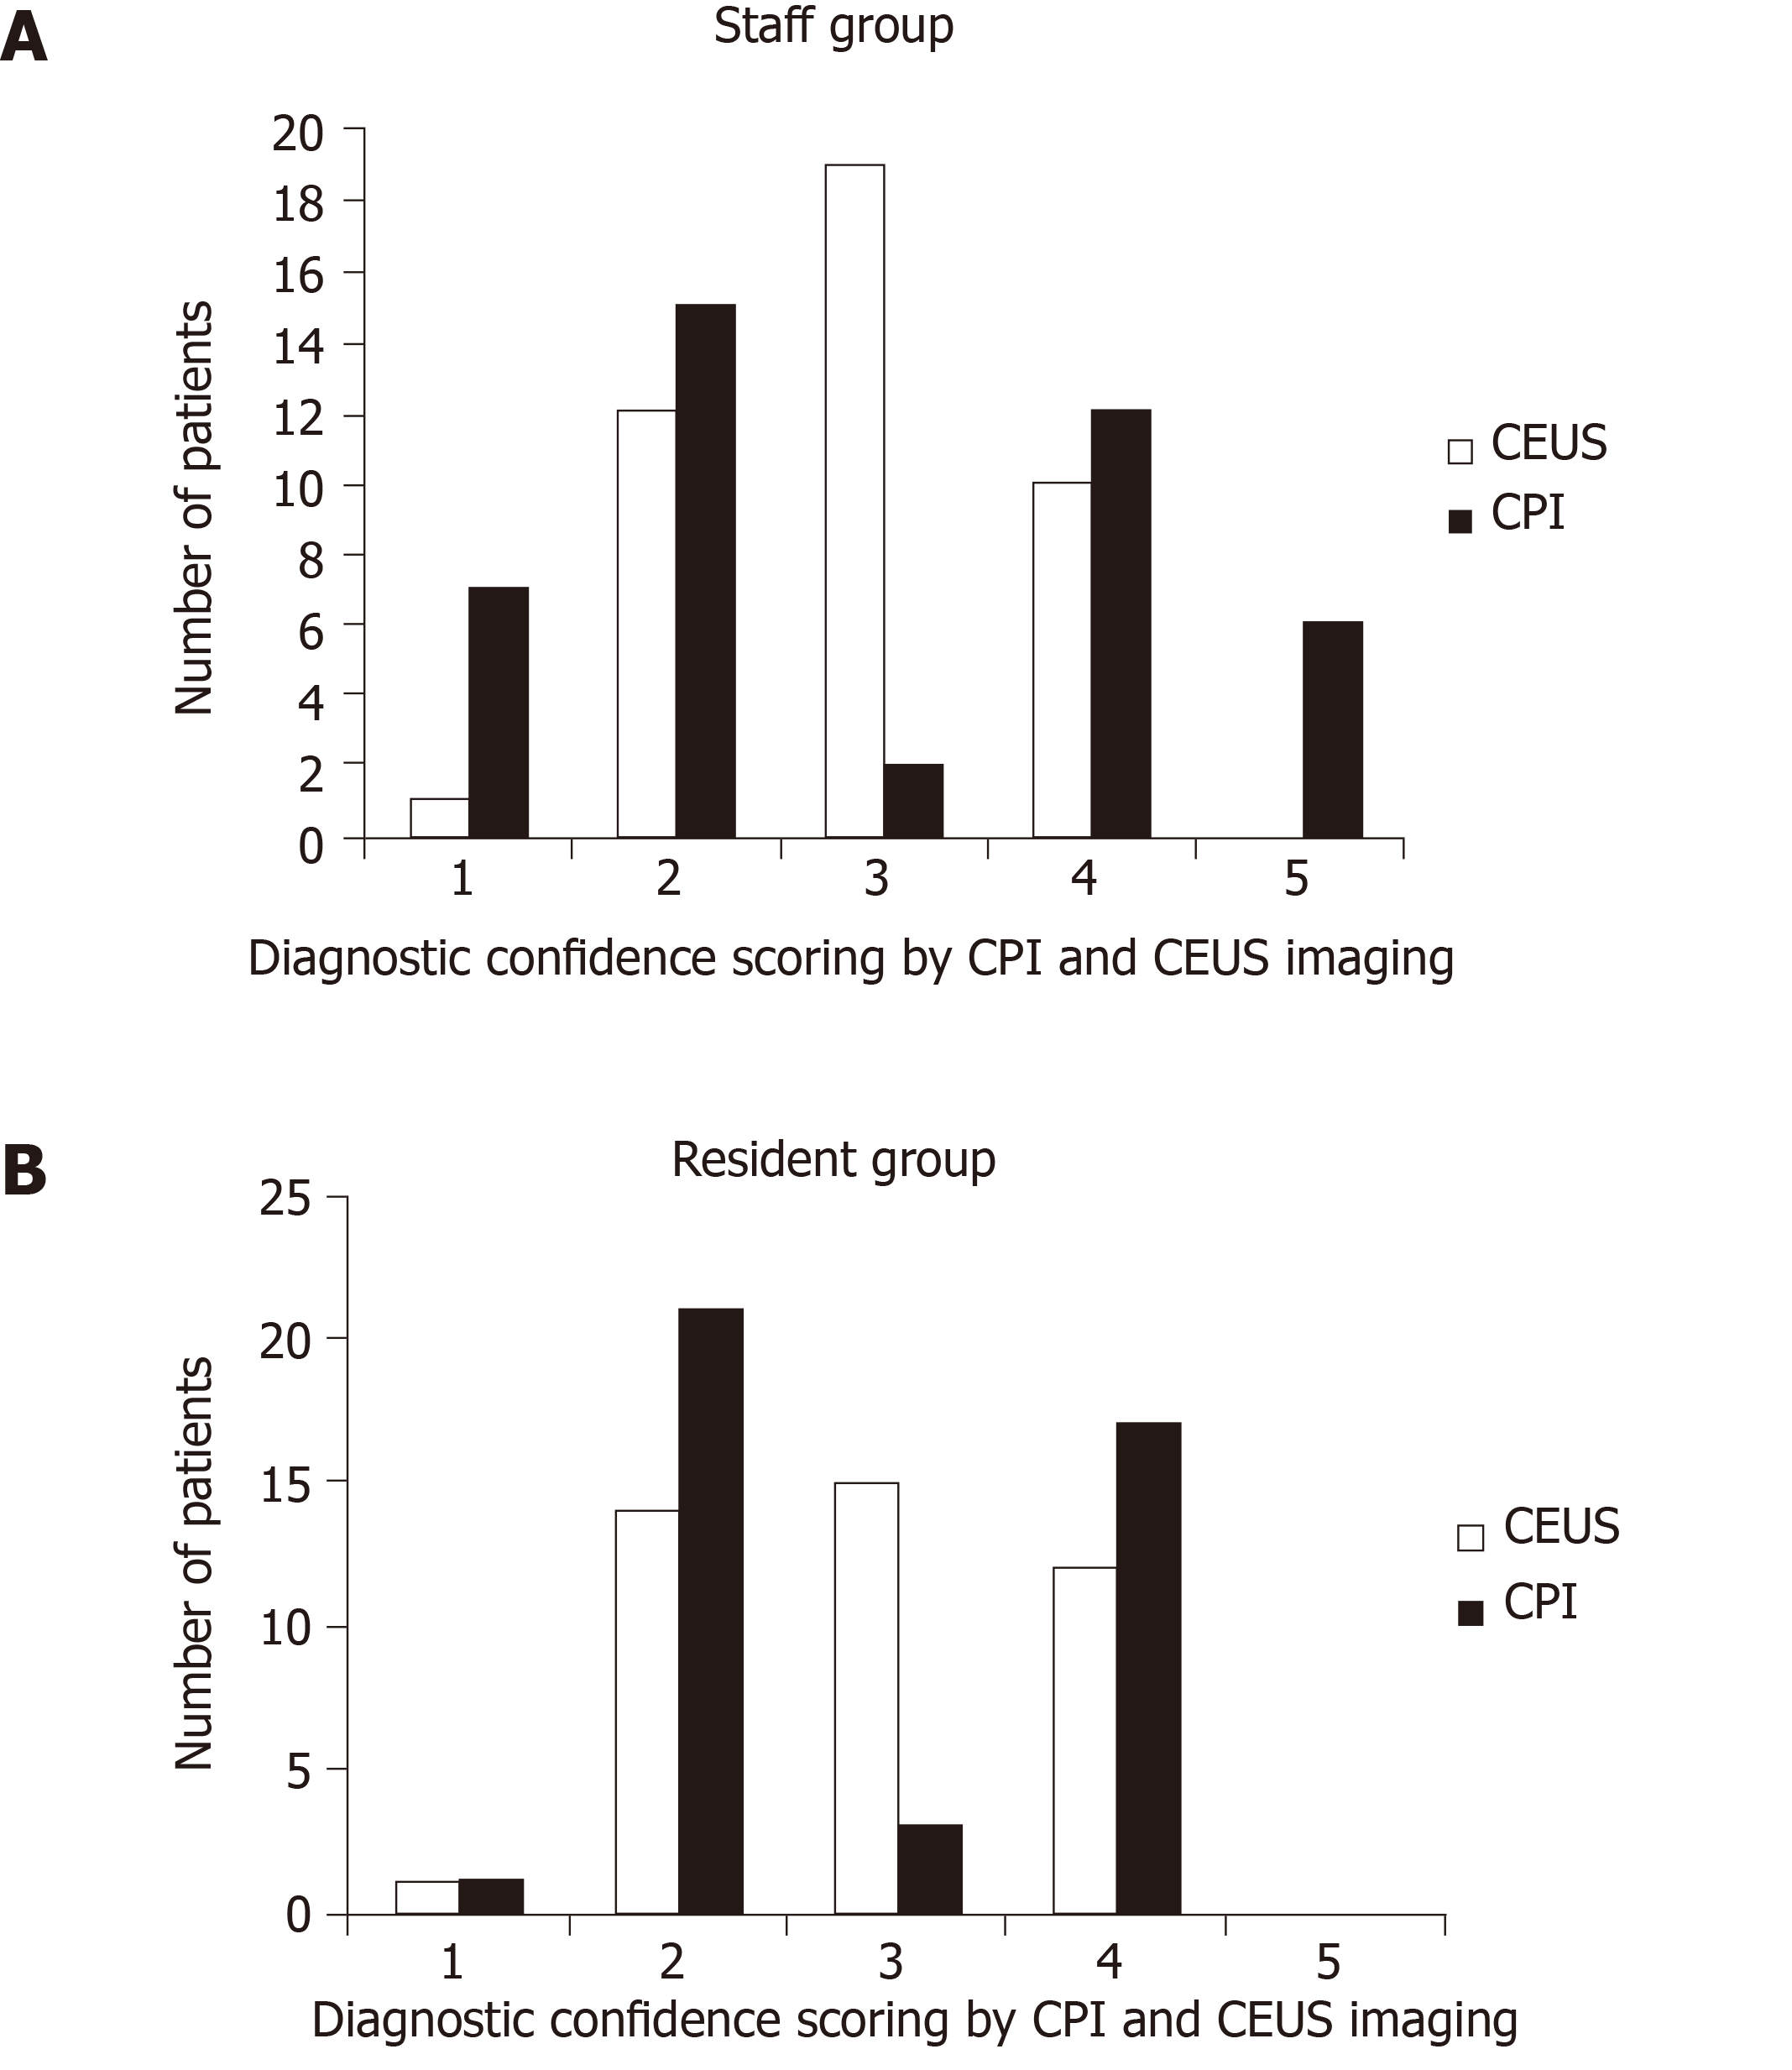
Figure 3 Diagnostic confidence of atypical hemangioma and liver metastasis by staff and resident radiologists.
The number of 3-score (undetermined diagnosis) in contrast enhancement ultrasound was significantly higher than that in color parametric imaging in both staff group (A) and resident group (B). CEUS: Contrast enhancement ultrasound; CPI: Color parametric imaging.
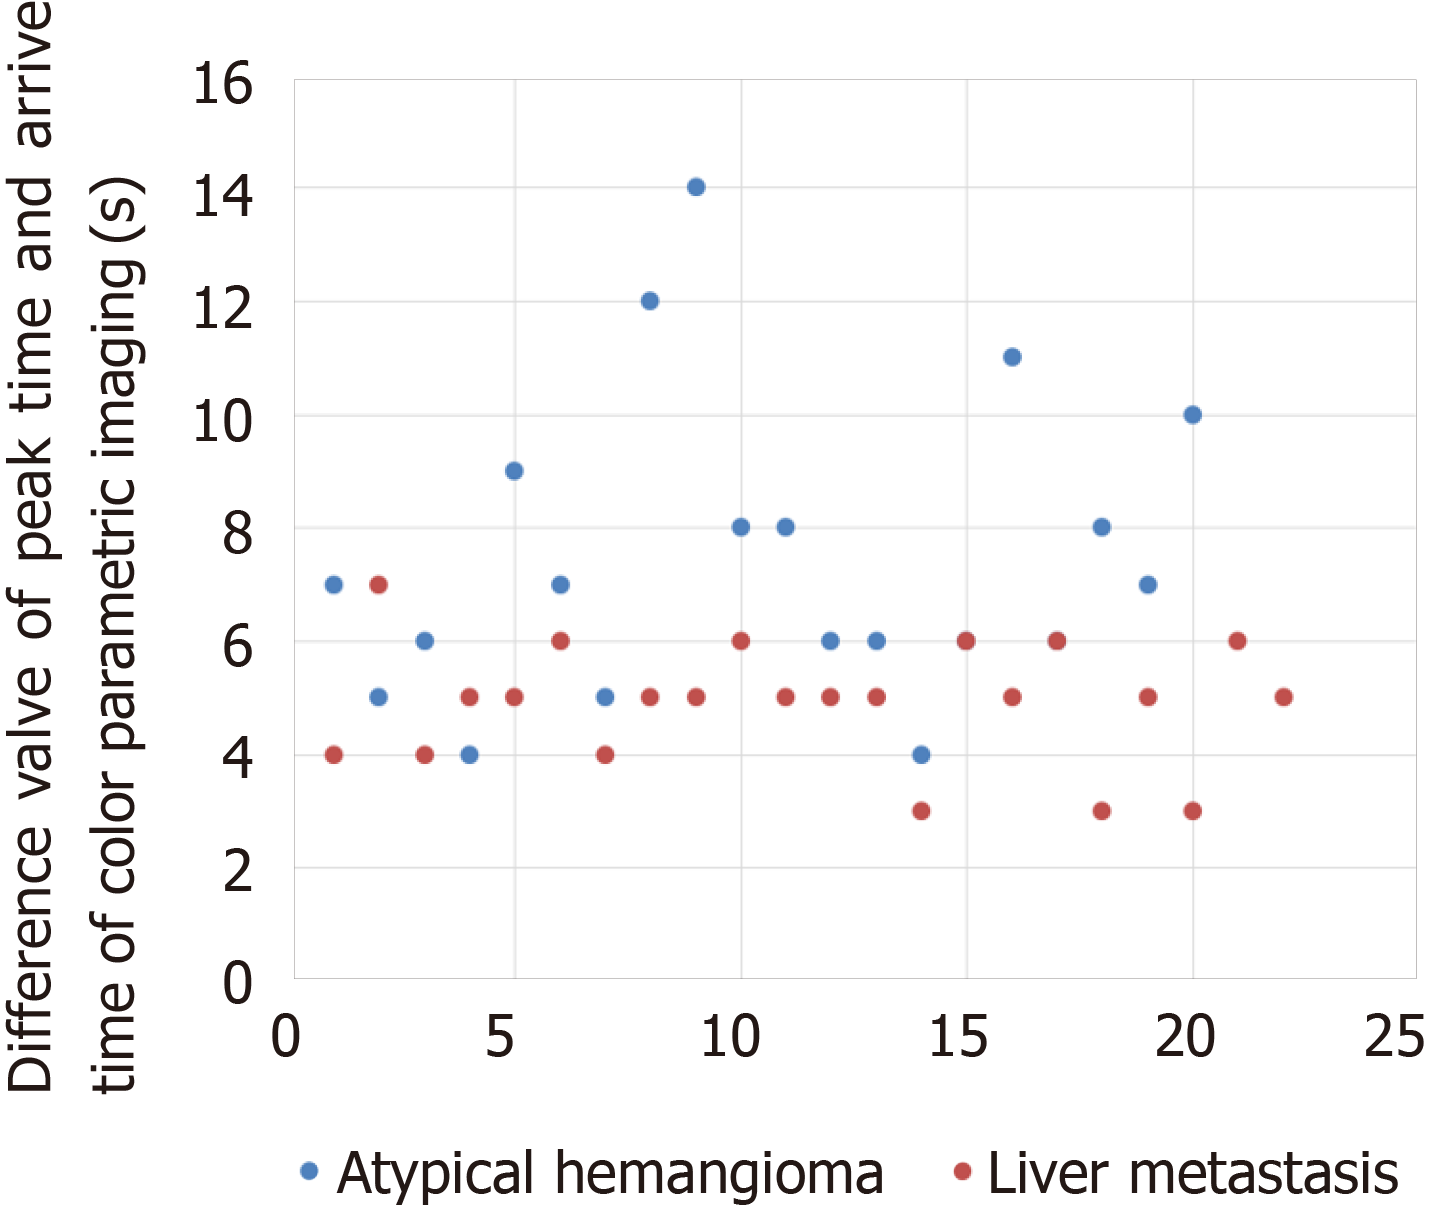
Figure 4 Spot diagram of △AT in atypical hemangioma and liver metastasis.
△AT = Difference valve of peak time and arrival time of color parametric imaging of liver lesions. △AT of atypical hemangioma was significantly longer than that of liver metastasis (8.31 ± 3.05 s vs 5.13 ± 0.99 s, P < 0.001).
- Citation: Wu XF, Bai XM, Yang W, Sun Y, Wang H, Wu W, Chen MH, Yan K. Differentiation of atypical hepatic hemangioma from liver metastases: Diagnostic performance of a novel type of color contrast enhanced ultrasound. World J Gastroenterol 2020; 26(9): 960-972
- URL: https://www.wjgnet.com/1007-9327/full/v26/i9/960.htm
- DOI: https://dx.doi.org/10.3748/wjg.v26.i9.960


