Copyright
©The Author(s) 2020.
World J Gastroenterol. Feb 28, 2020; 26(8): 804-817
Published online Feb 28, 2020. doi: 10.3748/wjg.v26.i8.804
Published online Feb 28, 2020. doi: 10.3748/wjg.v26.i8.804
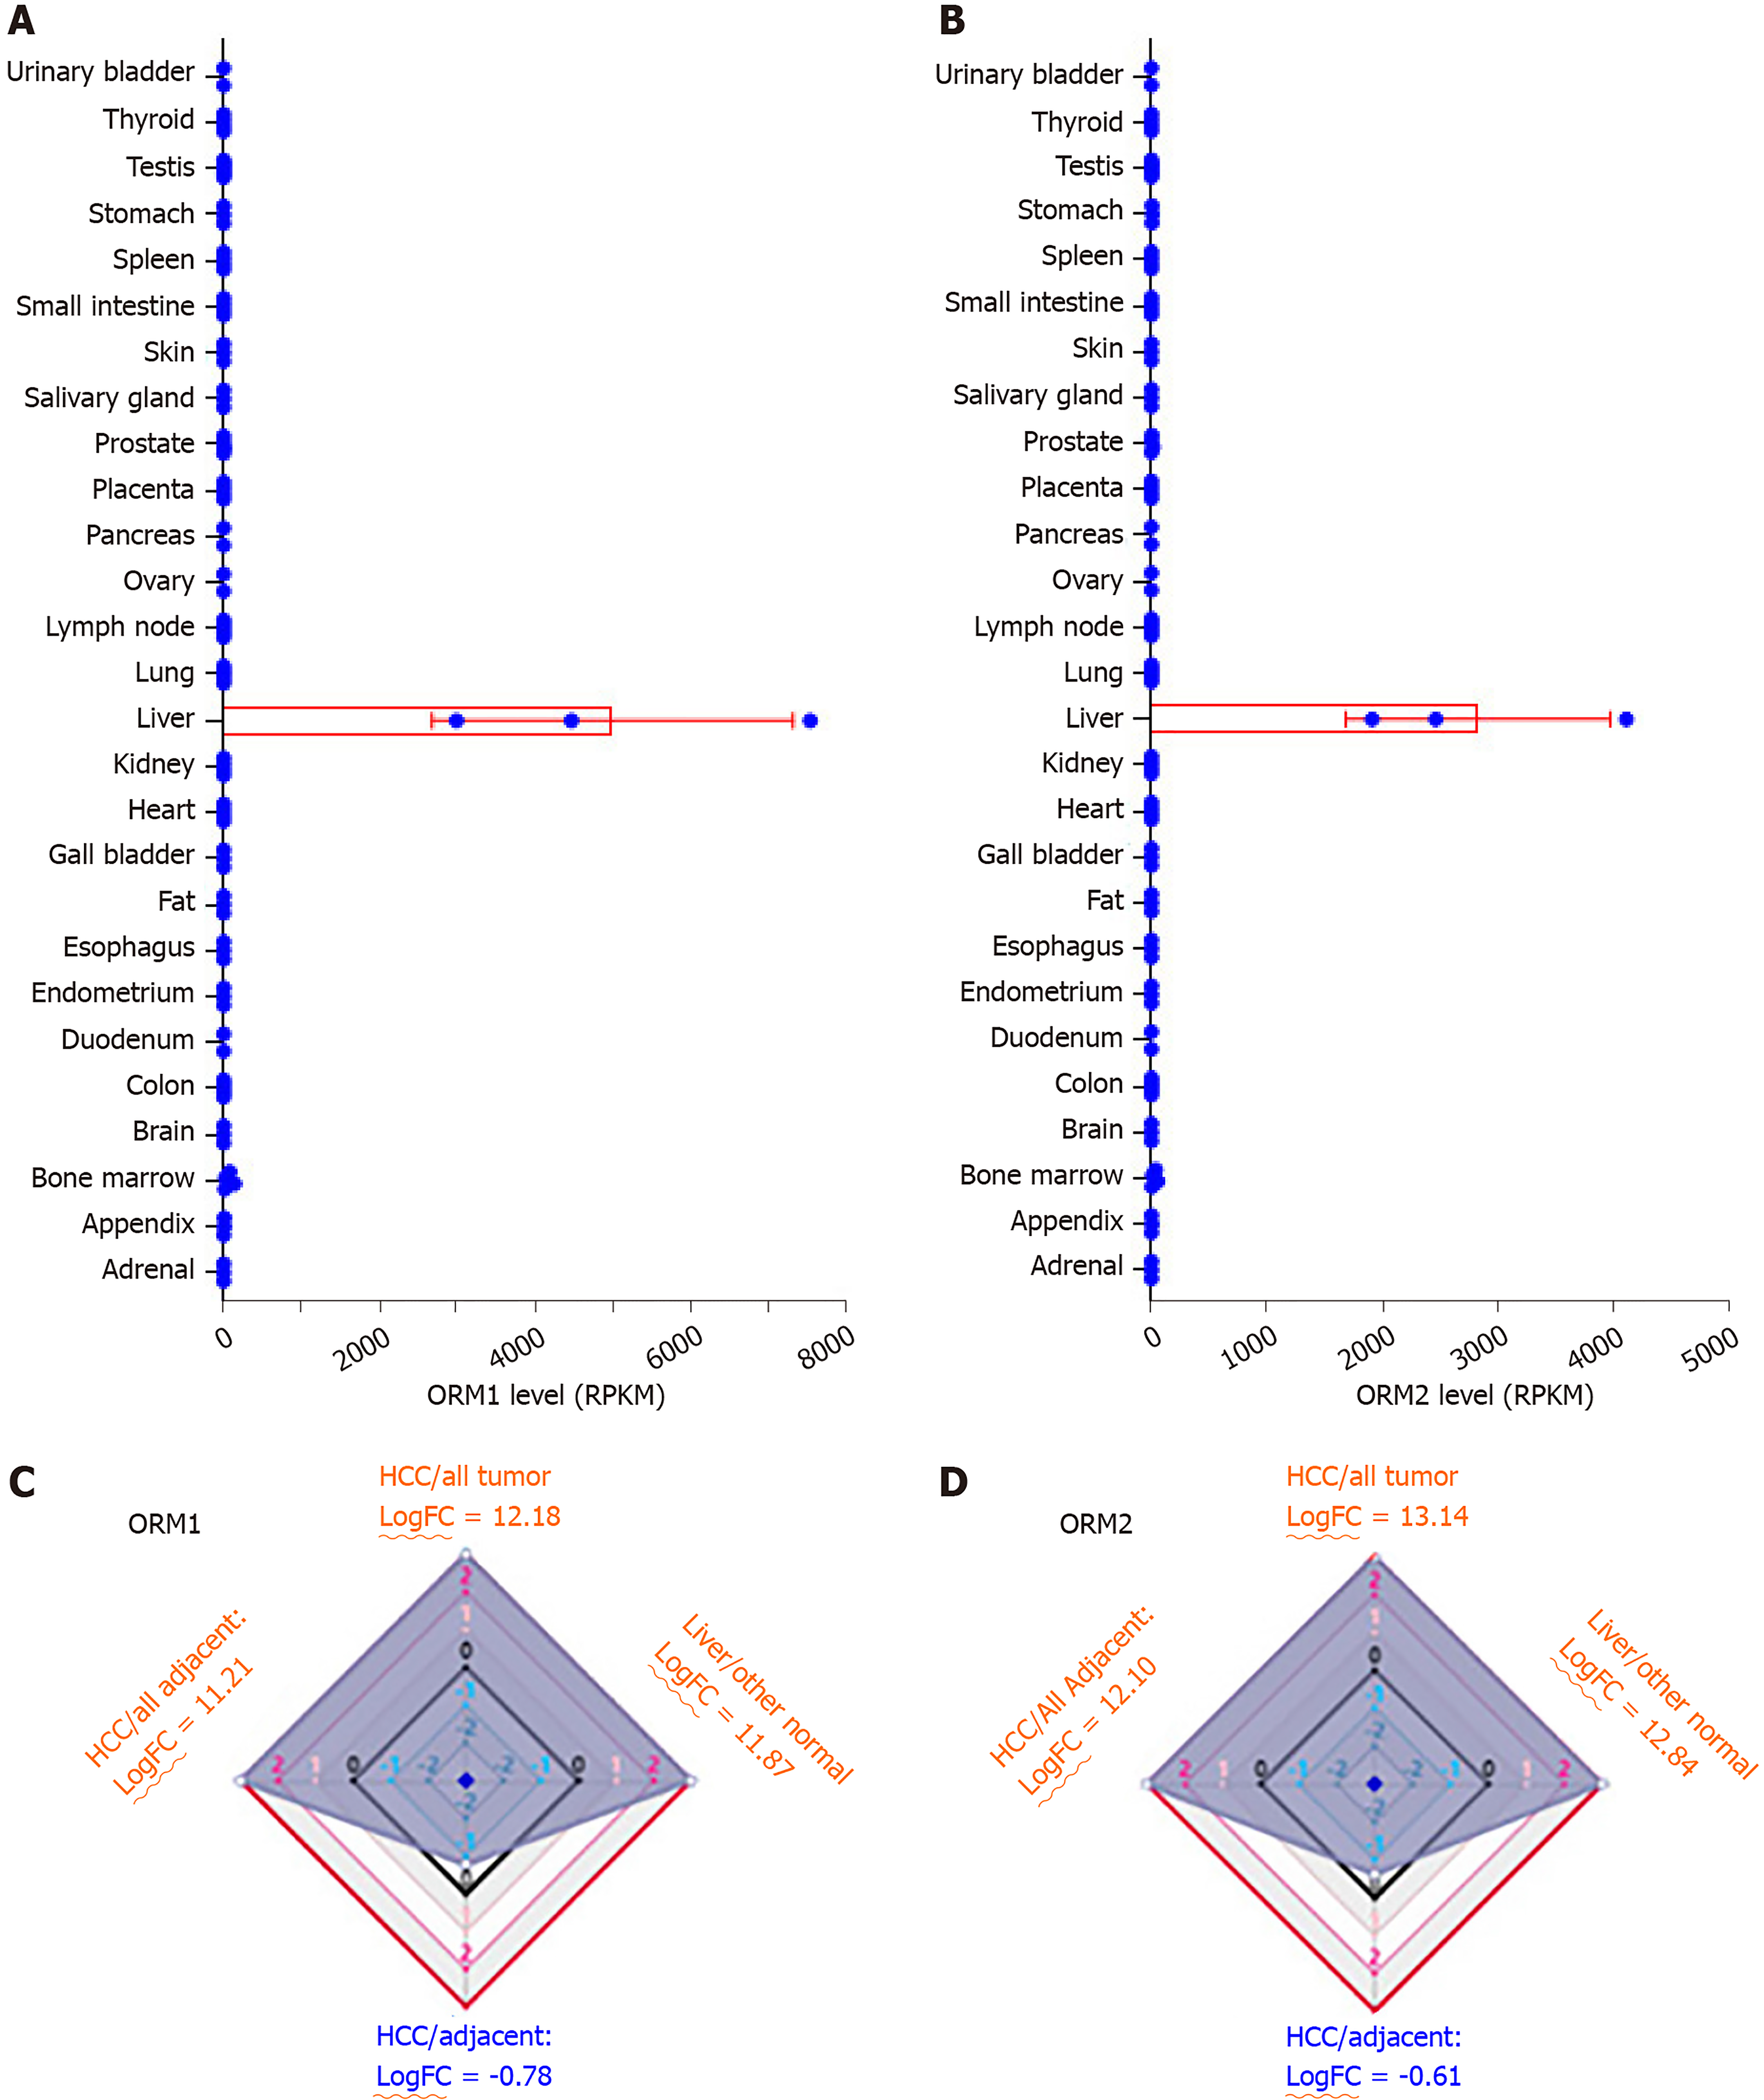
Figure 1 ORM genes are highly expressed specifically in human liver tissues.
A and B: The Human Protein Atlas project was used to test orosomucoid 1 (ORM1) (A) and ORM2 (B) expression levels in different tissues. Gene levels were determined by RPKM and RNA-seq. C and D: The difference in ORM gene expression between liver cancer/other tumors, liver/other normal tissues, liver cancer/adjacent normal liver tissues, and liver tumors/other adjacent normal tissues. The results are shown as differential ratios by logFC. RPKM: Reads Per Kilobase per Million mapped reads; FC: Fold change; HCC: Hepatocellular carcinoma; ORM1: Orosomucoid 1.
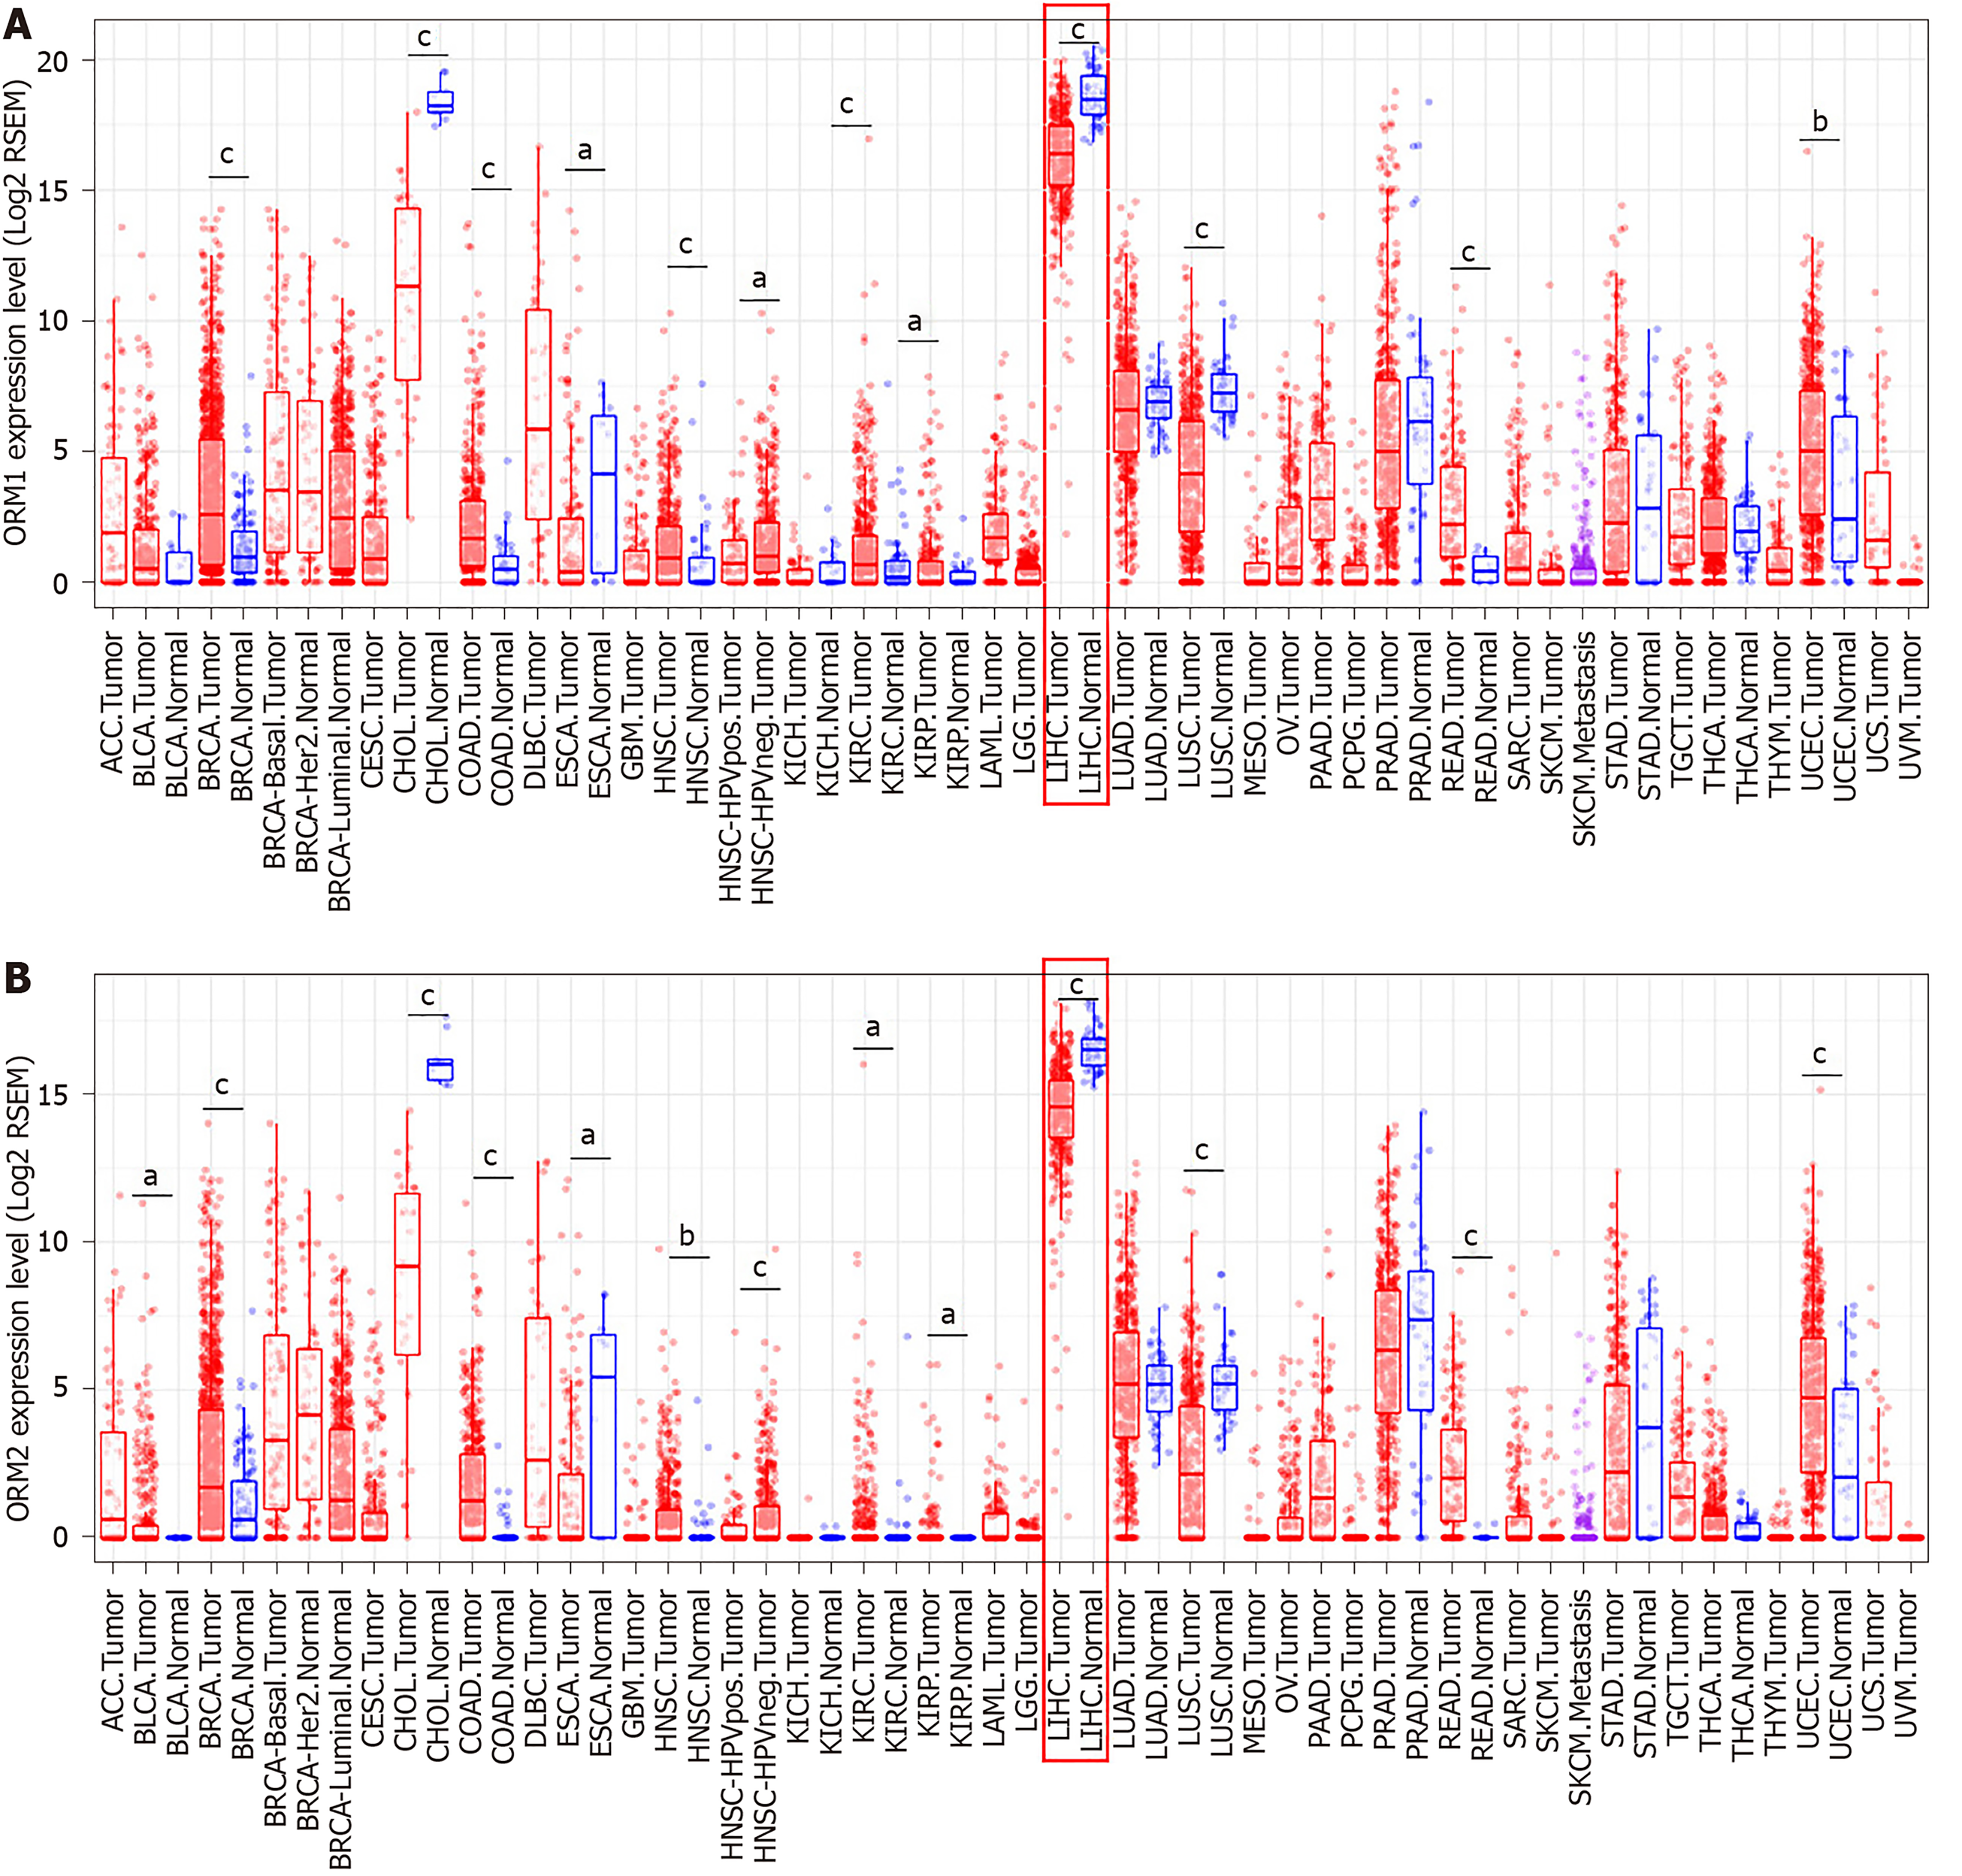
Figure 2 ORMs are downregulated in liver tumor tissues.
A and B: The different The Cancer Genome Atlas cancer databases were analyzed for orosomucoid 1 (ORM1) (A) and ORM2 (B) expression level differences between tumor and adjacent normal tissues. aP < 0.05, bP < 0.01, cP < 0.001 vs normal tissues, respectively. ACC: Adrenocortical carcinoma; BLCA: Bladder urothelial carcinoma; BRCA: Breast invasive carcinoma; CESC: Cervical squamous cell carcinoma and endocervical adenocarcinoma; CHOL: Cholangiocarcinoma; COAD: Colon adenocarcinoma; DLBC: Lymphoid neoplasm diffuse large B-cell lymphoma; ESCA: Esophageal carcinoma; GBM: Glioblastoma multiforme; HNSC: Head and neck squamous cell carcinoma; KICH: Kidney chromophobe; KIRC: Kidney renal clear cell carcinoma; KIRP: Kidney renal papillary cell carcinoma; LAML: Acute myeloid leukemia; LIHC: Liver hepatocellular carcinoma; LUAD: Lung adenocarcinoma; LUSC: Lung squamous cell carcinoma; MESO: Mesothelioma; OV: Ovarian serous cystadenocarcinoma; PAAD: Pancreatic adenocarcinoma; PCPG: Pheochromocytoma and Paraganglioma; PRAD: Prostate adenocarcinoma; READ: Rectum adenocarcinoma; SKCM: Skin cutaneous melanoma; STAD: Stomach adenocarcinoma; TGCT: Testicular germ cell tumors; THCA: Thyroid carcinoma; THYM: Thymoma; UCEC: Uterine corpus endometrial carcinoma; UCS: Uterine carcinosarcoma; UVM: Uveal melanoma.
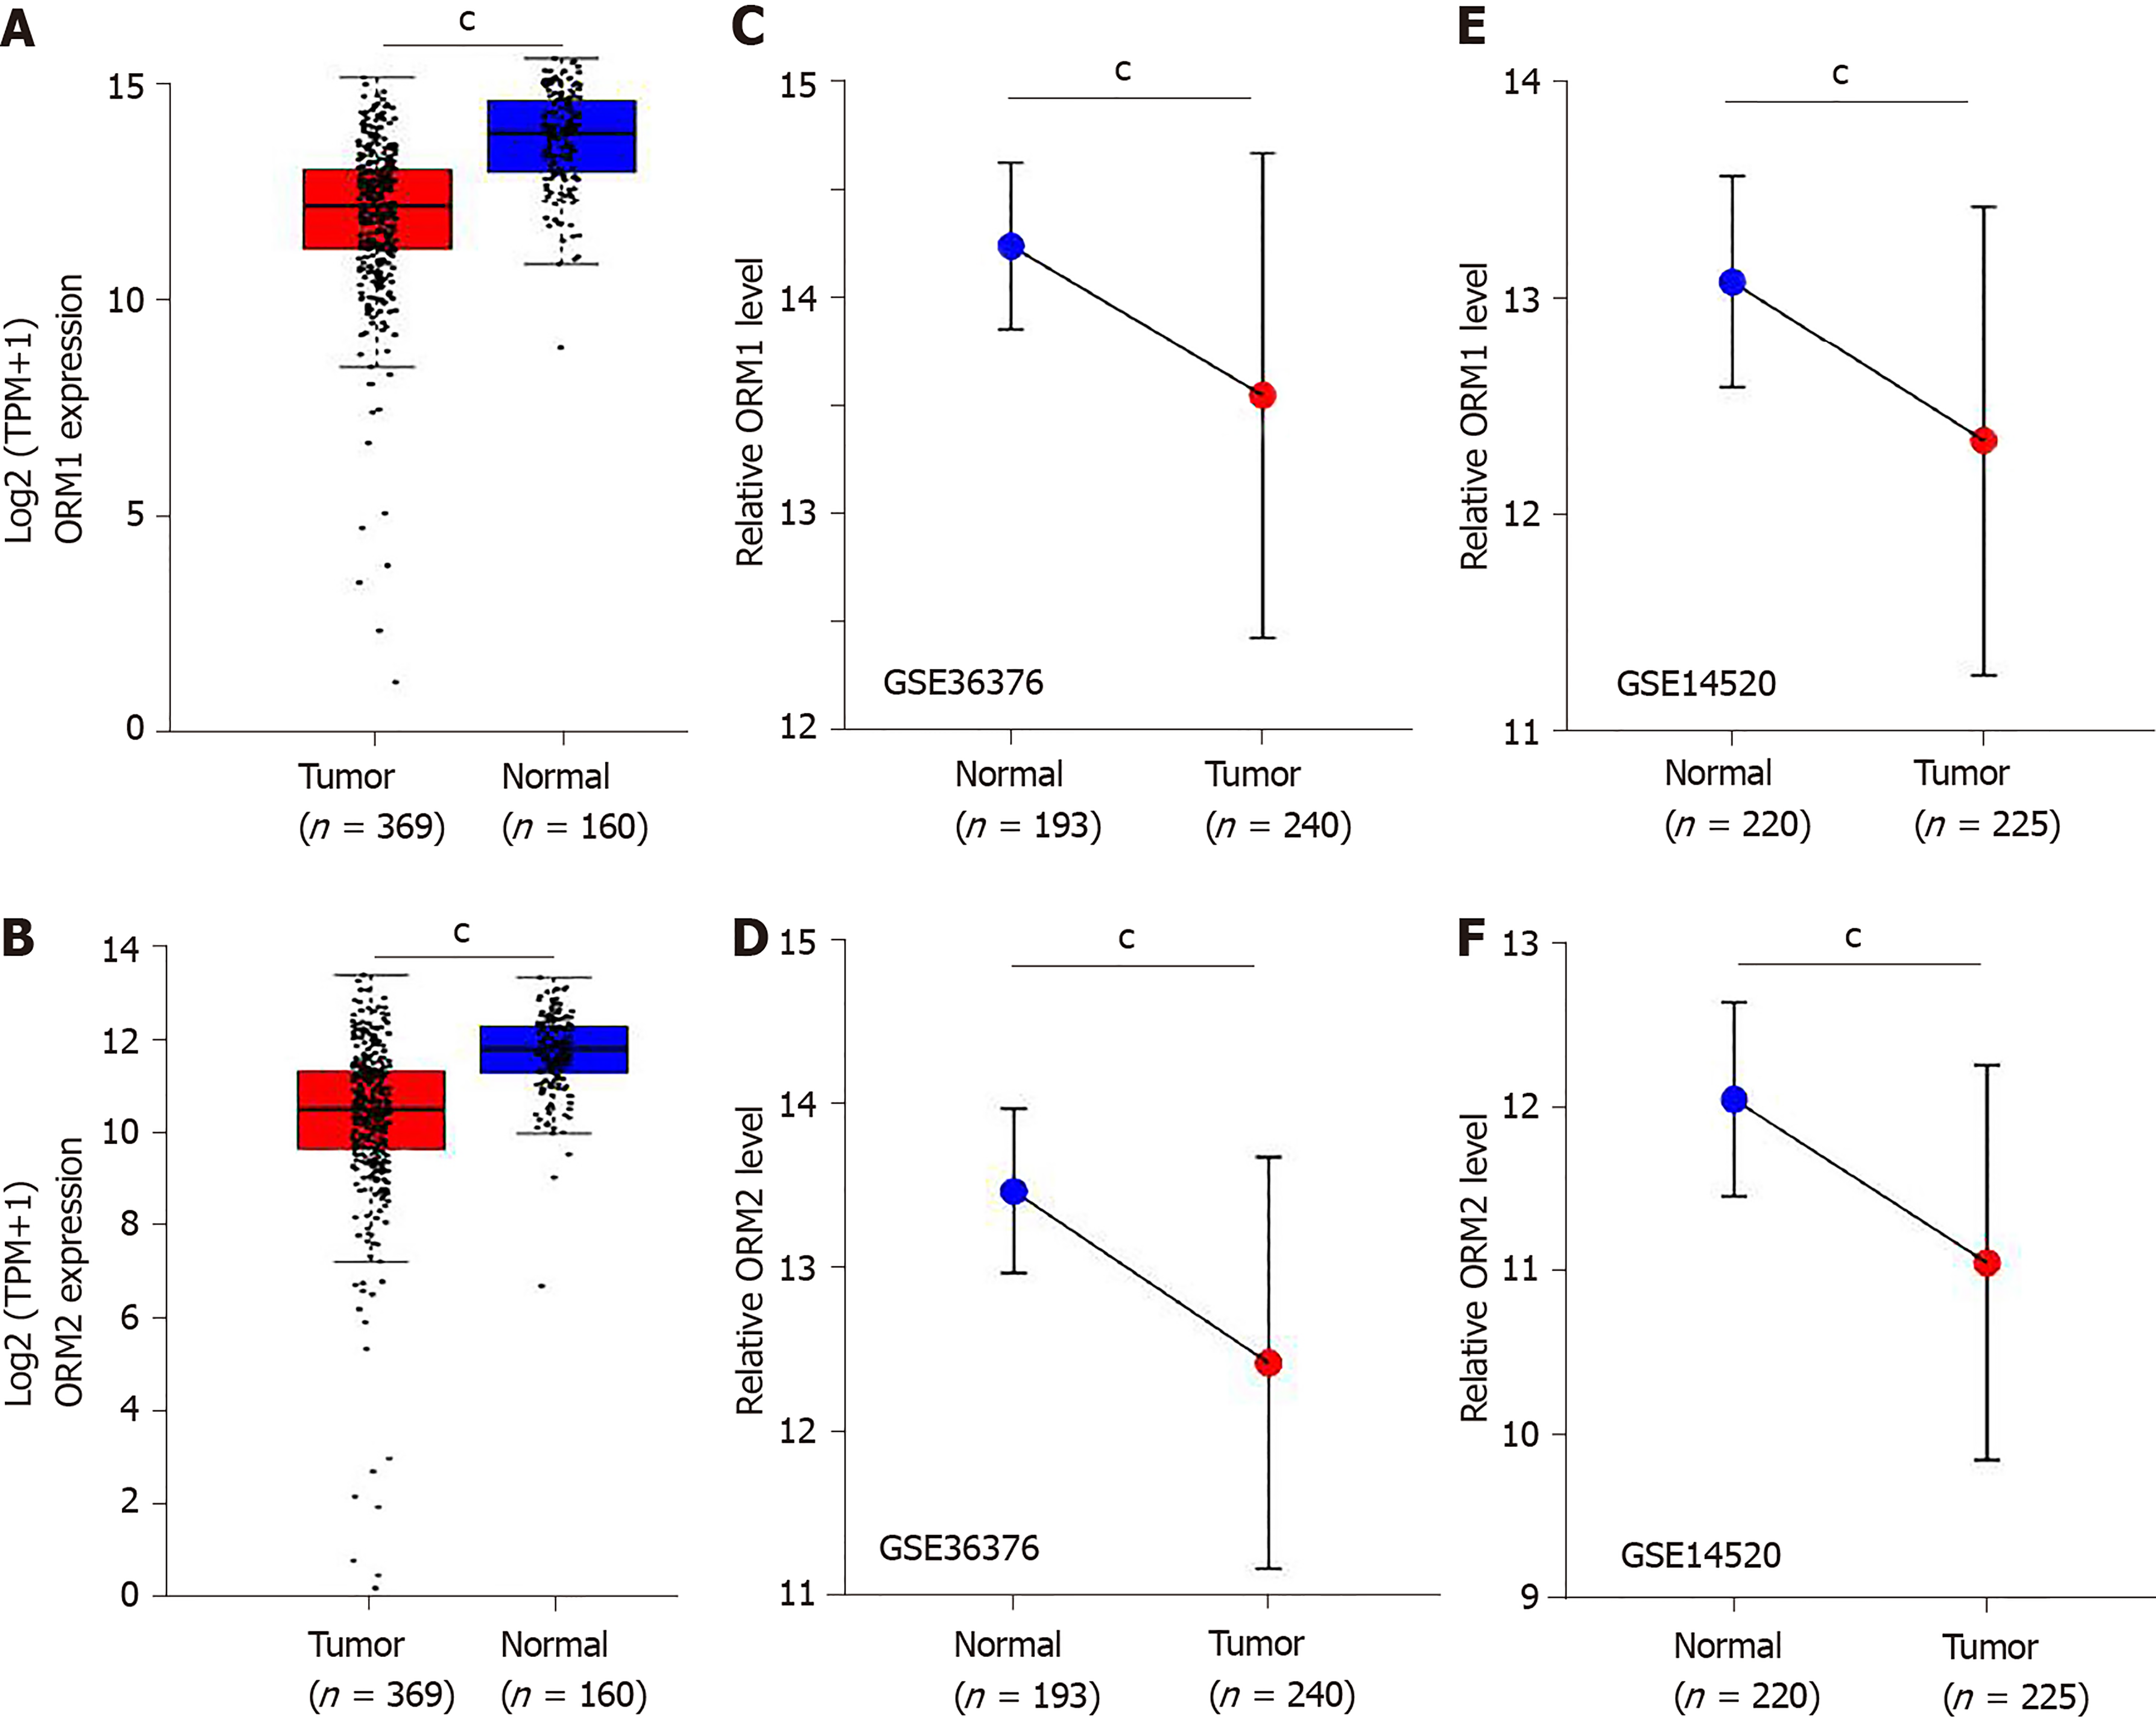
Figure 3 ORM expression is decreased in liver tumors.
A and B: The 369 liver tumor tissues, 160 cases of adjacent normal liver tissues and genotype tissue expression liver tissues were analyzed for orosomucoid 1 (ORM1) (A) and ORM2 (B) expression. C and D: The GSE36376 dataset was subjected to examination of ORM1 (C) and ORM2 (D) expression in 193 cases of normal liver tissues and 240 cases of liver tumor tissues. E and F: The GSE14520 dataset was subjected to examination of ORM1 (E) and ORM2 (F) expression in 220 cases of normal liver tissues and 225 cases of liver tumor tissues. cP < 0.001, tumor group compared with normal group. TPM: Transcript per million.
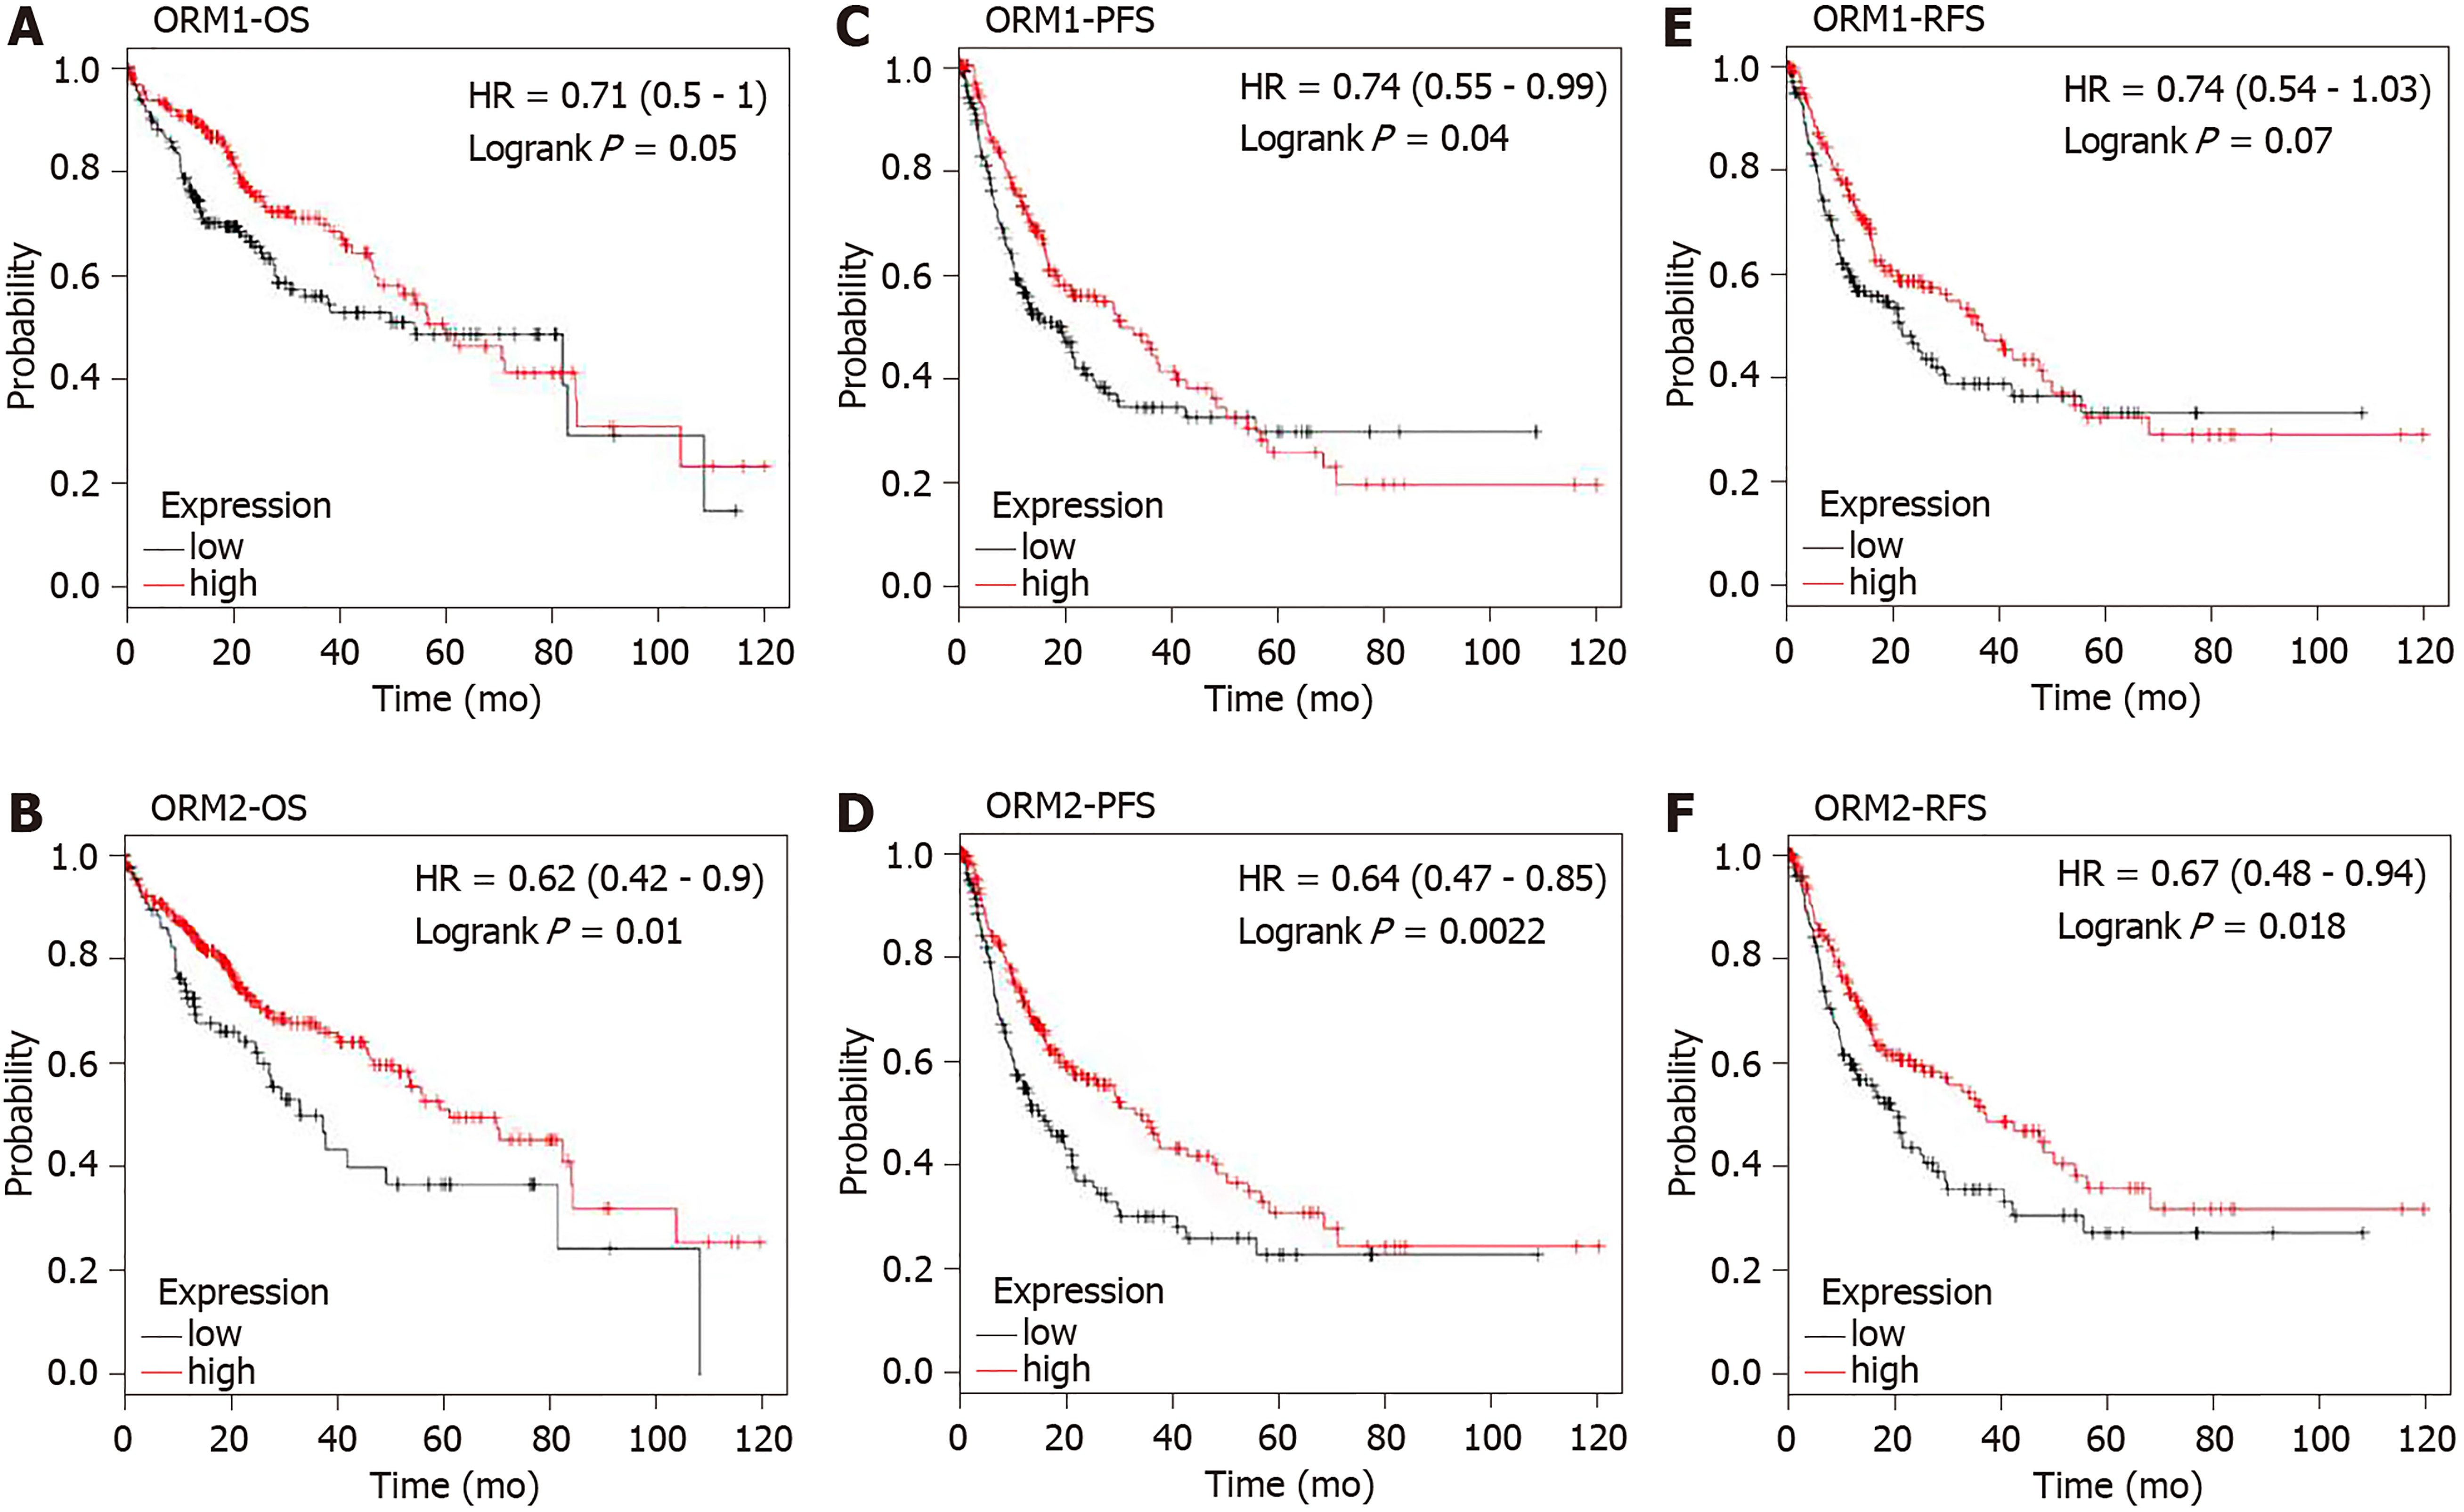
Figure 4 Liver cancer patients were subjected to examination of the overall survival, progression-free survival and relapse-free survival rates in orosomucoid high and low patient groups.
A and B: Overall survival rate was determined to study the effect of orosomucoid 1 (ORM1) and ORM2 on liver cancer patients. C and D: Progression-free survival rate analysis was used to evaluate the role of ORM1 and ORM2 in liver cancer patients. E and F: High and low ORM patient groups were studied to determine relapse-free survival rates. OS: Overall survival; PFS: Progression-free survival; RFS: Relapse-free survival.
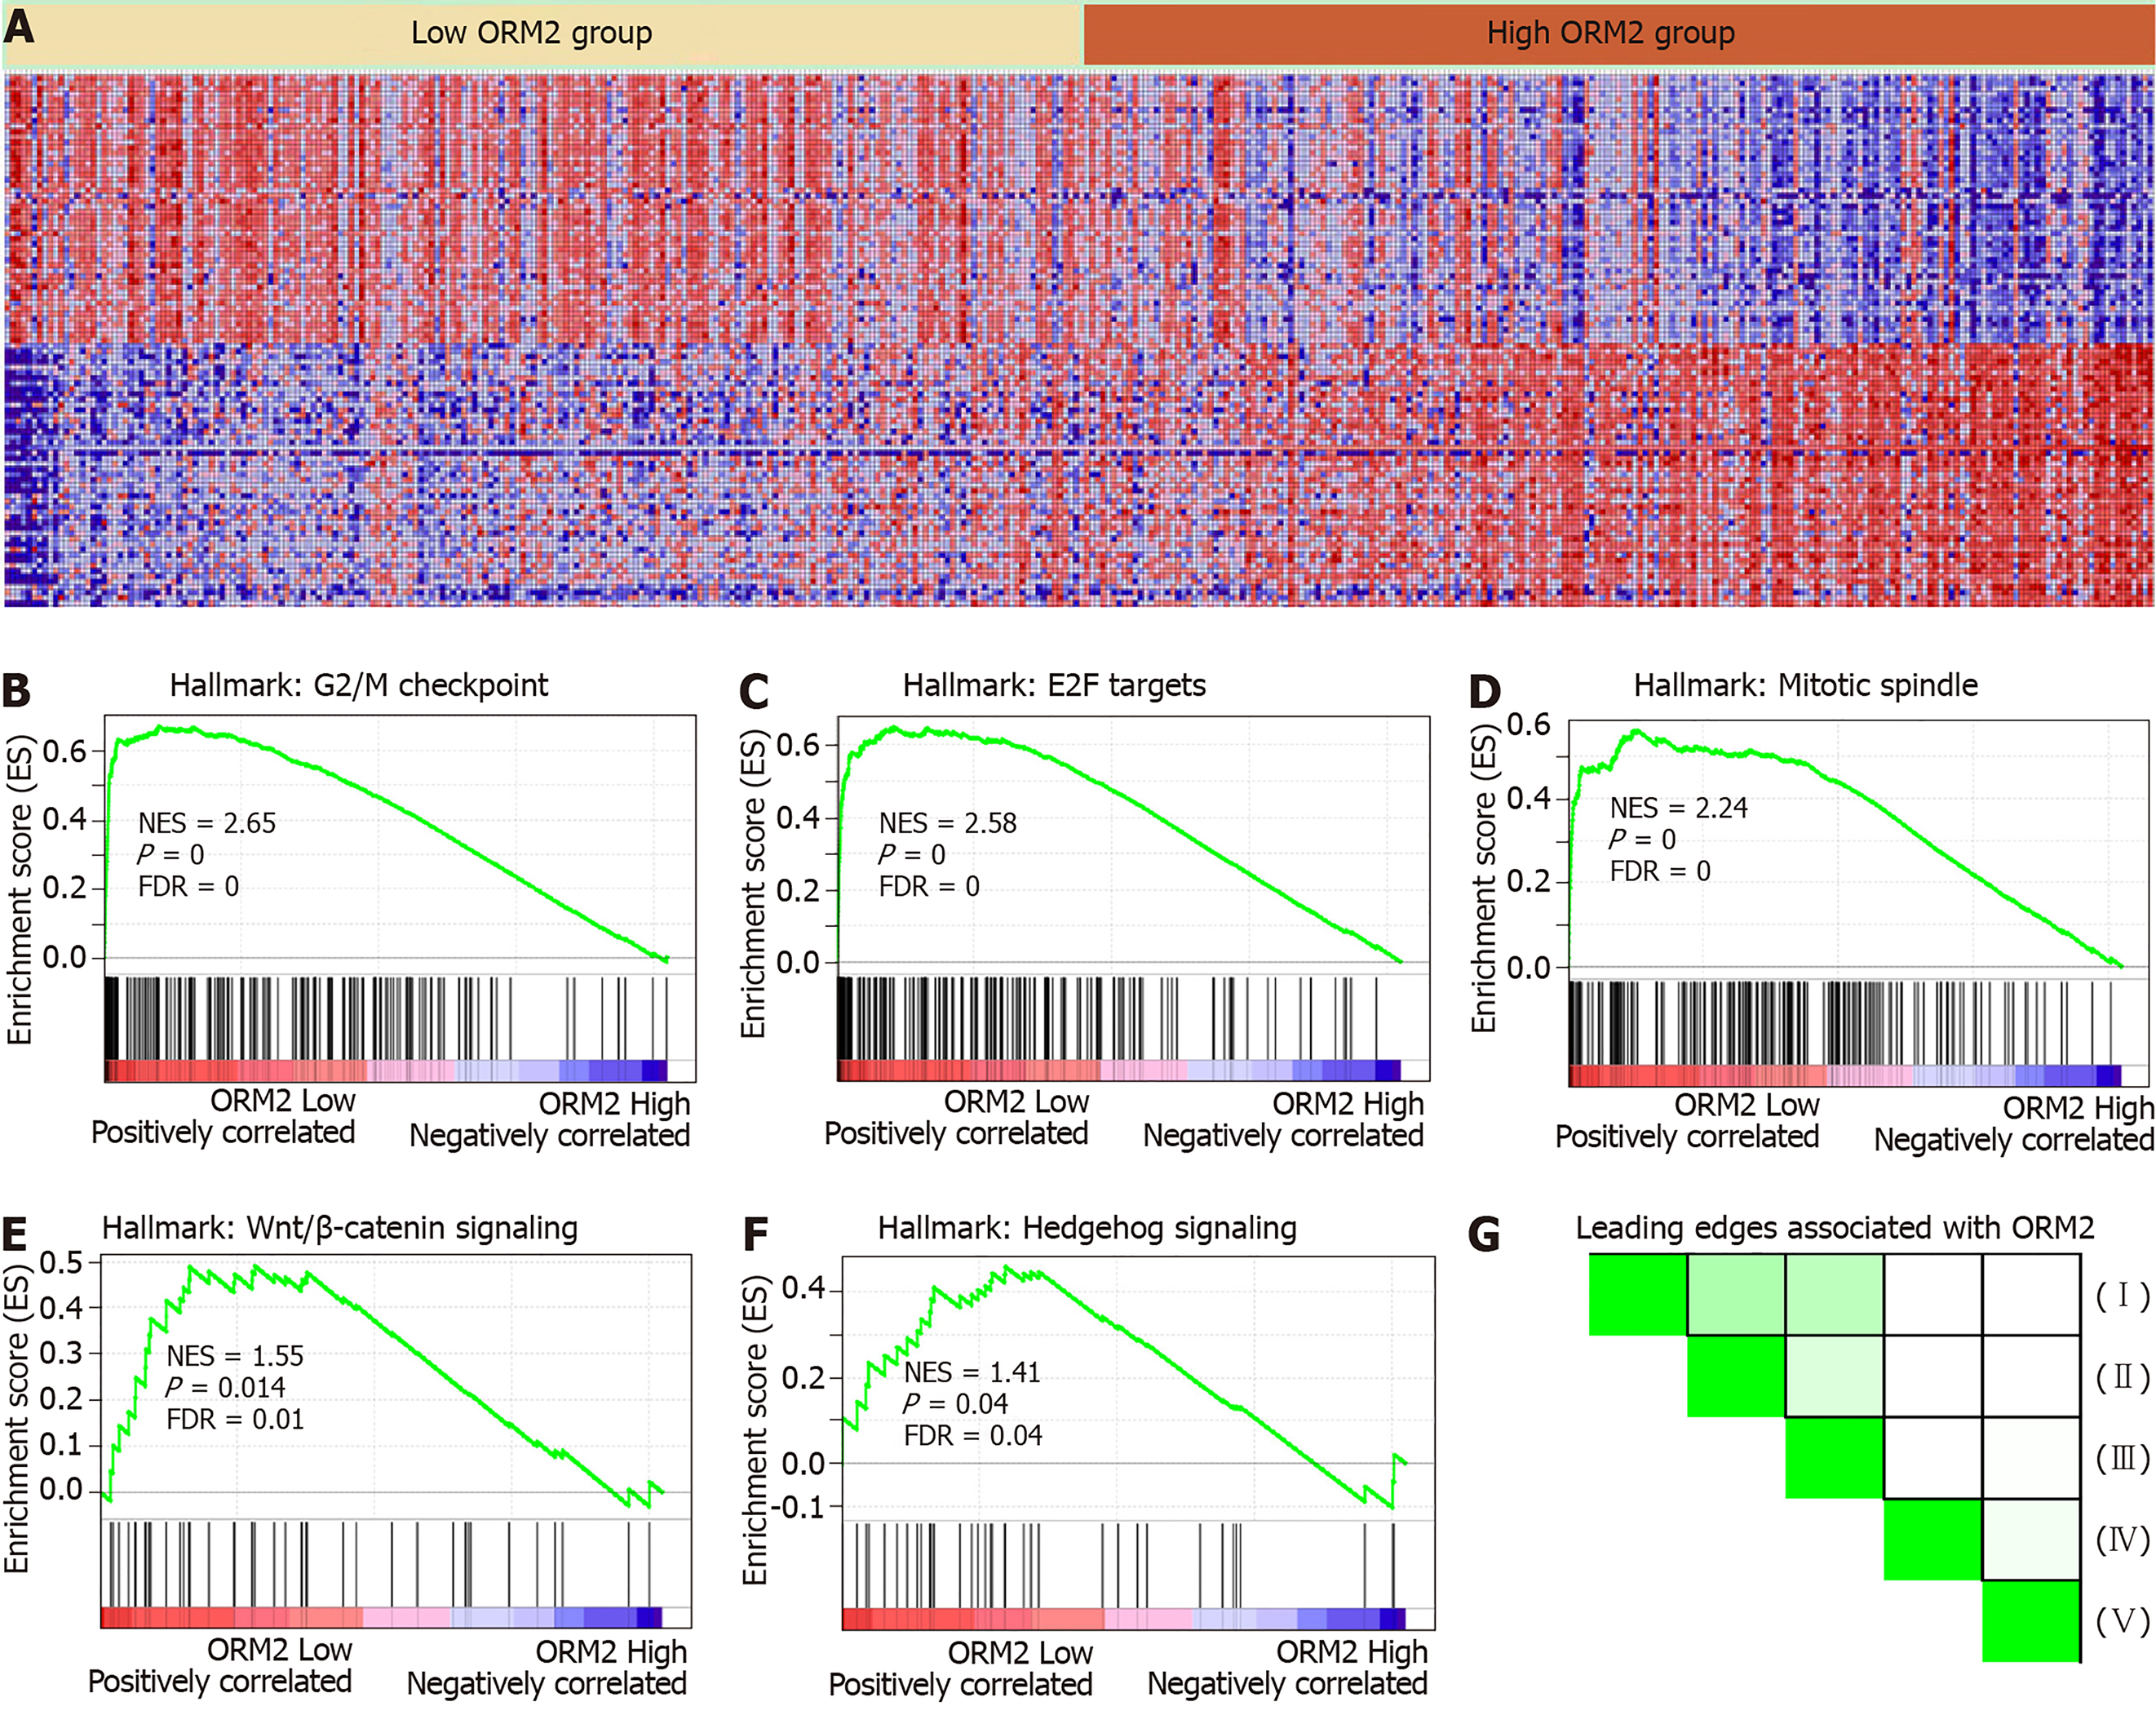
Figure 5 Gene enrichment analysis shows ORM2 downregulation is closely associated with cancer-promoting pathways.
A: Heatmap of the top 50 features for each phenotype in single ORM2 gene enrichment analysis in The Cancer Genome Atlas (TCGA) liver cancer database. B-F: Gene set enrichment analysis (GSEA) of ORM2 genes in the TCGA liver cancer database with the Hallmarks module. Enrichment signaling pathways are shown as G2/M checkpoint, E2F target signaling, mitotic spindle, Wnt/β-catenin and hedgehog signaling. G: Leading edges analysis of GSEA evaluations was performed on the ORM2 gene. I: G2/M checkpoint, II: E2F target signaling, III: Mitotic spindle, IV: Wnt/β-catenin signaling, V: Hedgehog signaling pathway.
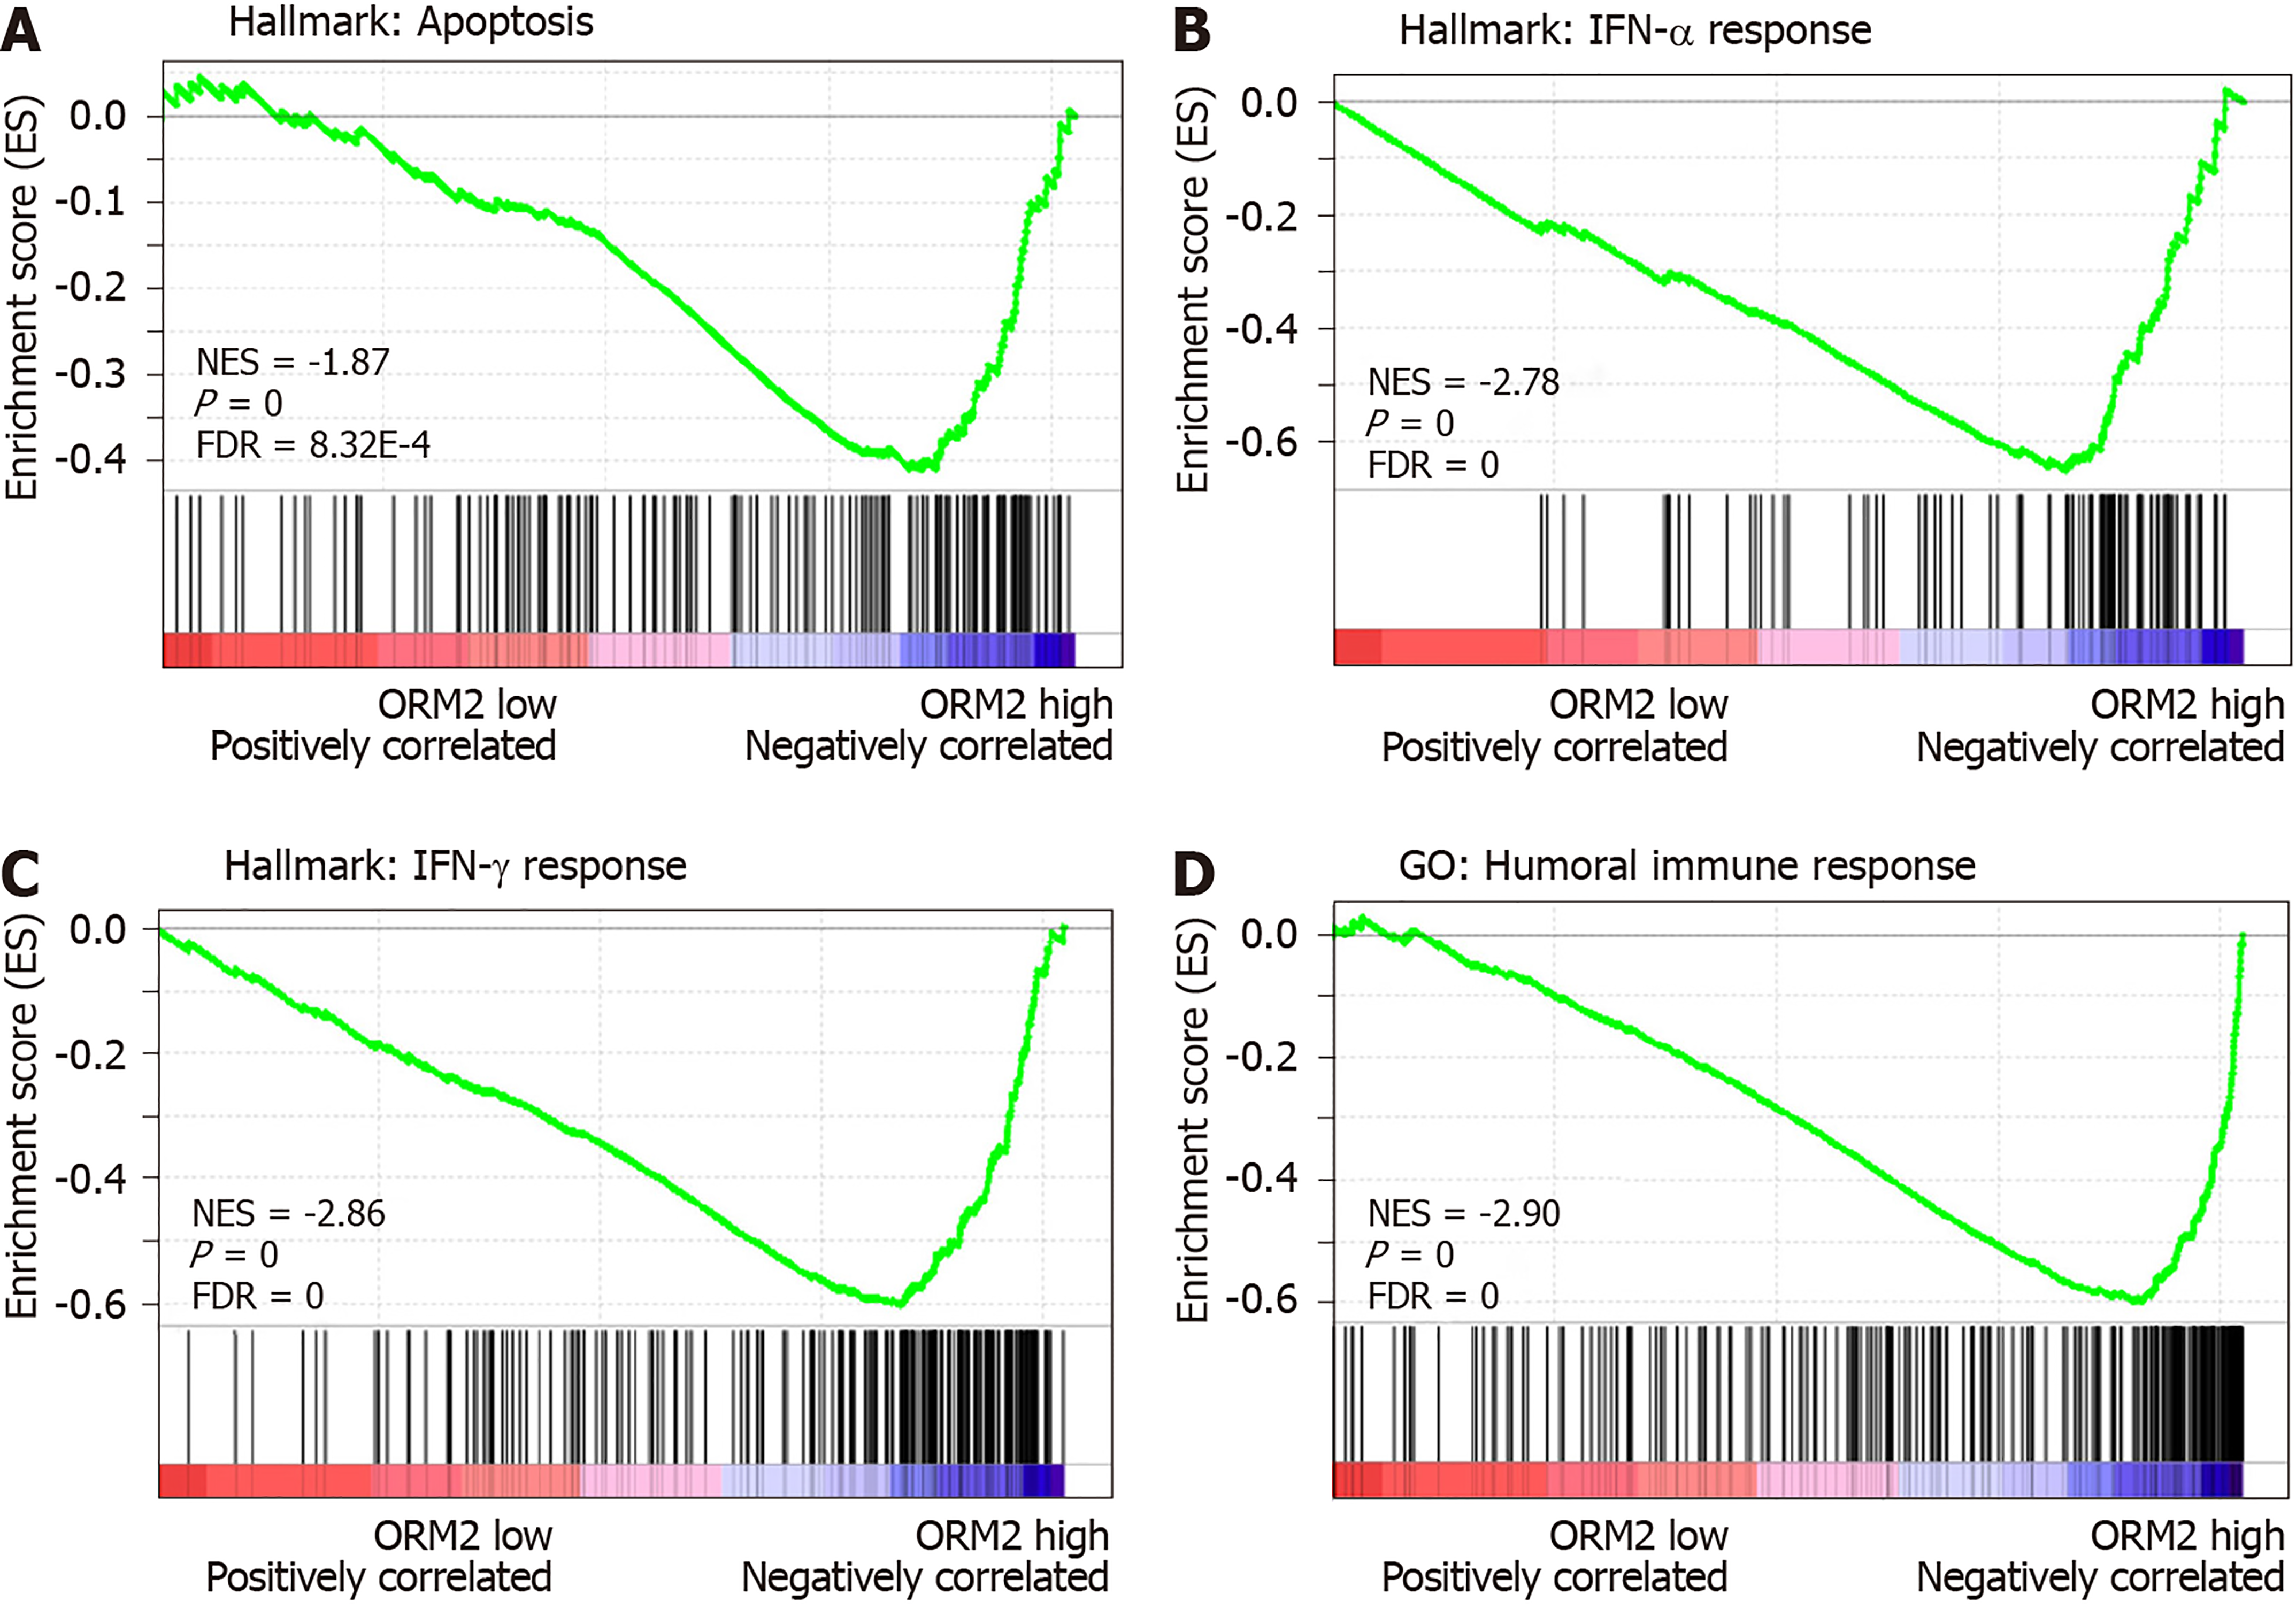
Figure 6 Orosomucoid 2 expression negatively correlates with the tumor immunity response.
A: The correlation between orosomucoid 2 (ORM2) and tumor apoptosis was examined using Gene Set Enrichment Analysis (GSEA). B and C: The enrichment analysis between ORM2 and the response of IFN treatment was subjected to hallmarks of GSEA. D: The Gene Ontology module of GSEA was used to examine the association between ORM2 and the humoral immune response. GO: Gene ontology; NES: Normalized enrichment score; FDR: False discovery rate; ORM2: Orosomucoid 2.
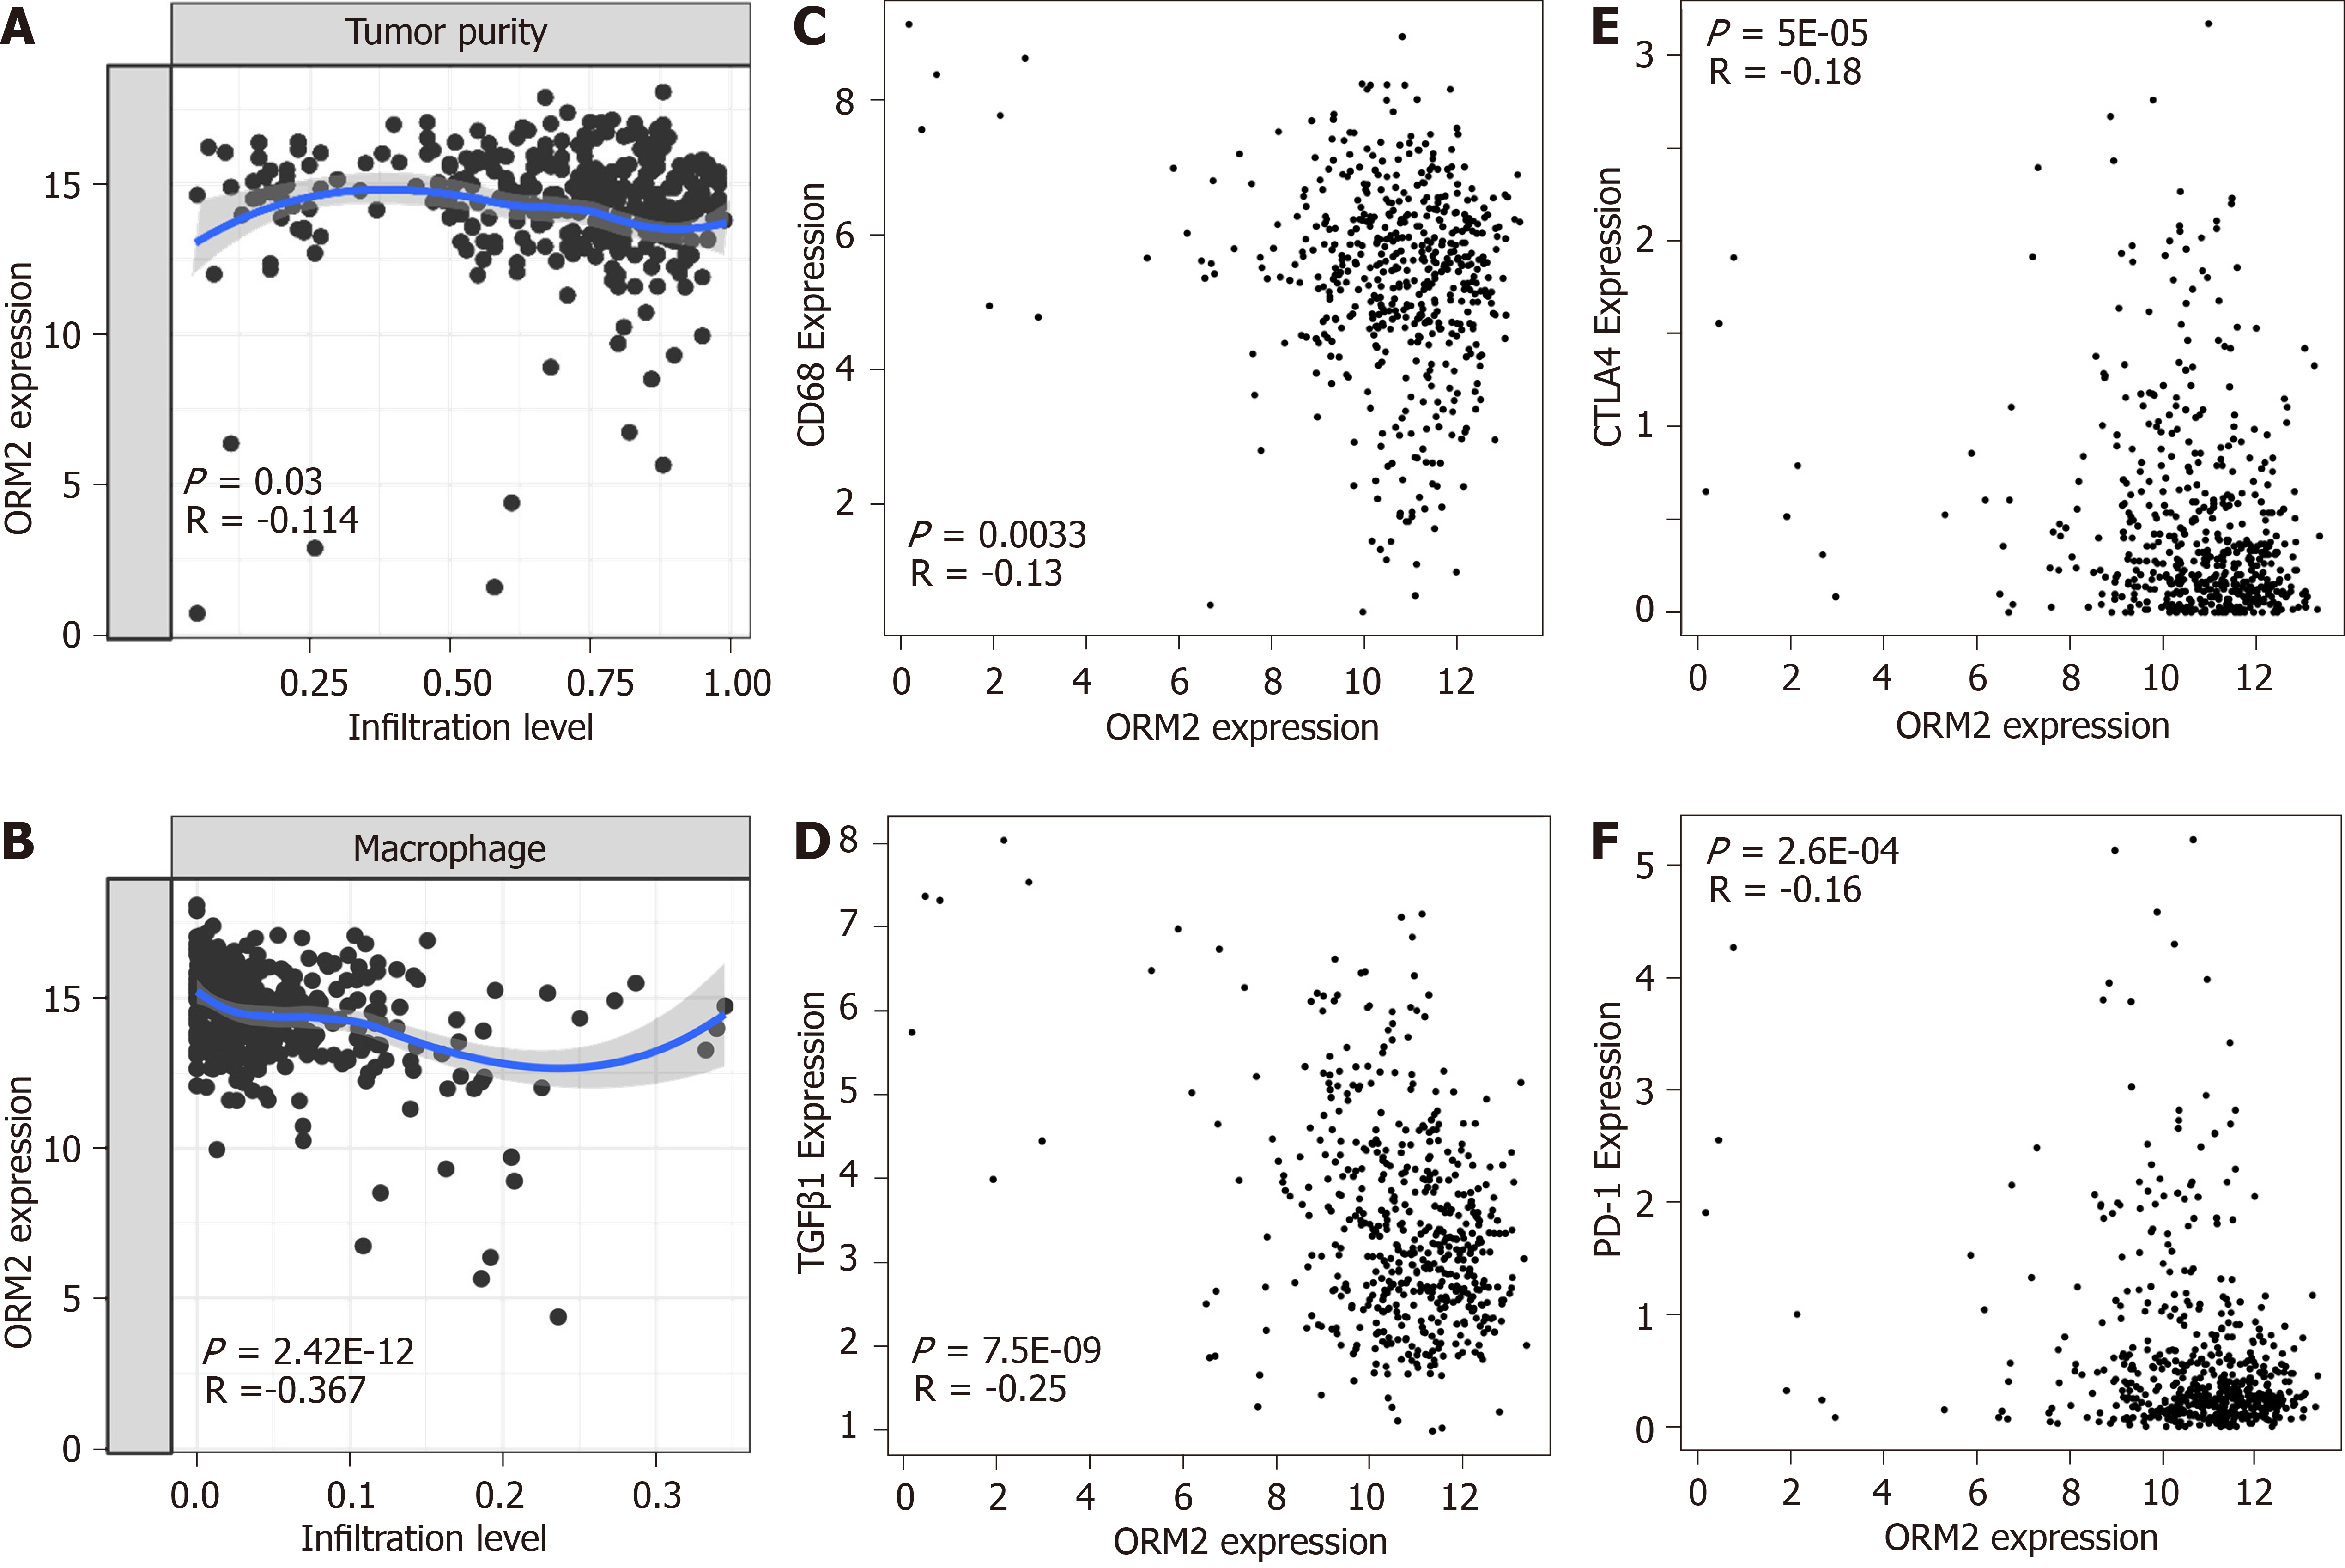
Figure 7 Decreased orosomucoid 2 is closely associated with immunosuppression in liver tumors.
A: Correlation between orosomucoid 2 (ORM2) expression and tumor purity and, B: Infiltration levels of macrophage cells in liver tumor tissues were determined using The Cancer Genome Atlas (TCGA) liver cancer data by the TIMER portal. C and D: Gene correlation between ORM2 and tumor-associated macrophage-related markers (including CD68 and TGFβ1) were subjected to examination in the TCGA liver tumors, adjacent liver tissues and genotype-tissue expression portal (GTEx) liver tissues with the GEPIA portal. E-F: Correlation of ORM2 and immune checkpoints were evaluated in the TCGA liver tumors, adjacent liver tissues and GTEx liver tissues with the GEPIA portal. ORM2: Orosomucoid 2.
- Citation: Zhu HZ, Zhou WJ, Wan YF, Ge K, Lu J, Jia CK. Downregulation of orosomucoid 2 acts as a prognostic factor associated with cancer-promoting pathways in liver cancer. World J Gastroenterol 2020; 26(8): 804-817
- URL: https://www.wjgnet.com/1007-9327/full/v26/i8/804.htm
- DOI: https://dx.doi.org/10.3748/wjg.v26.i8.804


