Copyright
©The Author(s) 2020.
World J Gastroenterol. Feb 7, 2020; 26(5): 466-477
Published online Feb 7, 2020. doi: 10.3748/wjg.v26.i5.466
Published online Feb 7, 2020. doi: 10.3748/wjg.v26.i5.466
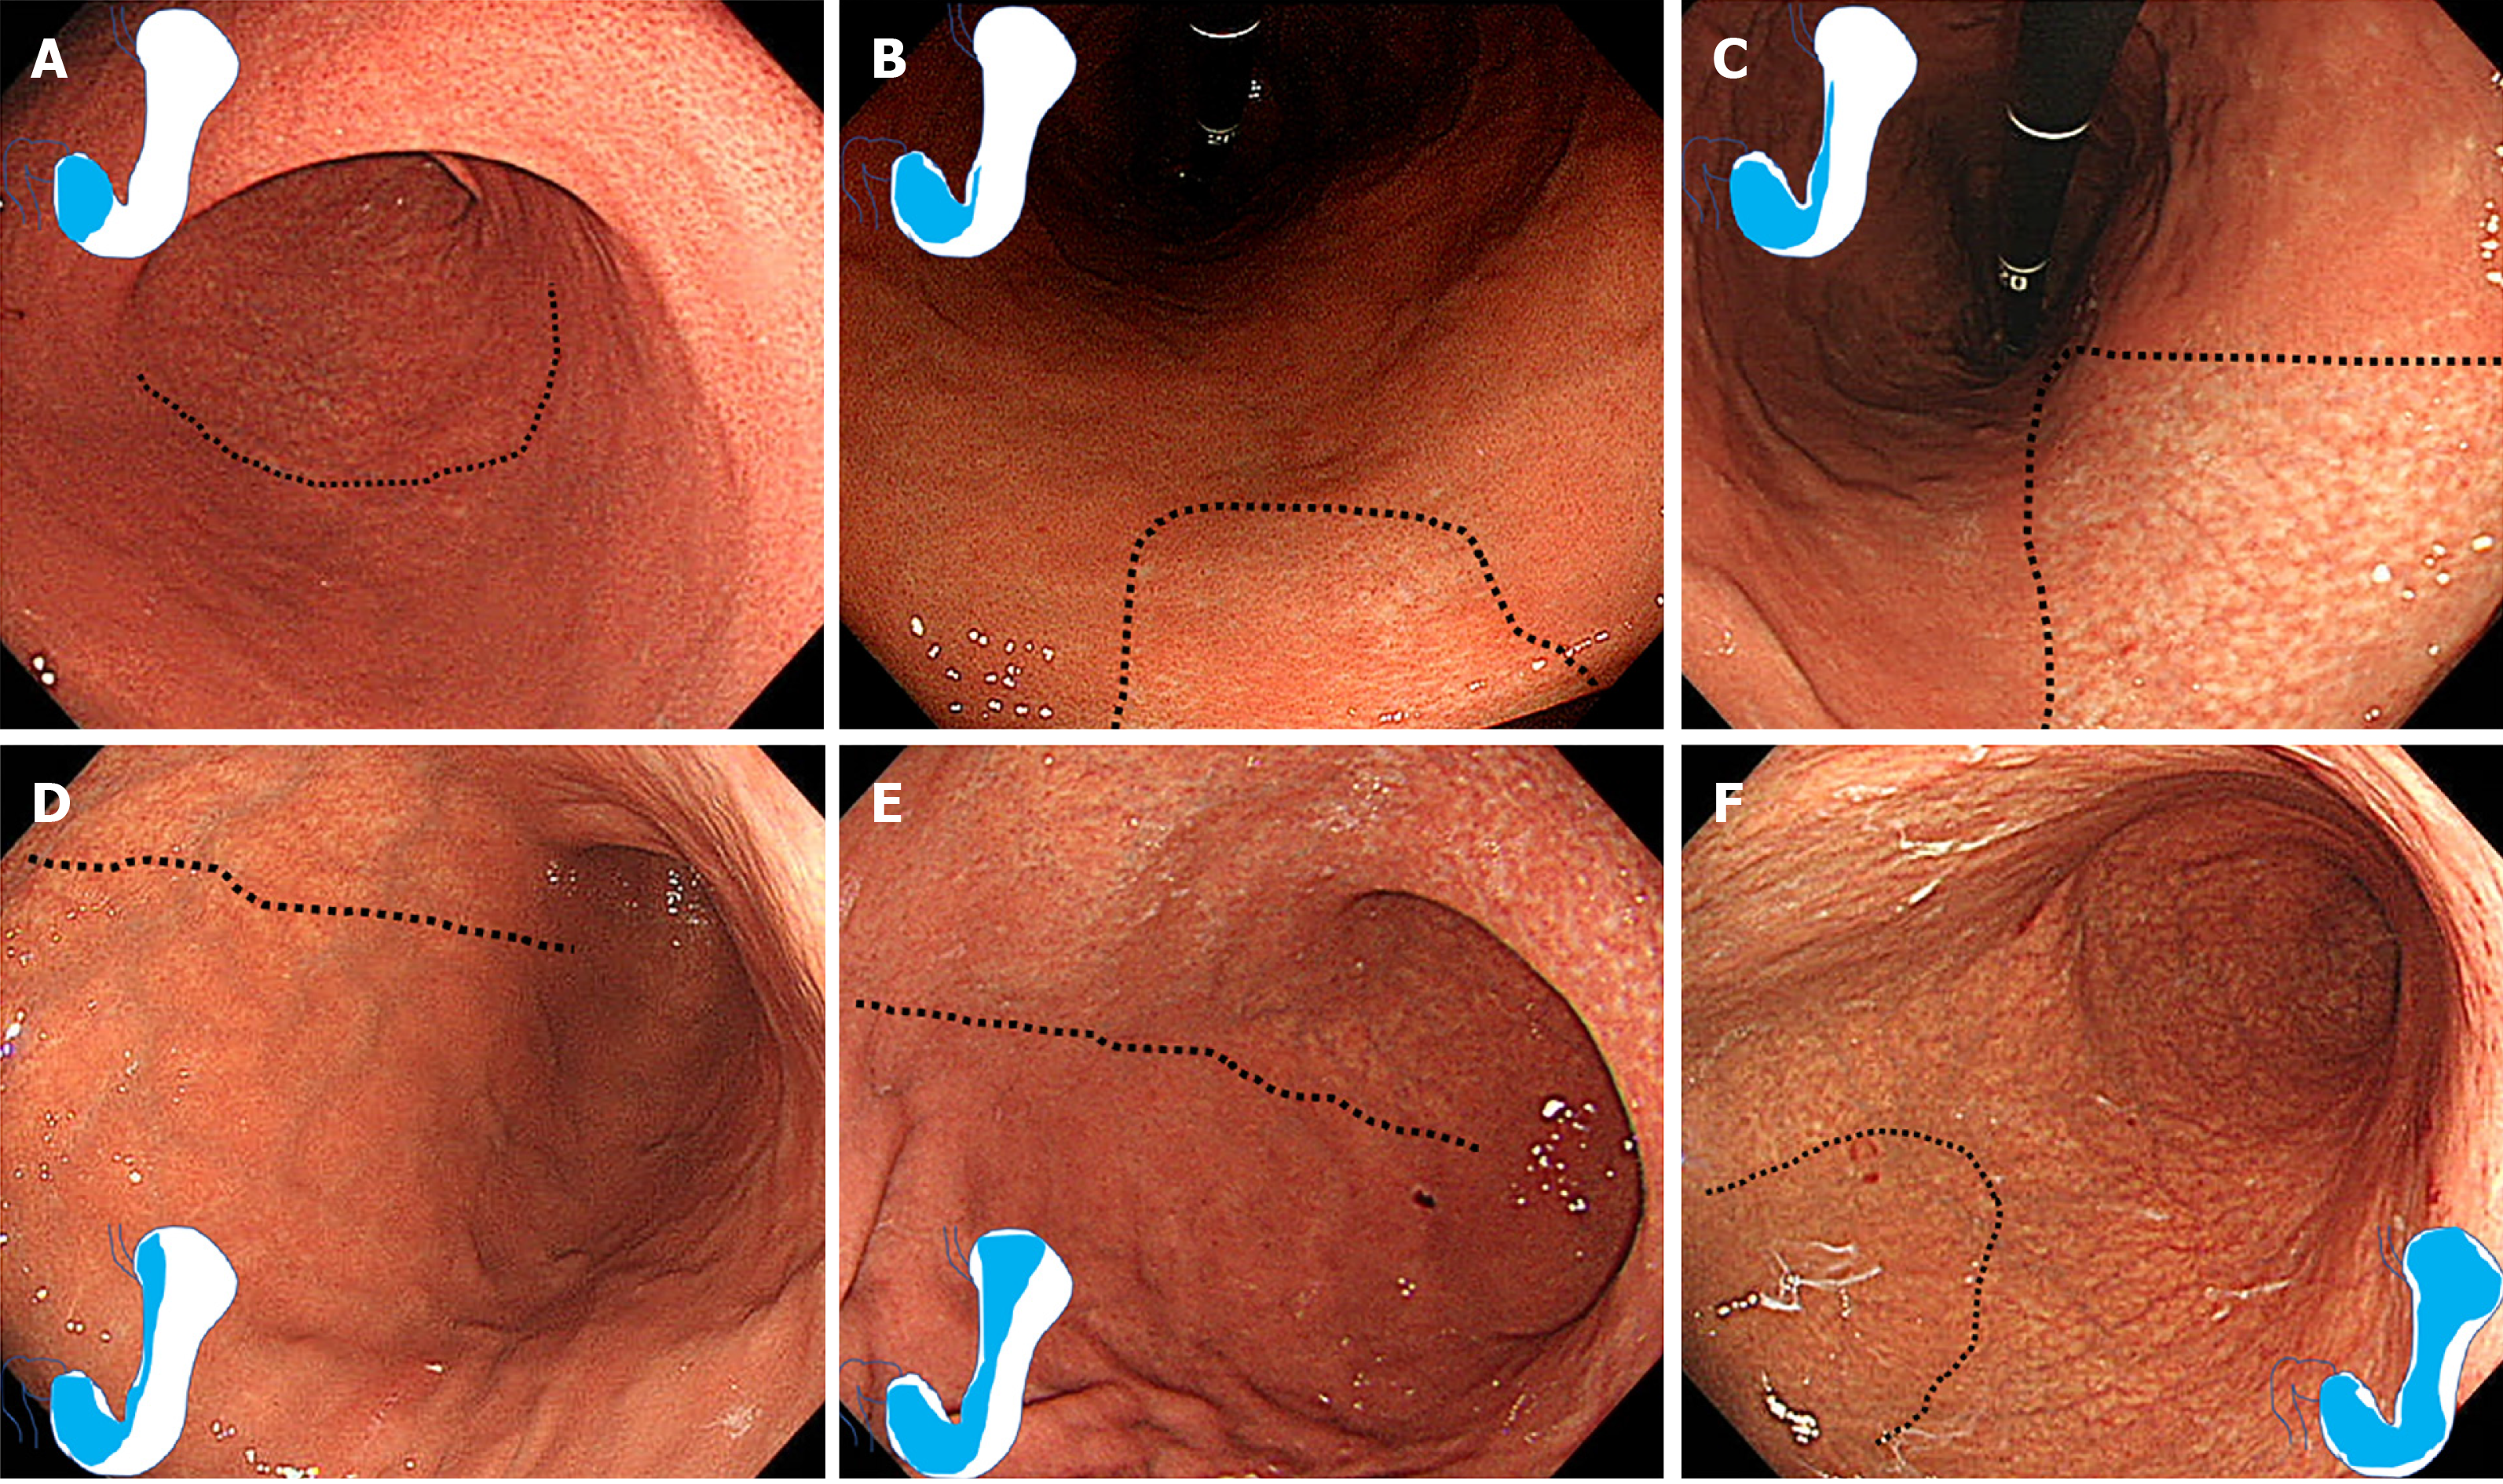
Figure 1 Kimura-Takemoto classification of endoscopic atrophy.
Atrophic borders are indicated by a dotted line. A: C1 (Atrophy is limited to the antrum); B: C2 (Atrophy is limited to the minor area of the lesser curvature of the body); C: C3 (Atrophy exists in the major area of the lesser curvature of the body but does not extend beyond the cardia); D: O1 (Atrophy extends to the fundus over the cardia. Atrophic border of the body lies between the lesser curvature and anterior wall); E: O2 (Atrophic border of the body lies on the anterior wall); F: O3 (Atrophy is widespread with the border between the anterior wall and greater curvature).
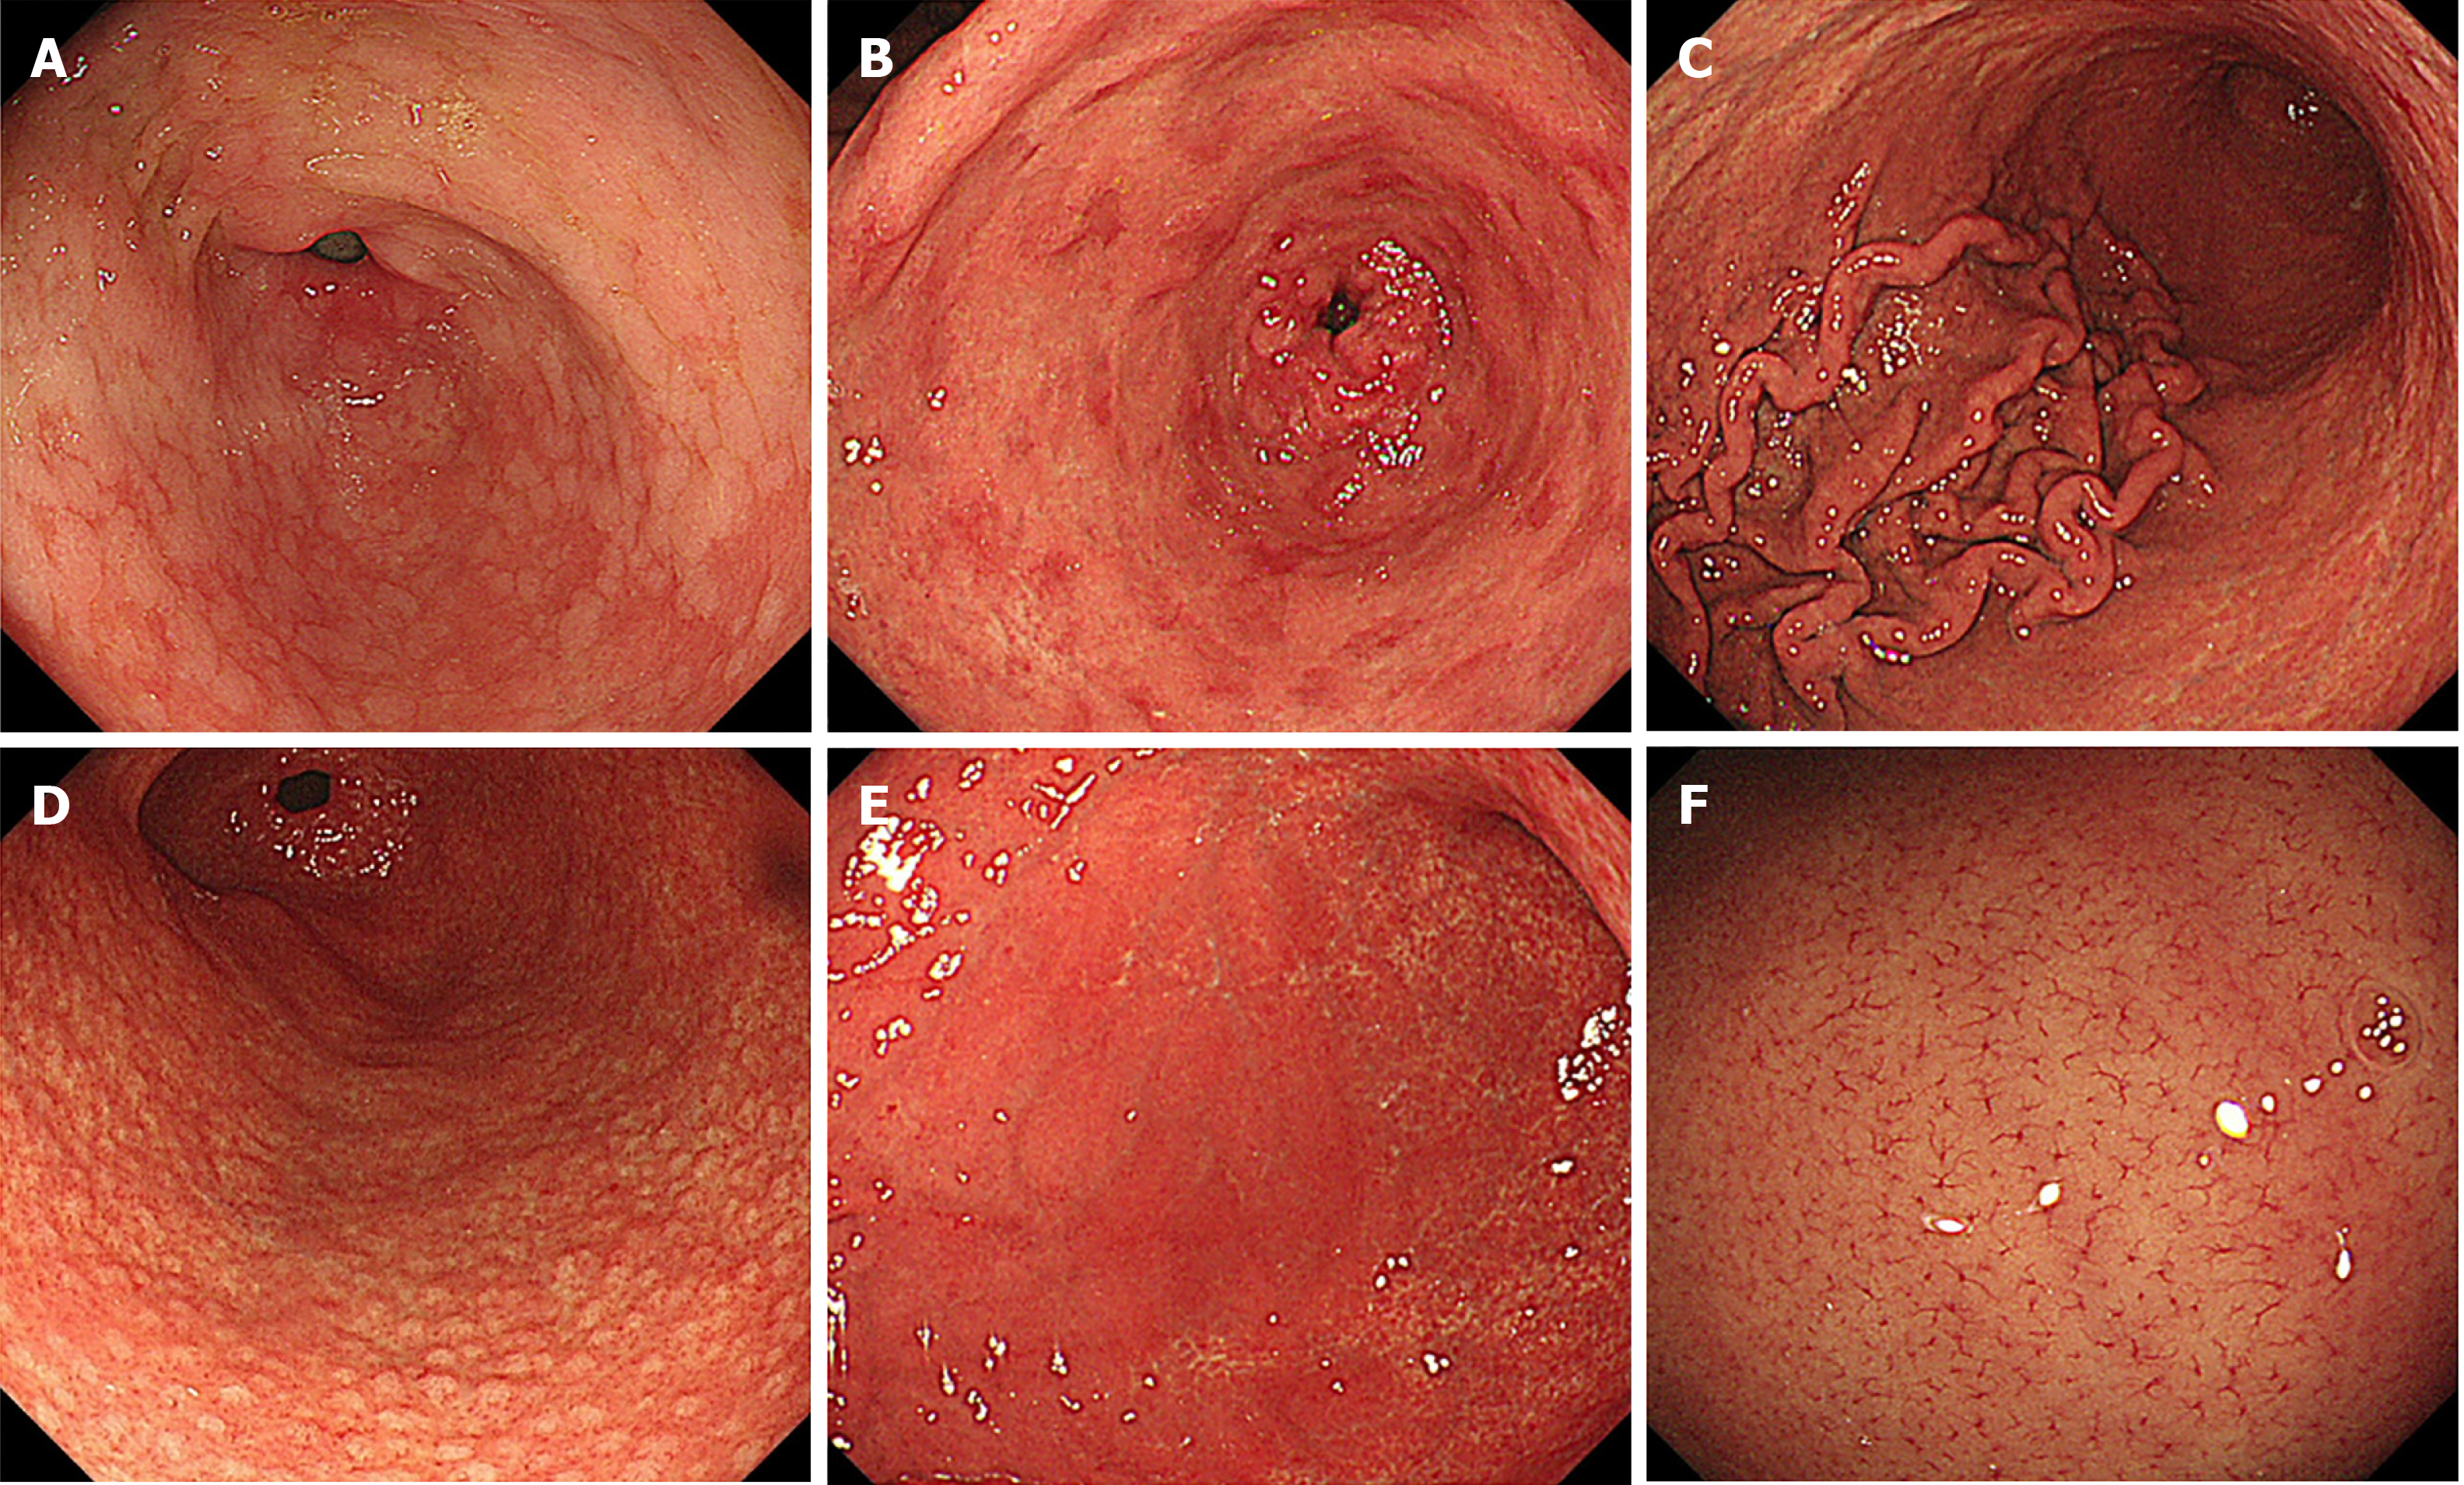
Figure 2 Endoscopic findings of Kyoto classification.
A: Intestinal metaplasia; B: Map-like redness; C: Enlarged folds; D: Nodularity; E: Diffuse redness; F: Regular arrangement of collecting venules in weakly magnified image.
- Citation: Toyoshima O, Nishizawa T, Koike K. Endoscopic Kyoto classification of Helicobacter pylori infection and gastric cancer risk diagnosis. World J Gastroenterol 2020; 26(5): 466-477
- URL: https://www.wjgnet.com/1007-9327/full/v26/i5/466.htm
- DOI: https://dx.doi.org/10.3748/wjg.v26.i5.466


