Copyright
©The Author(s) 2020.
World J Gastroenterol. Sep 28, 2020; 26(36): 5484-5497
Published online Sep 28, 2020. doi: 10.3748/wjg.v26.i36.5484
Published online Sep 28, 2020. doi: 10.3748/wjg.v26.i36.5484
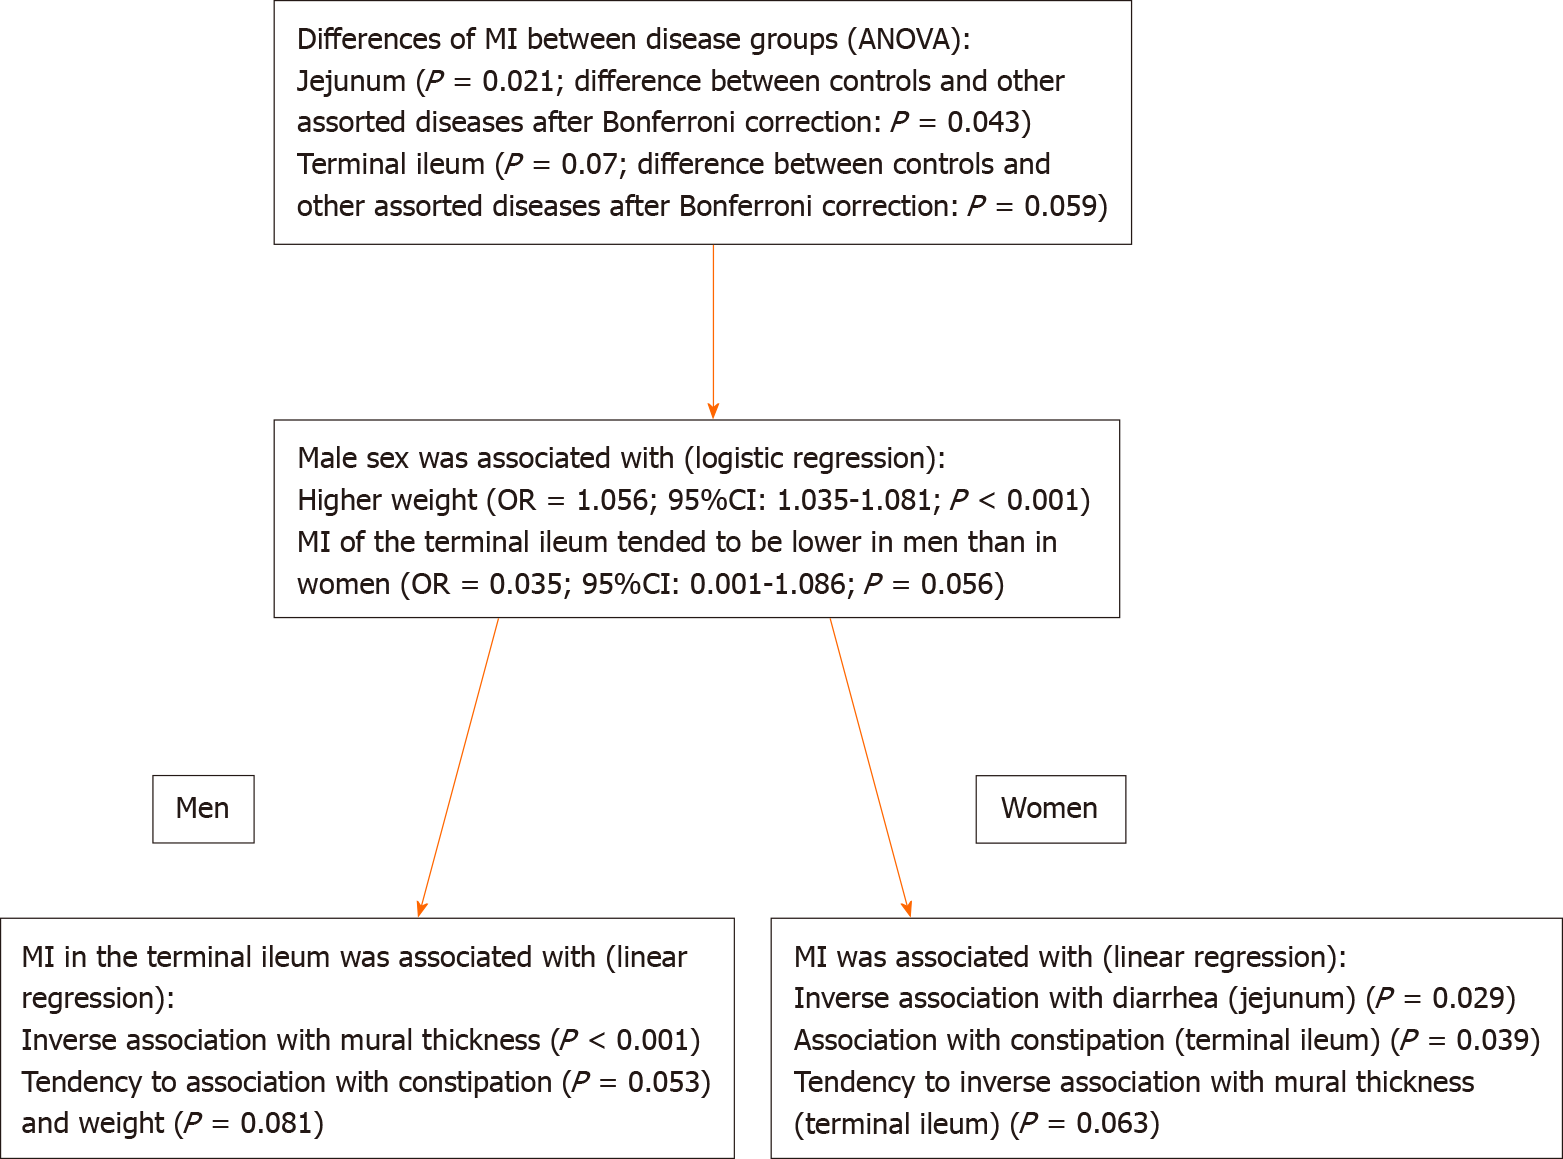
Figure 1 Flow chart over the statistical calculations and main results of the study.
P < 0.05 was considered statistically significant. MI: Motility index.
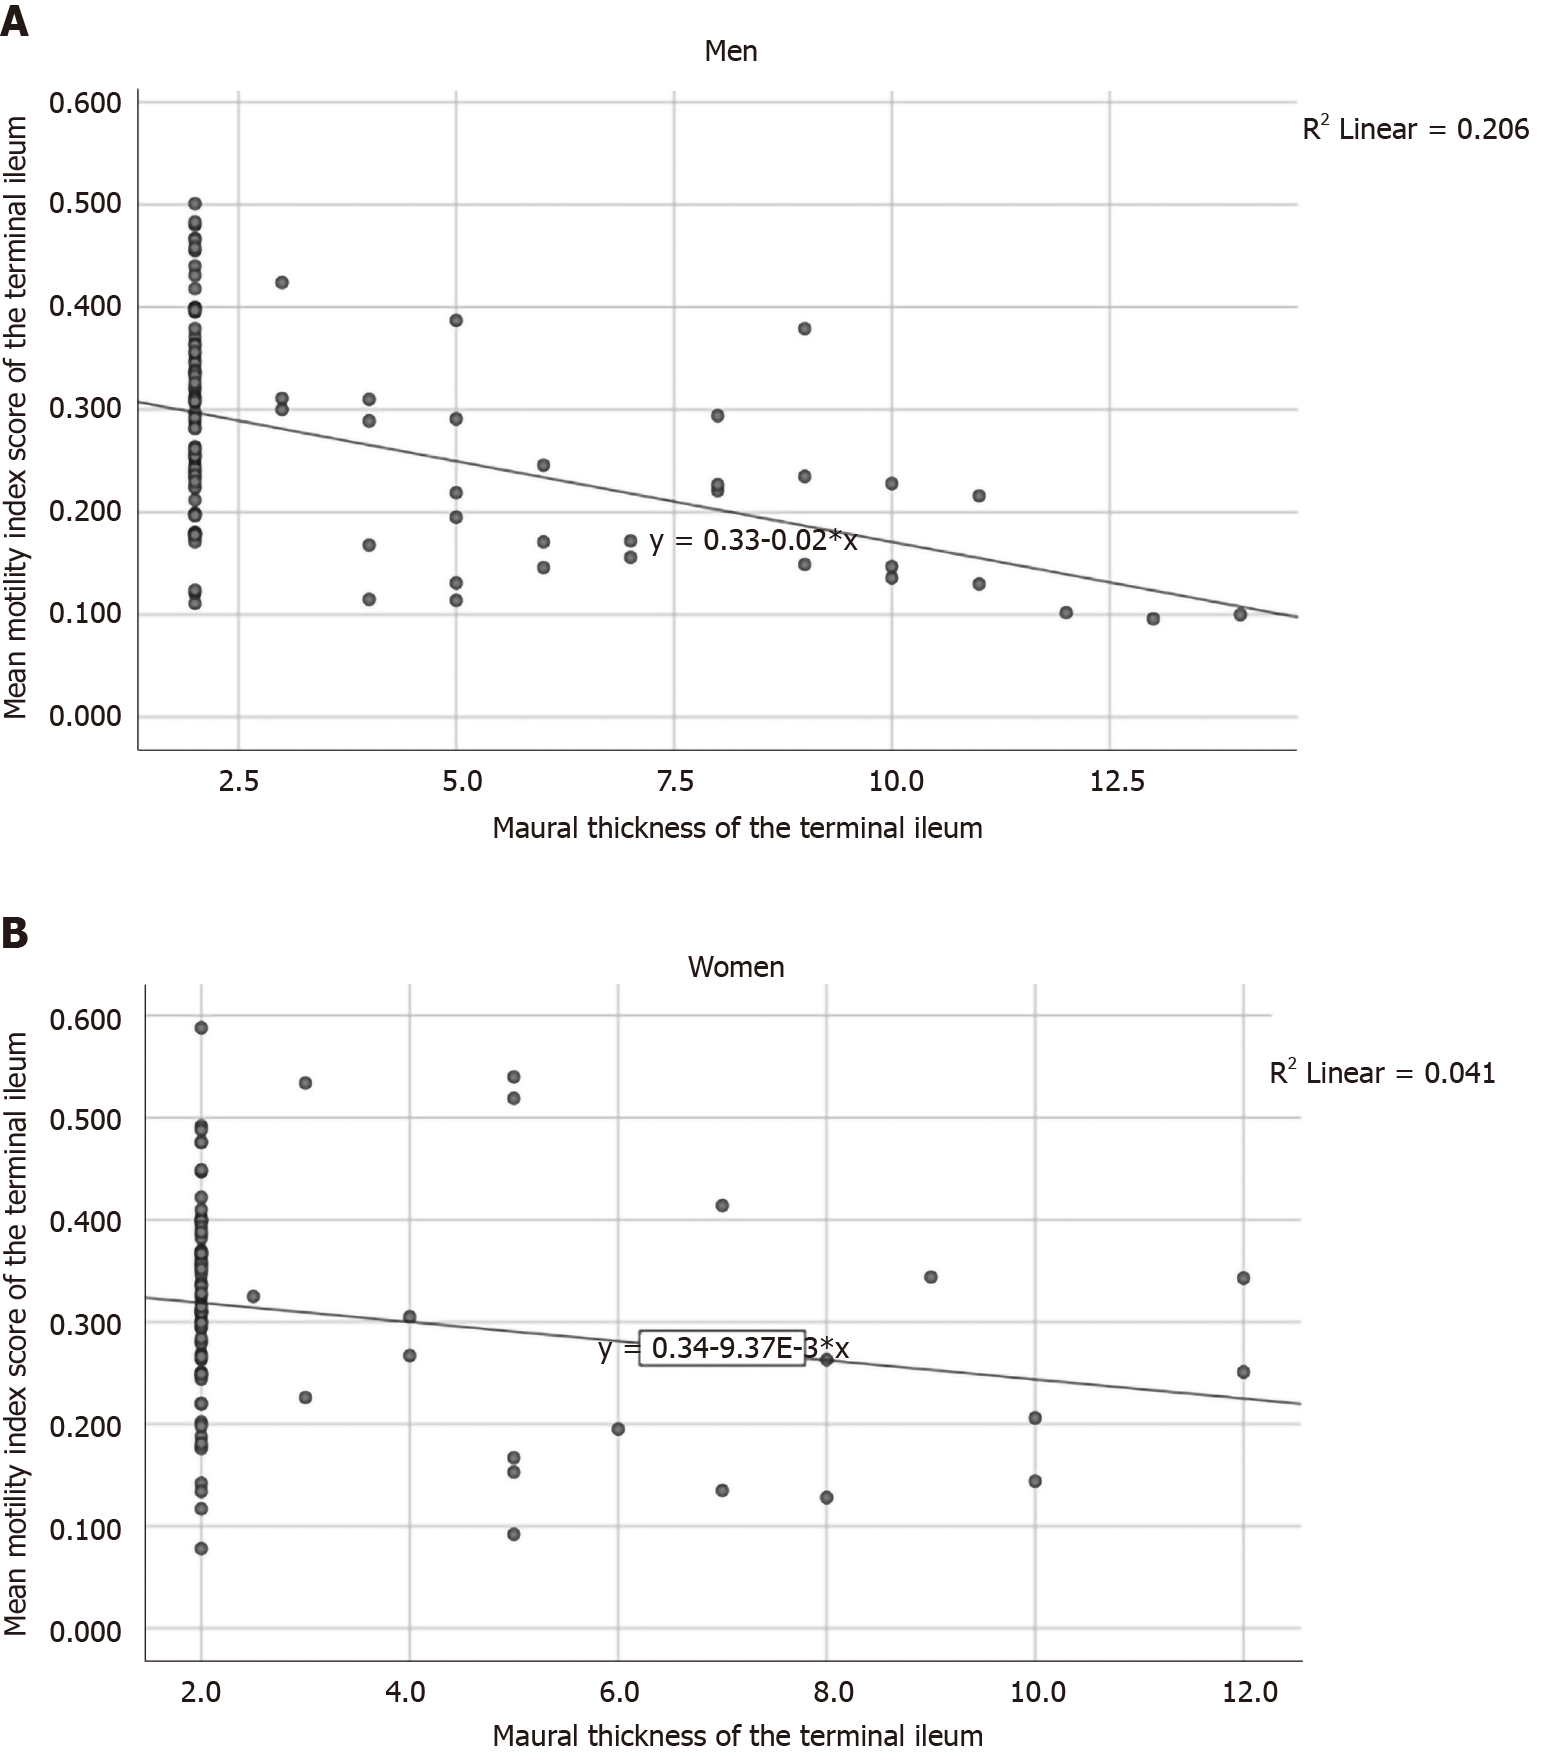
Figure 2 Correlation between the motility index in arbitrary units and the mural thickness (mm) of the terminal ileum in logarithmic values.
A: Men (r = -0.449, P < 0.001); B: Women (r = -0.204, P = 0.055). P < 0.05 was considered statistically significant. Graphs originally calculated in SPSS, 150 dpi, and later modified in power point.
- Citation: Månsson S, Ekberg O, Ohlsson B. Motility index measured by magnetic resonance enterography is associated with sex and mural thickness. World J Gastroenterol 2020; 26(36): 5484-5497
- URL: https://www.wjgnet.com/1007-9327/full/v26/i36/5484.htm
- DOI: https://dx.doi.org/10.3748/wjg.v26.i36.5484


