Copyright
©The Author(s) 2020.
World J Gastroenterol. Sep 28, 2020; 26(36): 5420-5436
Published online Sep 28, 2020. doi: 10.3748/wjg.v26.i36.5420
Published online Sep 28, 2020. doi: 10.3748/wjg.v26.i36.5420
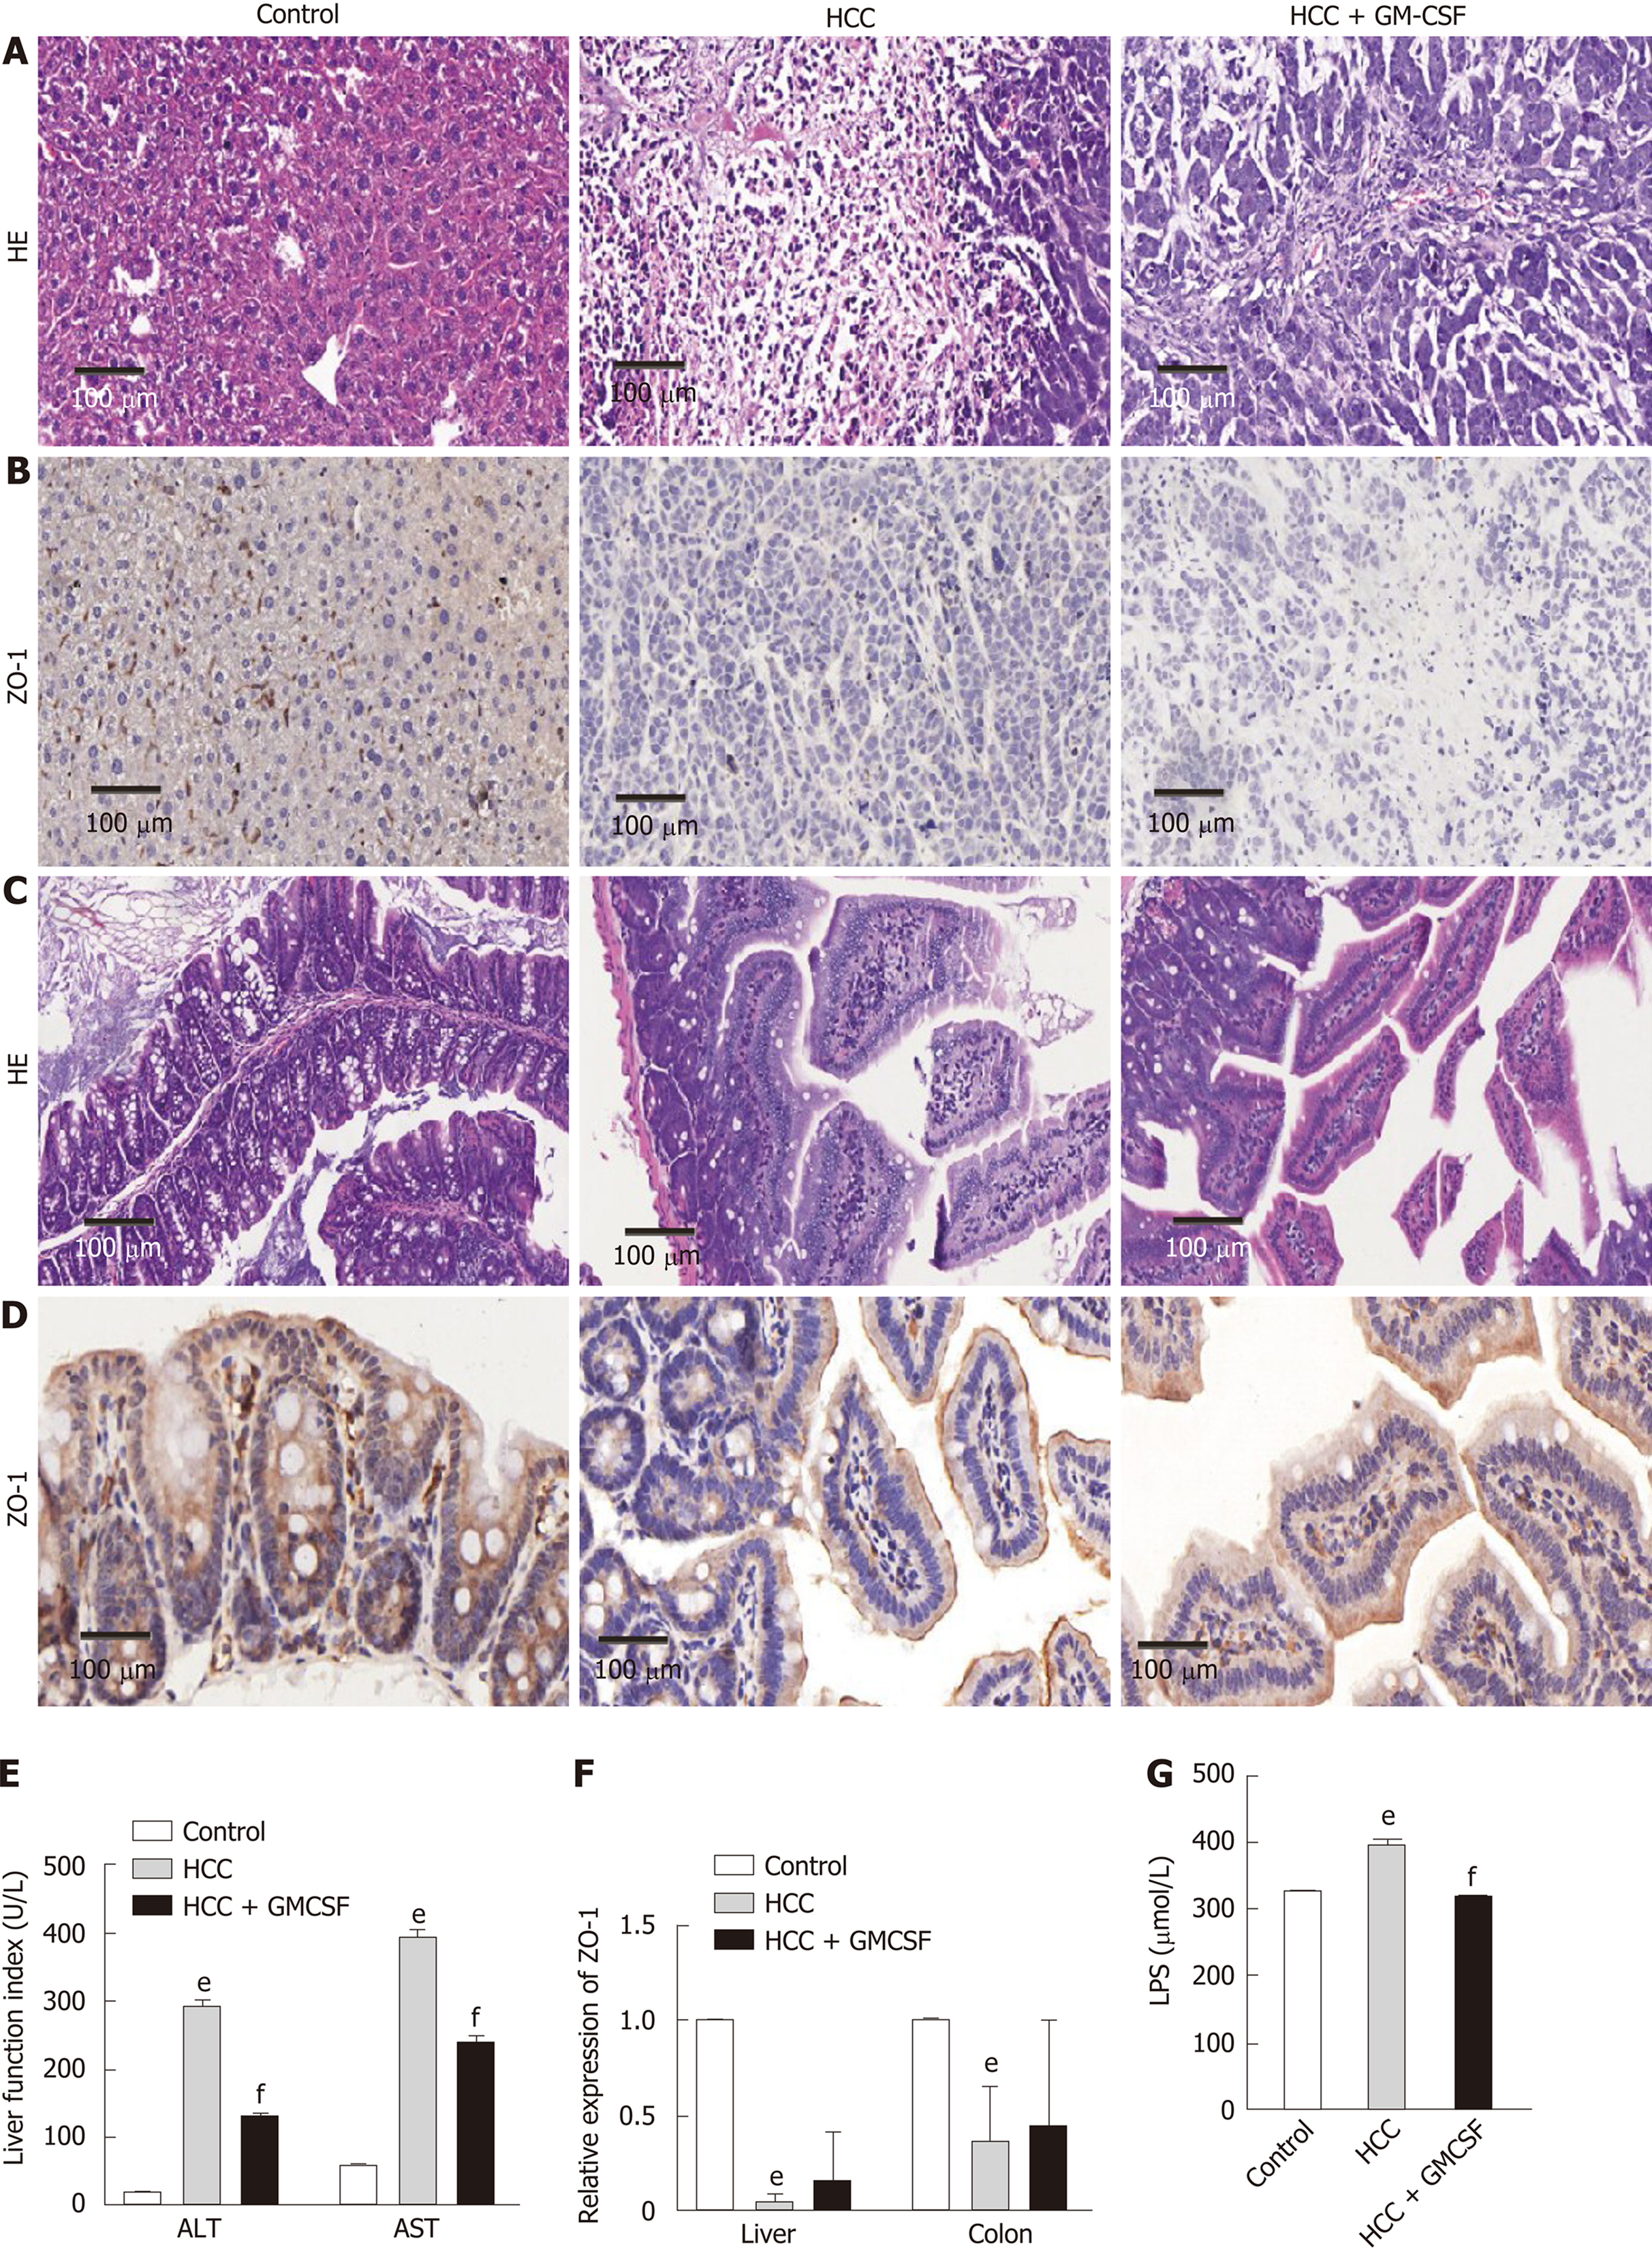
Figure 1 Granulocyte-macrophage colony-stimulating factor alleviated hepatic injury, normalized liver function, improved intestinal barrier function, and reduced serum endotoxin levels detected in response to hepatocellular carcinoma.
A: Liver histology was assessed by hematoxylin and eosin (H&E) staining, scale bar: 200 μm (200 ×); B: Liver histology was assessed via ZO-1 immunohistochemical staining (scale bar, 200 μm); C: Colon histology was assessed via H&E staining, scale bar: 200 μm (400 ×); D: Colon histology was assessed via ZO-1 immunohistochemical staining (scale bar, 200 μm); E: Serum alanine aminotransferase and aspartate aminotransferase (U/L) levels; F: Expression of the intestinal barrier function marker ZO-1 in the liver and colon; G: Serum lipopolysaccharide levels (µmol/L). Data are presented as the means ± SE, n = 11–13 mice per group detected via one-way ANOVA with post hoc Tukey’s test. aP < 0.05, bP < 0.01, and eP < 0.001, HCC vs control; cP < 0.05, dP < 0.01, and fP < 0.001, HCC + GM-CSF vs HCC. HCC: Hepatocellular carcinoma; GM-CSF: Granulocyte-macrophage colony-stimulating factor; ALT: Alanine aminotransferase; AST: Aspartate aminotransferase; LPS: Lipopolysaccharide; H&E: Hematoxylin and eosin.
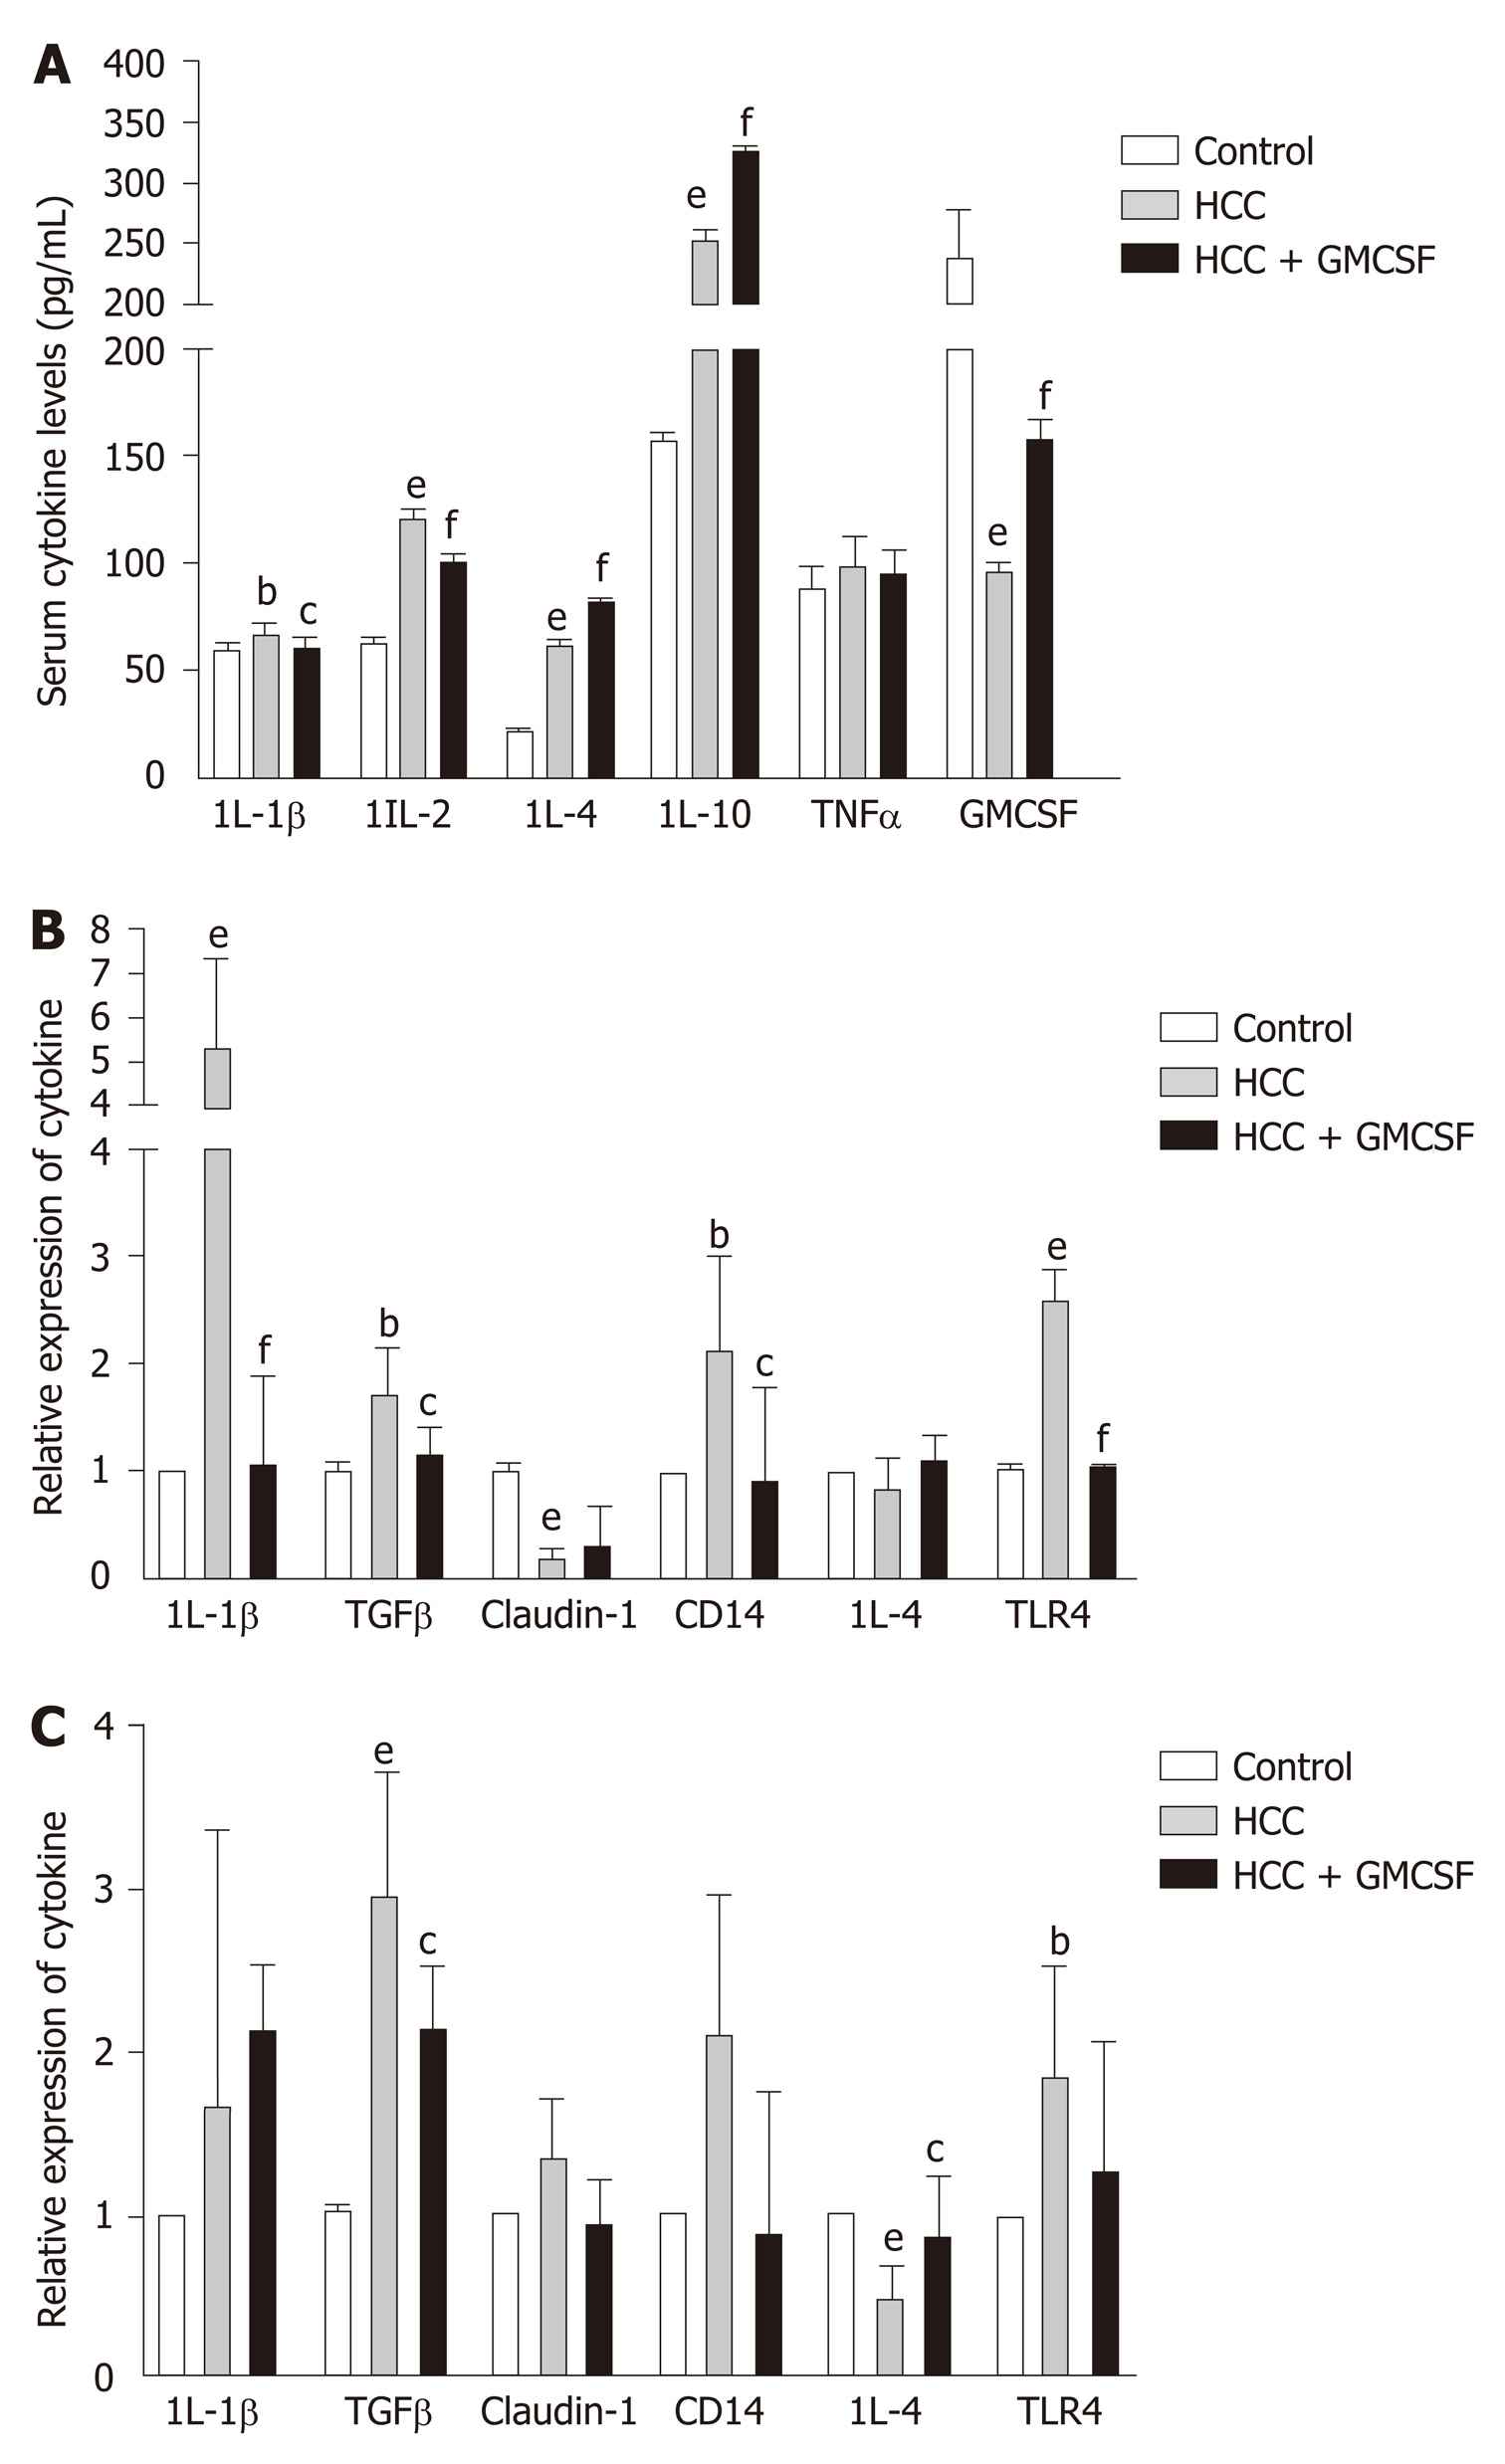
Figure 2 Granulocyte-macrophage colony-stimulating factor normalized cytokine profiles and regulated Toll-like receptor expression.
A: Cytokine levels in serum; B and C: Cytokine gene expression in the liver and colon. Data are presented as the means ± SE and analyzed via one-way ANOVA with post hoc Tukey’s test. n = 11-13 mice per group. aP < 0.05, bP < 0.01, and eP < 0.001 hepatocellular carcinoma (HCC) vs control; cP < 0.05, dP < 0.01, and fP < 0.001 HCC + GM-CSF vs HCC. IL-1β: Interleukin-1β; TGFβ: Transforming growth factor β; HCC: Hepatocellular carcinoma; GM-CSF: Granulocyte-macrophage colony-stimulating factor.
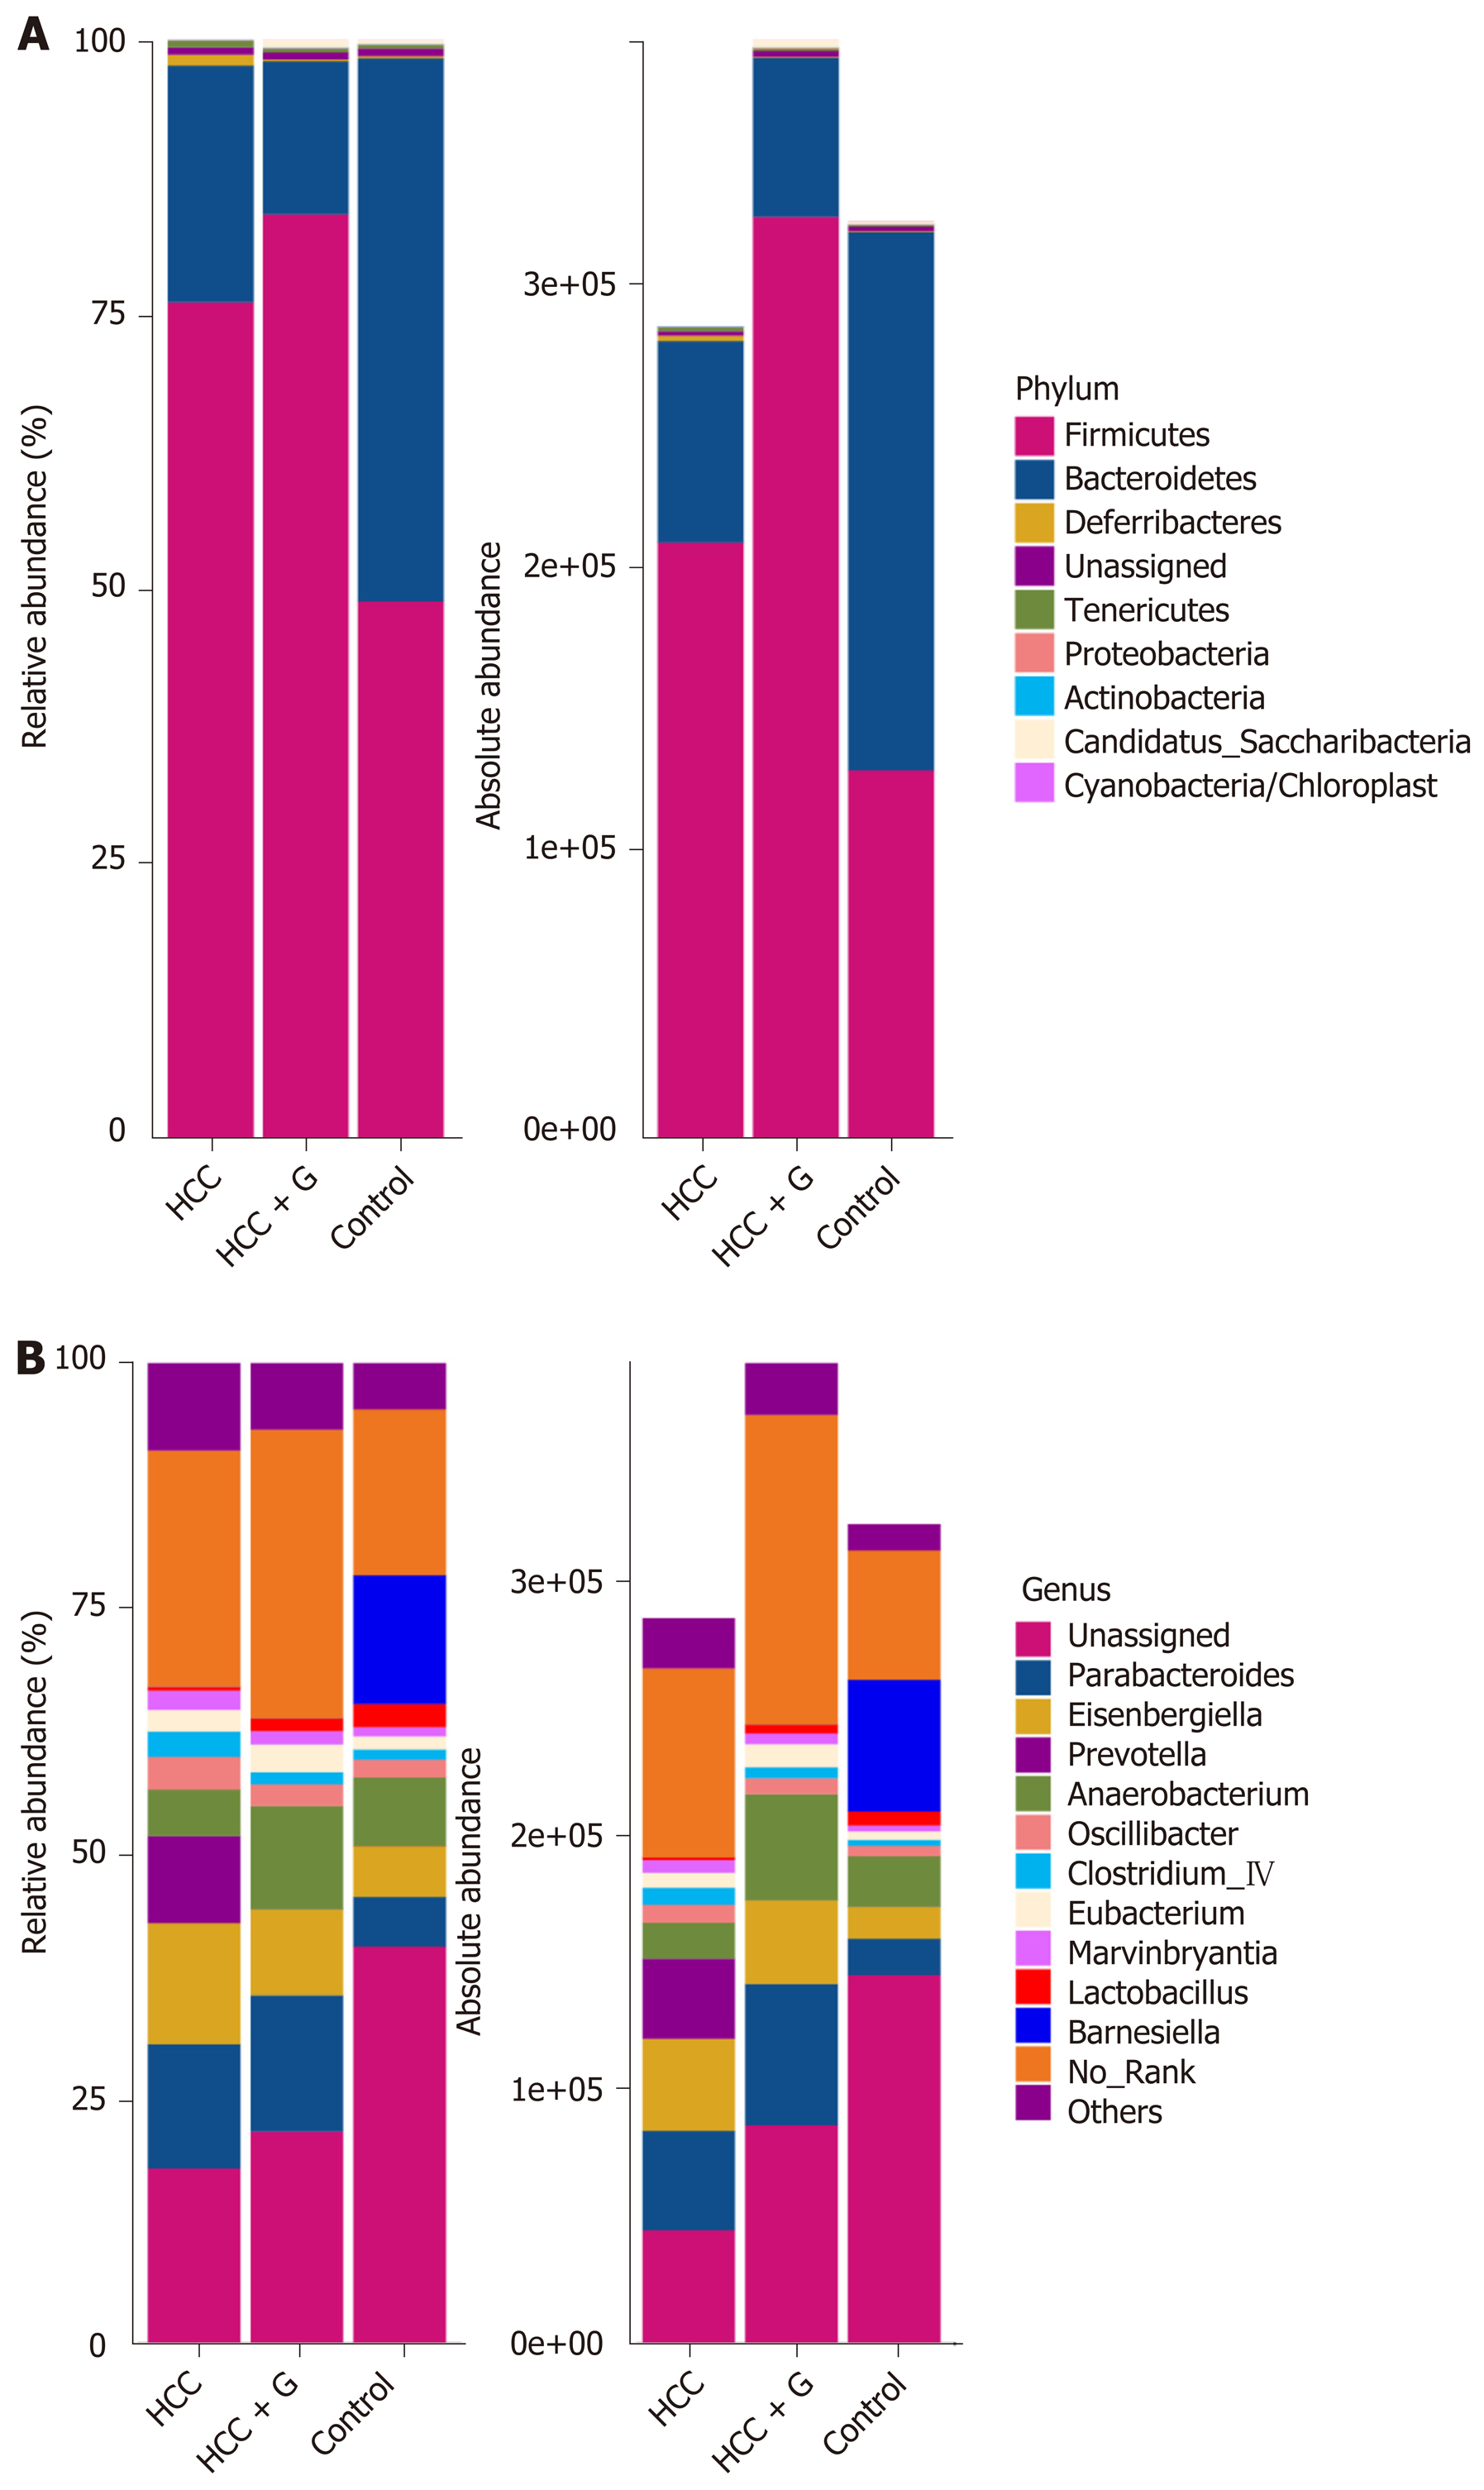
Figure 3 Relative and absolute abundances of the major bacteria at phylum (A) and genus (B) levels.
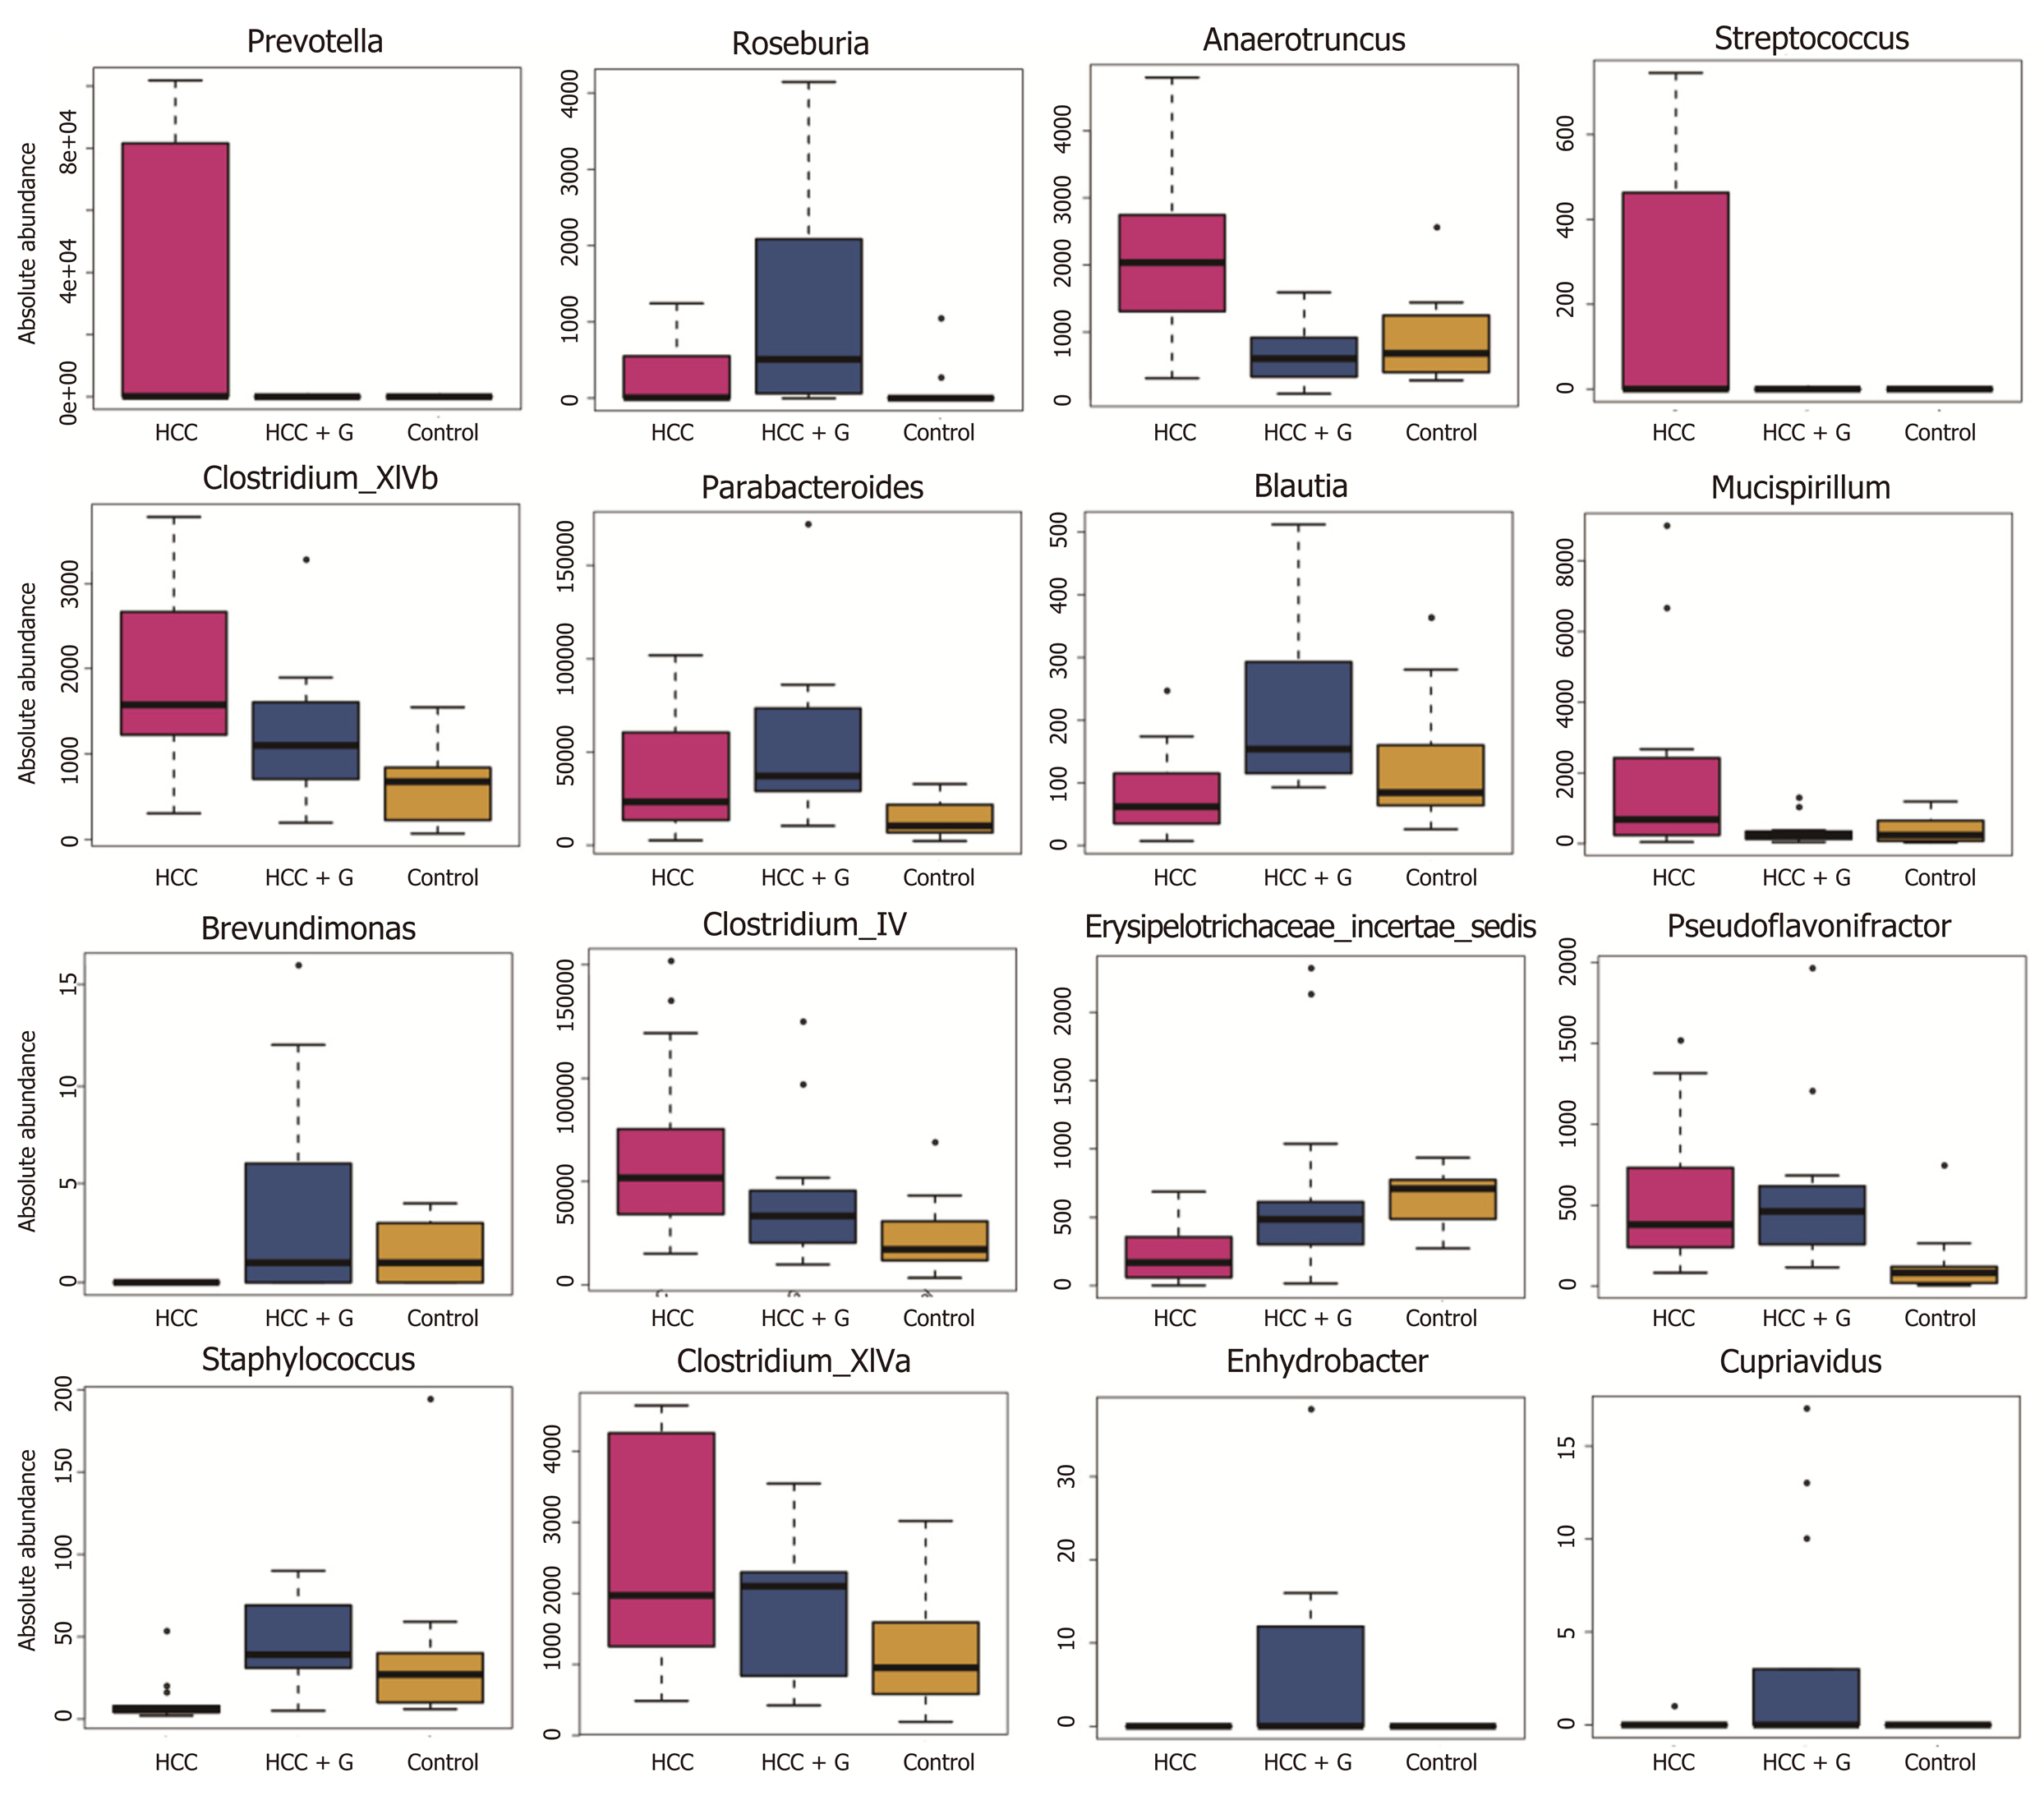
Figure 4 Profiles of the gut microbes among the hepatocellular carcinoma + granulocyte-macrophage colony-stimulating factor, hepatocellular carcinoma and control groups.
The absolute abundance of each genus is indicated on the y-axis. The ordinate represents the abundance value among the three groups. The Kruskal-Wallis rank-sum test was used to analyze the different species. The figure shows all the significantly different genera in the diversity indexes among the groups, and a P value < 0.05 was considered significantly different. HCC: Hepatocellular carcinoma; GM-CSF: Granulocyte-macrophage colony-stimulating factor.
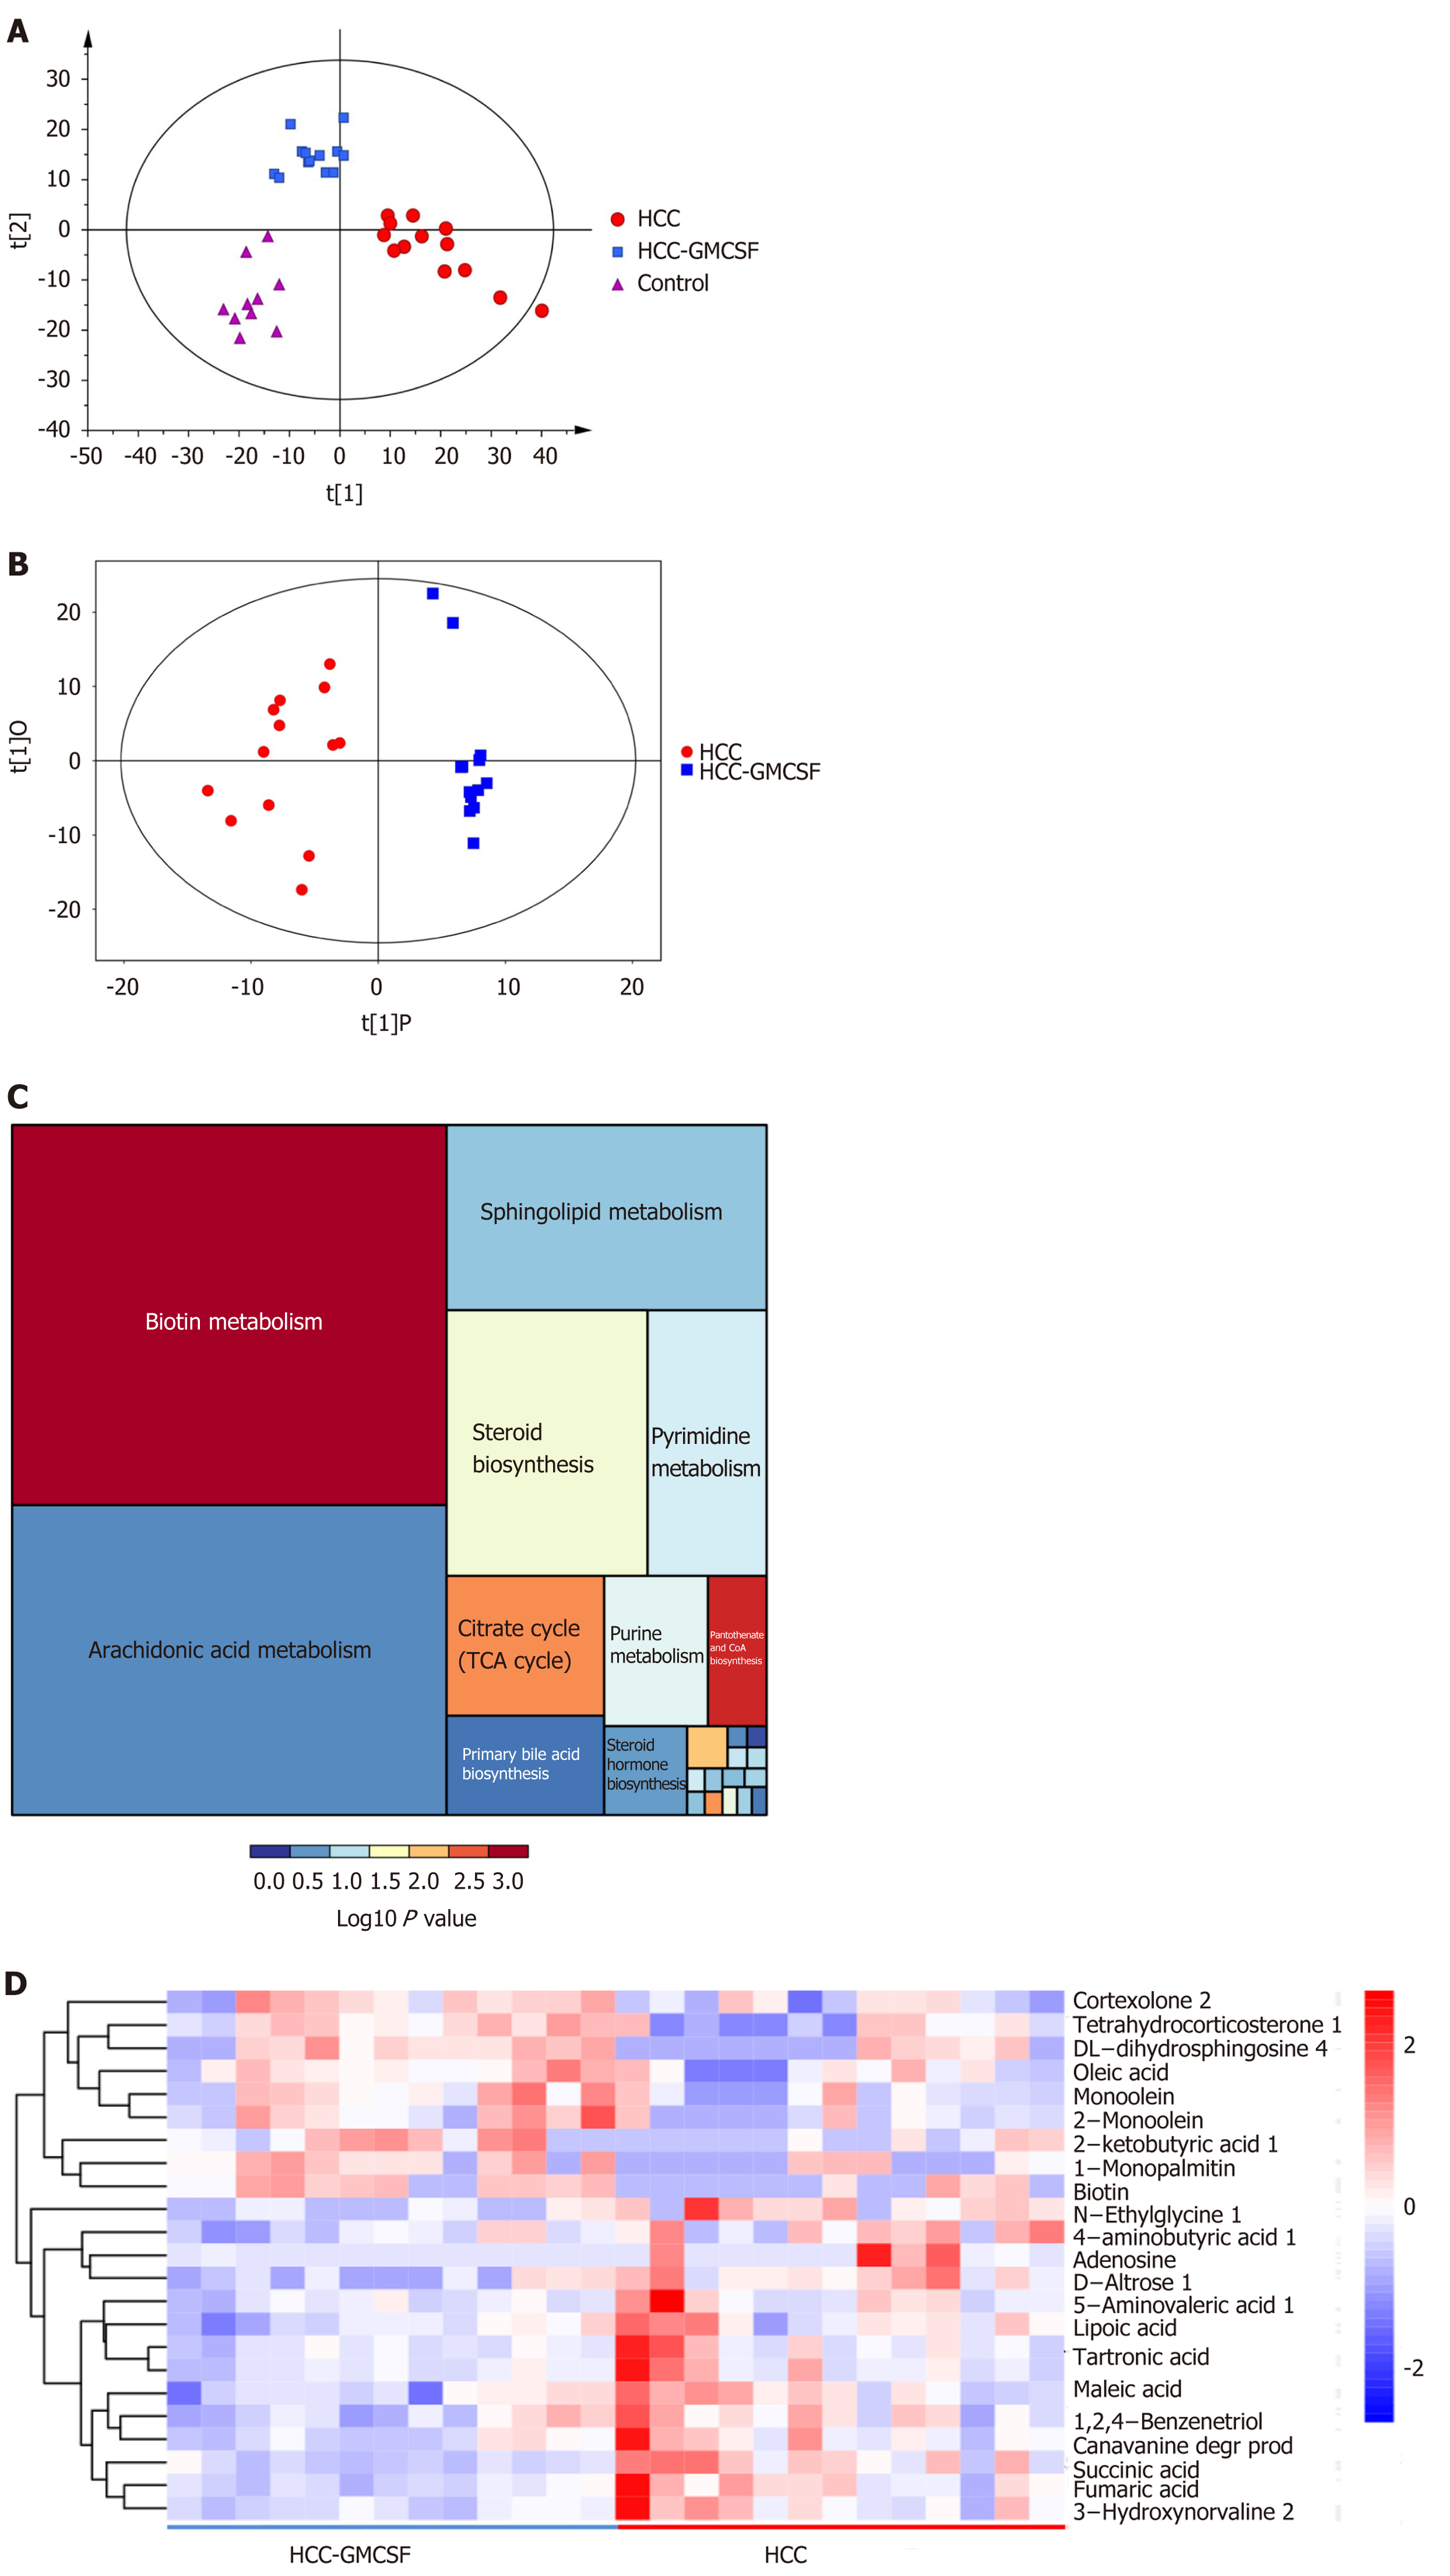
Figure 5 Granulocyte-macrophage colony-stimulating factor normalized the fecal metabolomic profile detected in response to hepatocellular carcinoma.
A: OPLS-DA score scatter plot comparing the control (purple), hepatocellular carcinoma (HCC) (red), and HCC + granulocyte-macrophage colony-stimulating factor (GM-CSF) (blue) groups; B: OPLS-DA score scatter plot comparing the HCC (red) and HCC + GM-CSF (blue) groups; C: Differential involvement of the metabolic pathways between the three groups; D: Heat map detailing the differential detection of metabolites comparing the HCC and HCC + GM-CSF groups. HCC: Hepatocellular carcinoma; GM-CSF: Granulocyte-macrophage colony-stimulating factor.
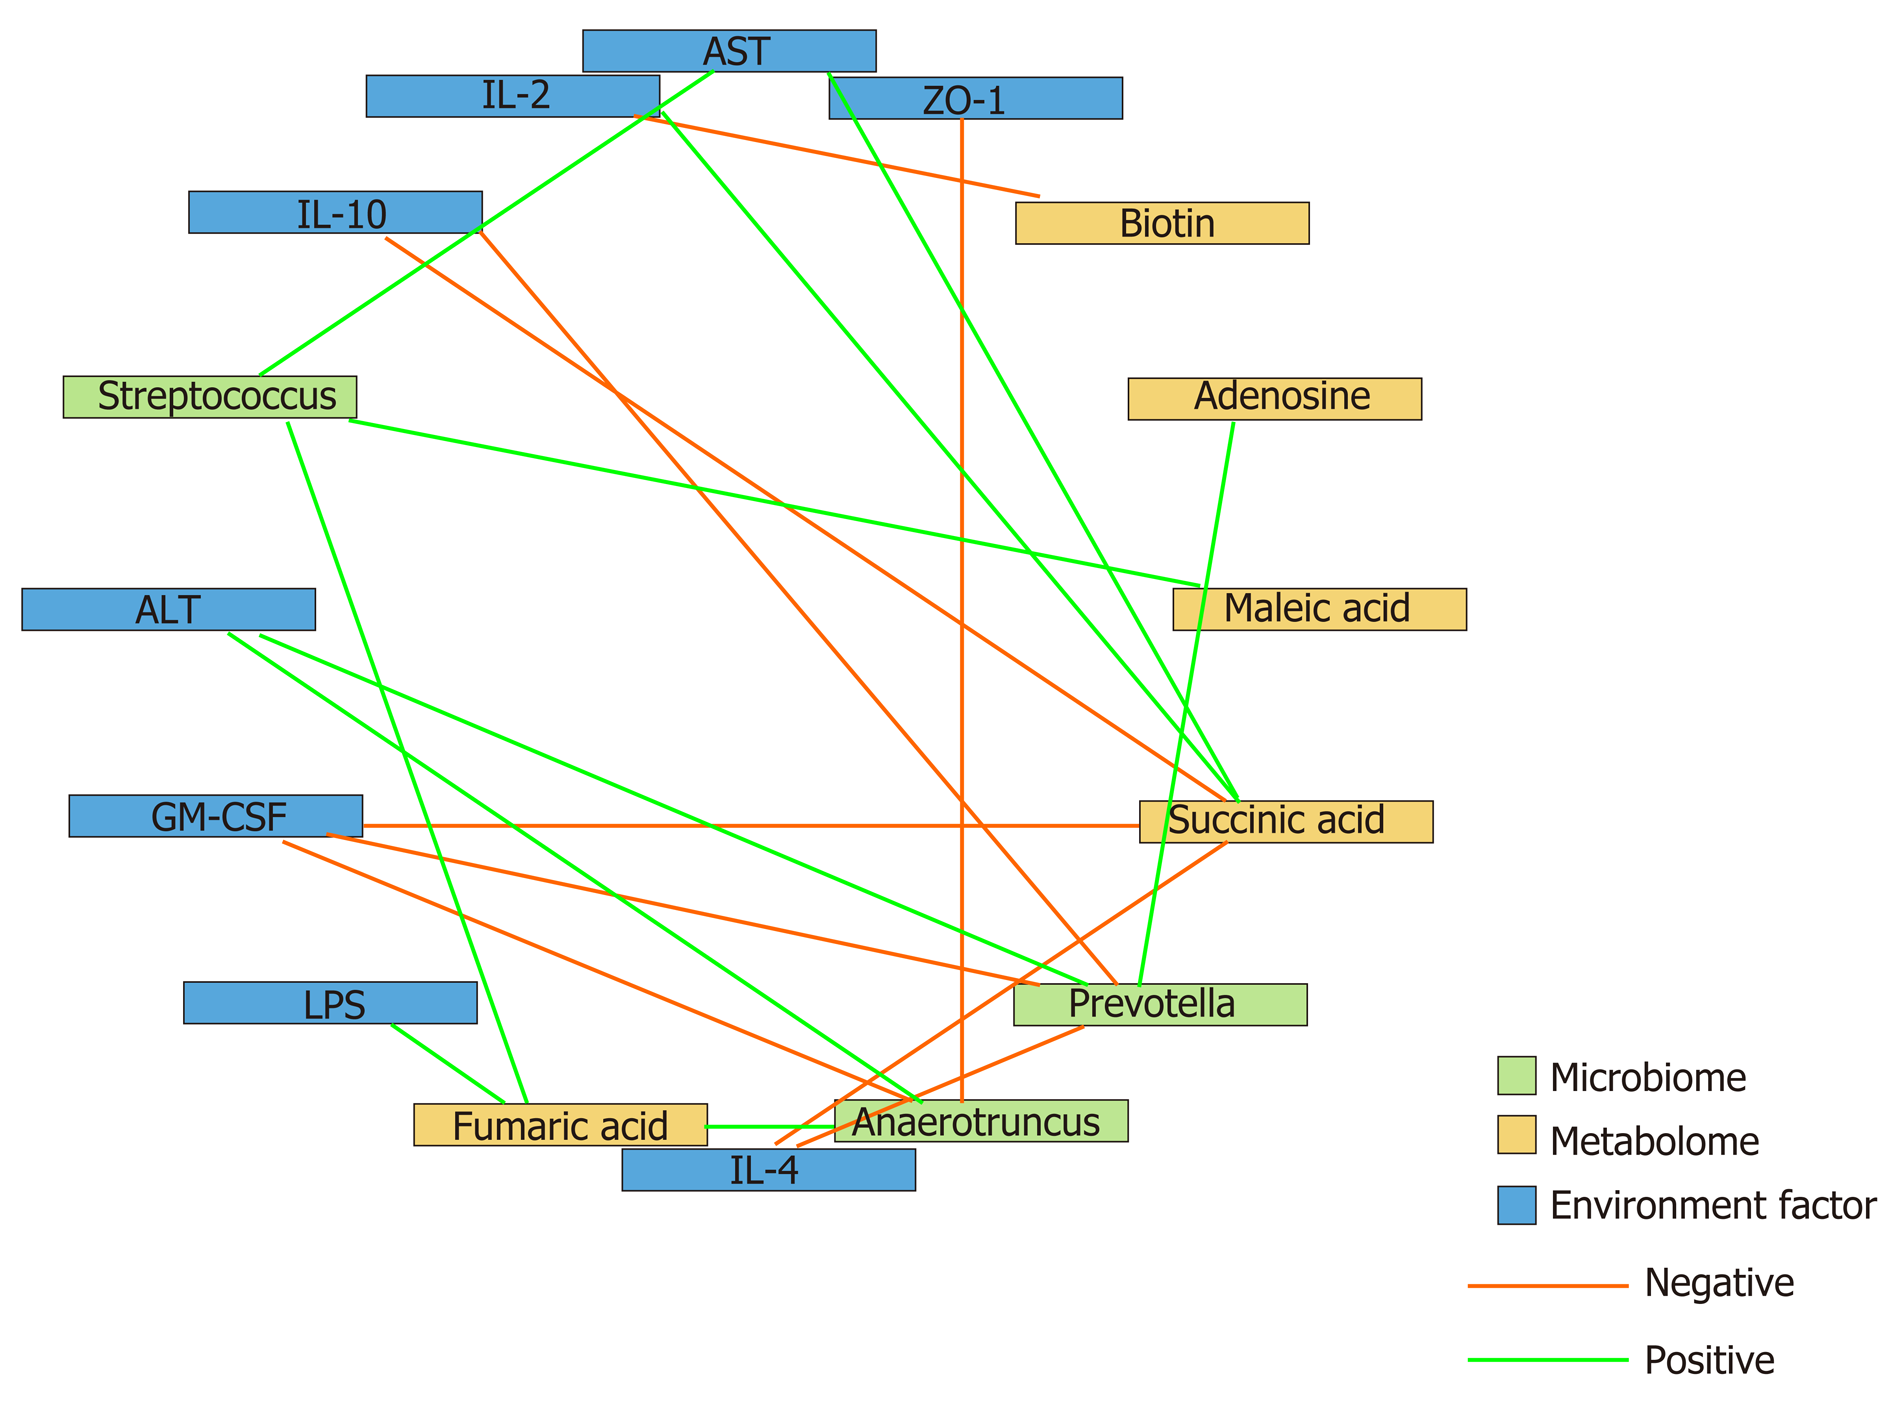
Figure 6 Correlation analysis of the representative microbial genera, characterized metabolites, and environmental factors (parameters indicating liver and gut impairment) among the control, hepatocellular carcinoma, and hepatocellular carcinoma + granulocyte-macrophage colony-stimulating factor groups.
Spearman’s rank correlation was used, and significant associations with P < 0.05 and r > 0.5 were found. Blue nodes, representative injury parameters; green nodes, differentially distributed genera; yellow nodes, metabolites with a high discriminative power between the groups. Green lines between nodes indicate positive linkages, and orange lines represent negative relationships. The thickness of the connection represents the correlation coefficient, with thicker lines indicating higher r values. ALT: Alanine aminotransferase; AST: Aspartate aminotransferase; LPS: Lipopolysaccharide; IL-2: Interleukin-2; GM-CSF: Granulocyte-macrophage colony-stimulating factor.
- Citation: Wu YN, Zhang L, Chen T, Li X, He LH, Liu GX. Granulocyte-macrophage colony-stimulating factor protects mice against hepatocellular carcinoma by ameliorating intestinal dysbiosis and attenuating inflammation. World J Gastroenterol 2020; 26(36): 5420-5436
- URL: https://www.wjgnet.com/1007-9327/full/v26/i36/5420.htm
- DOI: https://dx.doi.org/10.3748/wjg.v26.i36.5420


