Copyright
©The Author(s) 2020.
World J Gastroenterol. Sep 7, 2020; 26(33): 4960-4971
Published online Sep 7, 2020. doi: 10.3748/wjg.v26.i33.4960
Published online Sep 7, 2020. doi: 10.3748/wjg.v26.i33.4960
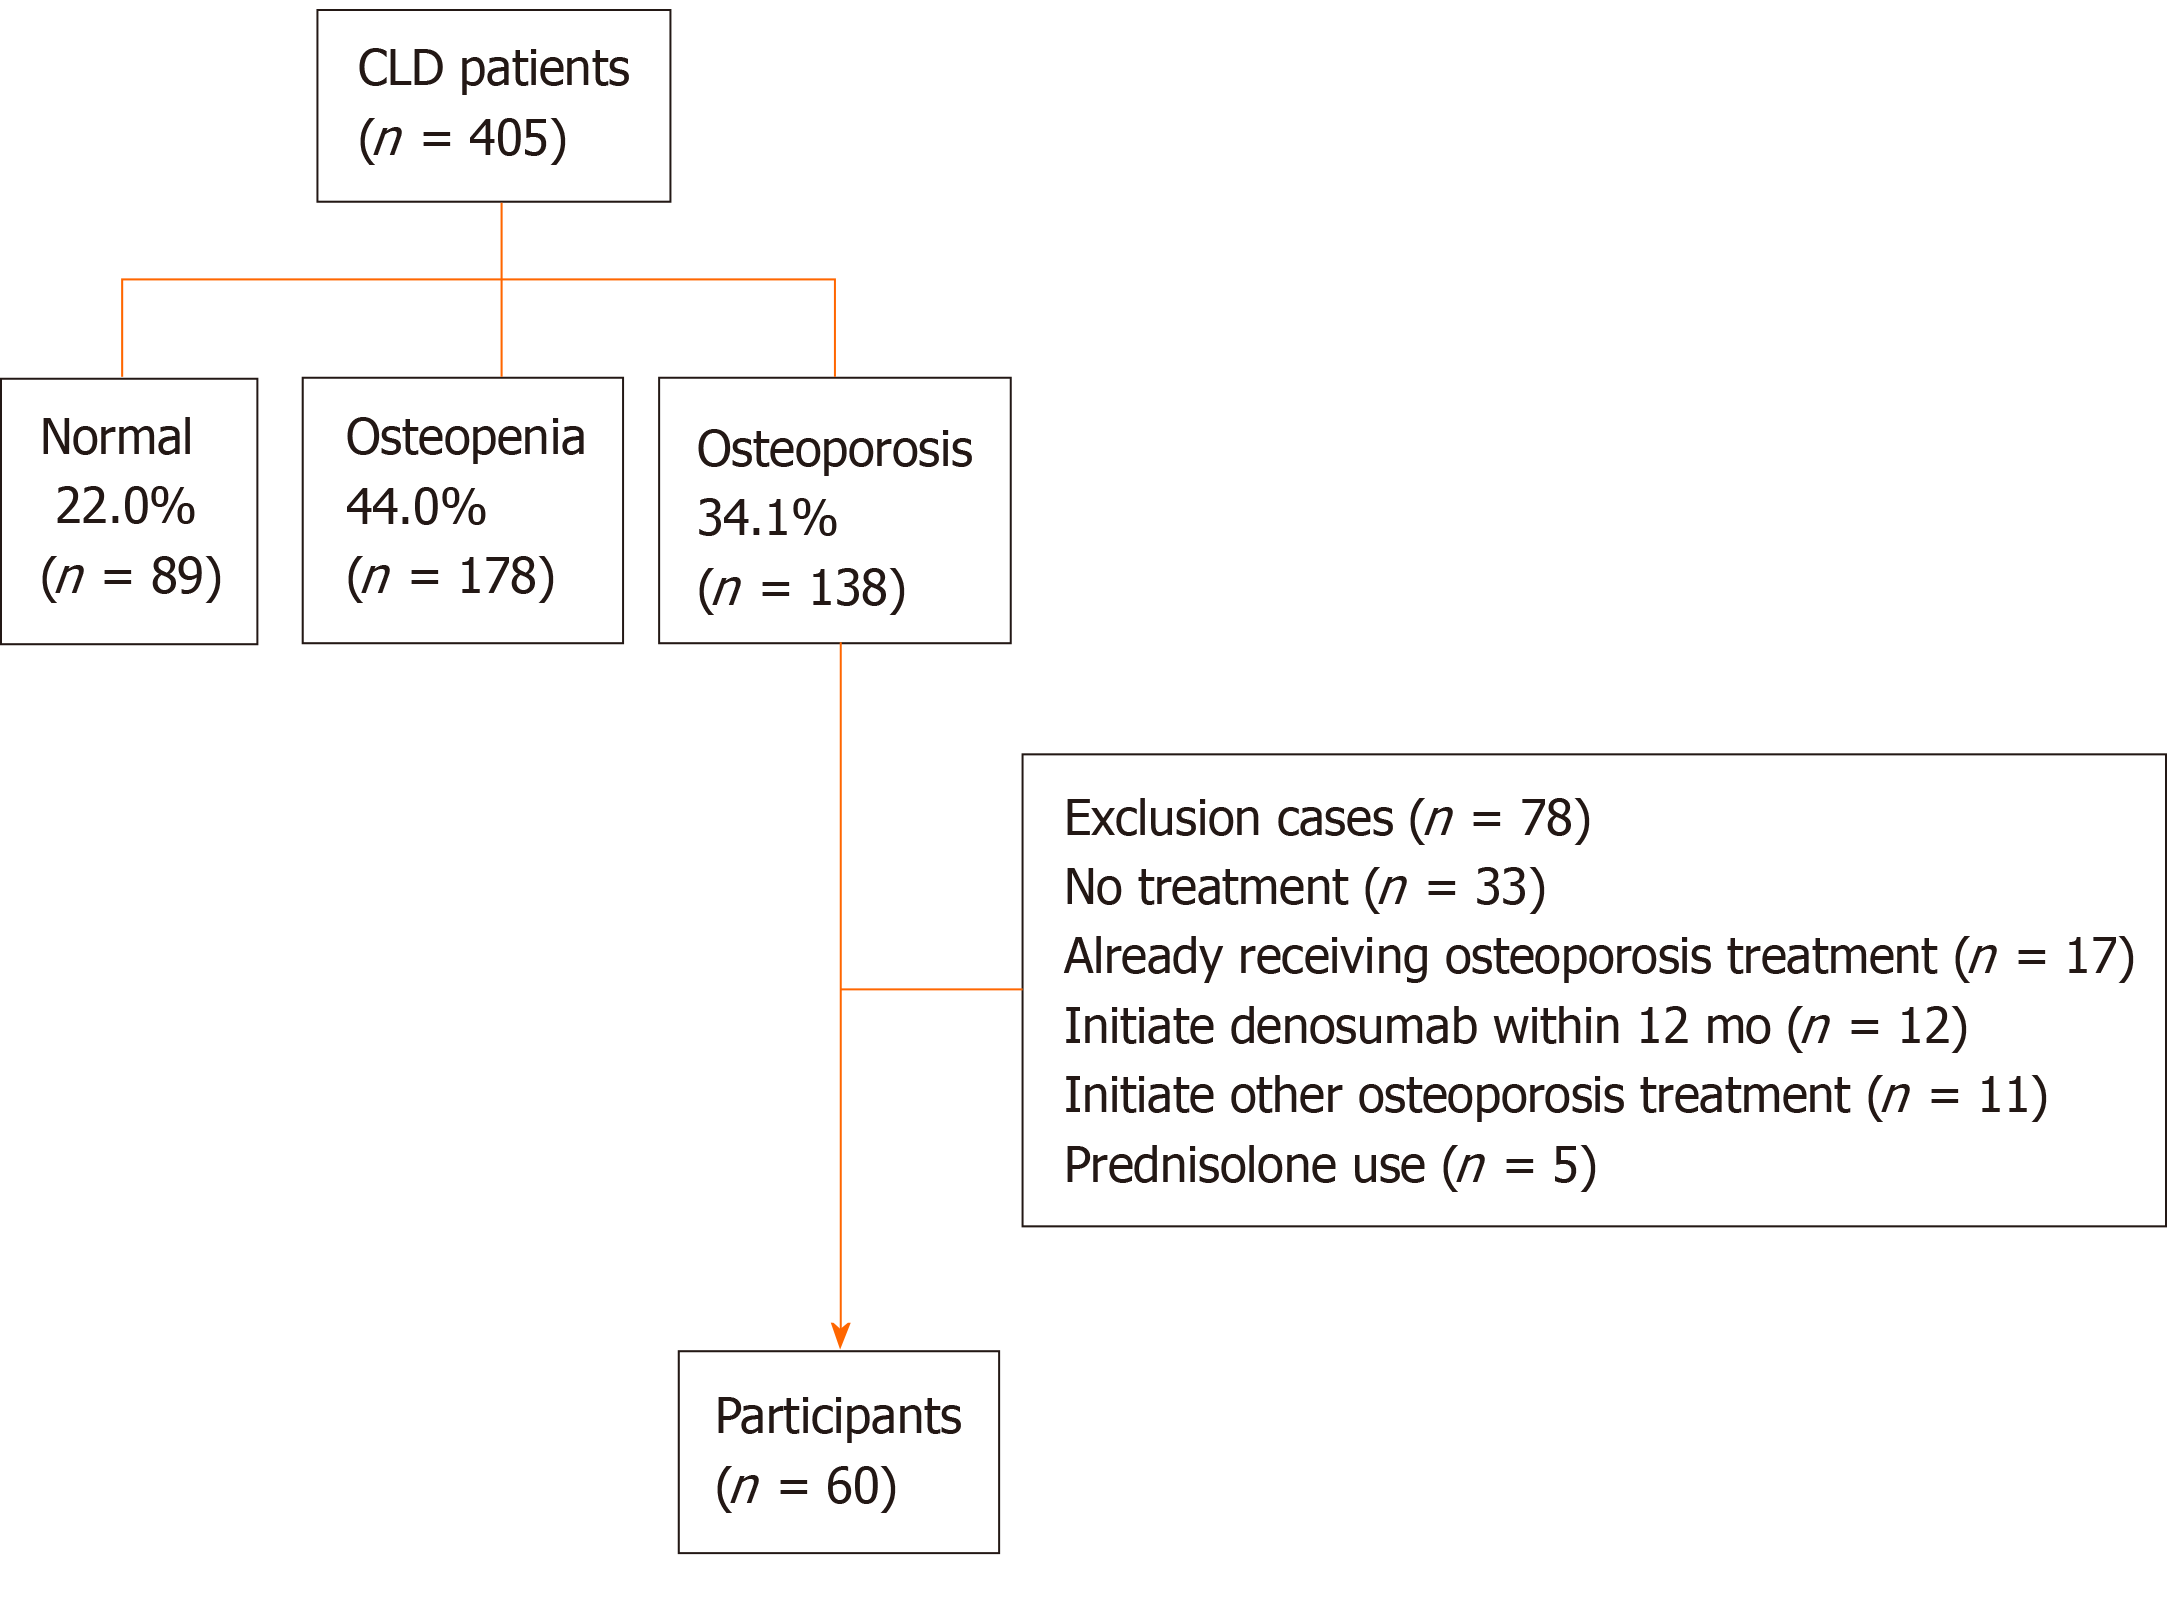
Figure 1 Flow diagram of patients enrolled in the present study.
Bone mineral density was assessed at the lumbar spine (L2-L4), femoral neck, and total hip in 405 chronic liver disease patients. One hundred thirty-eight patients were diagnosed with osteoporosis (34.1%); among these, 78 patients met the exclusion criteria and 60 patients were finally included in the present study. CLD: Chronic liver disease.
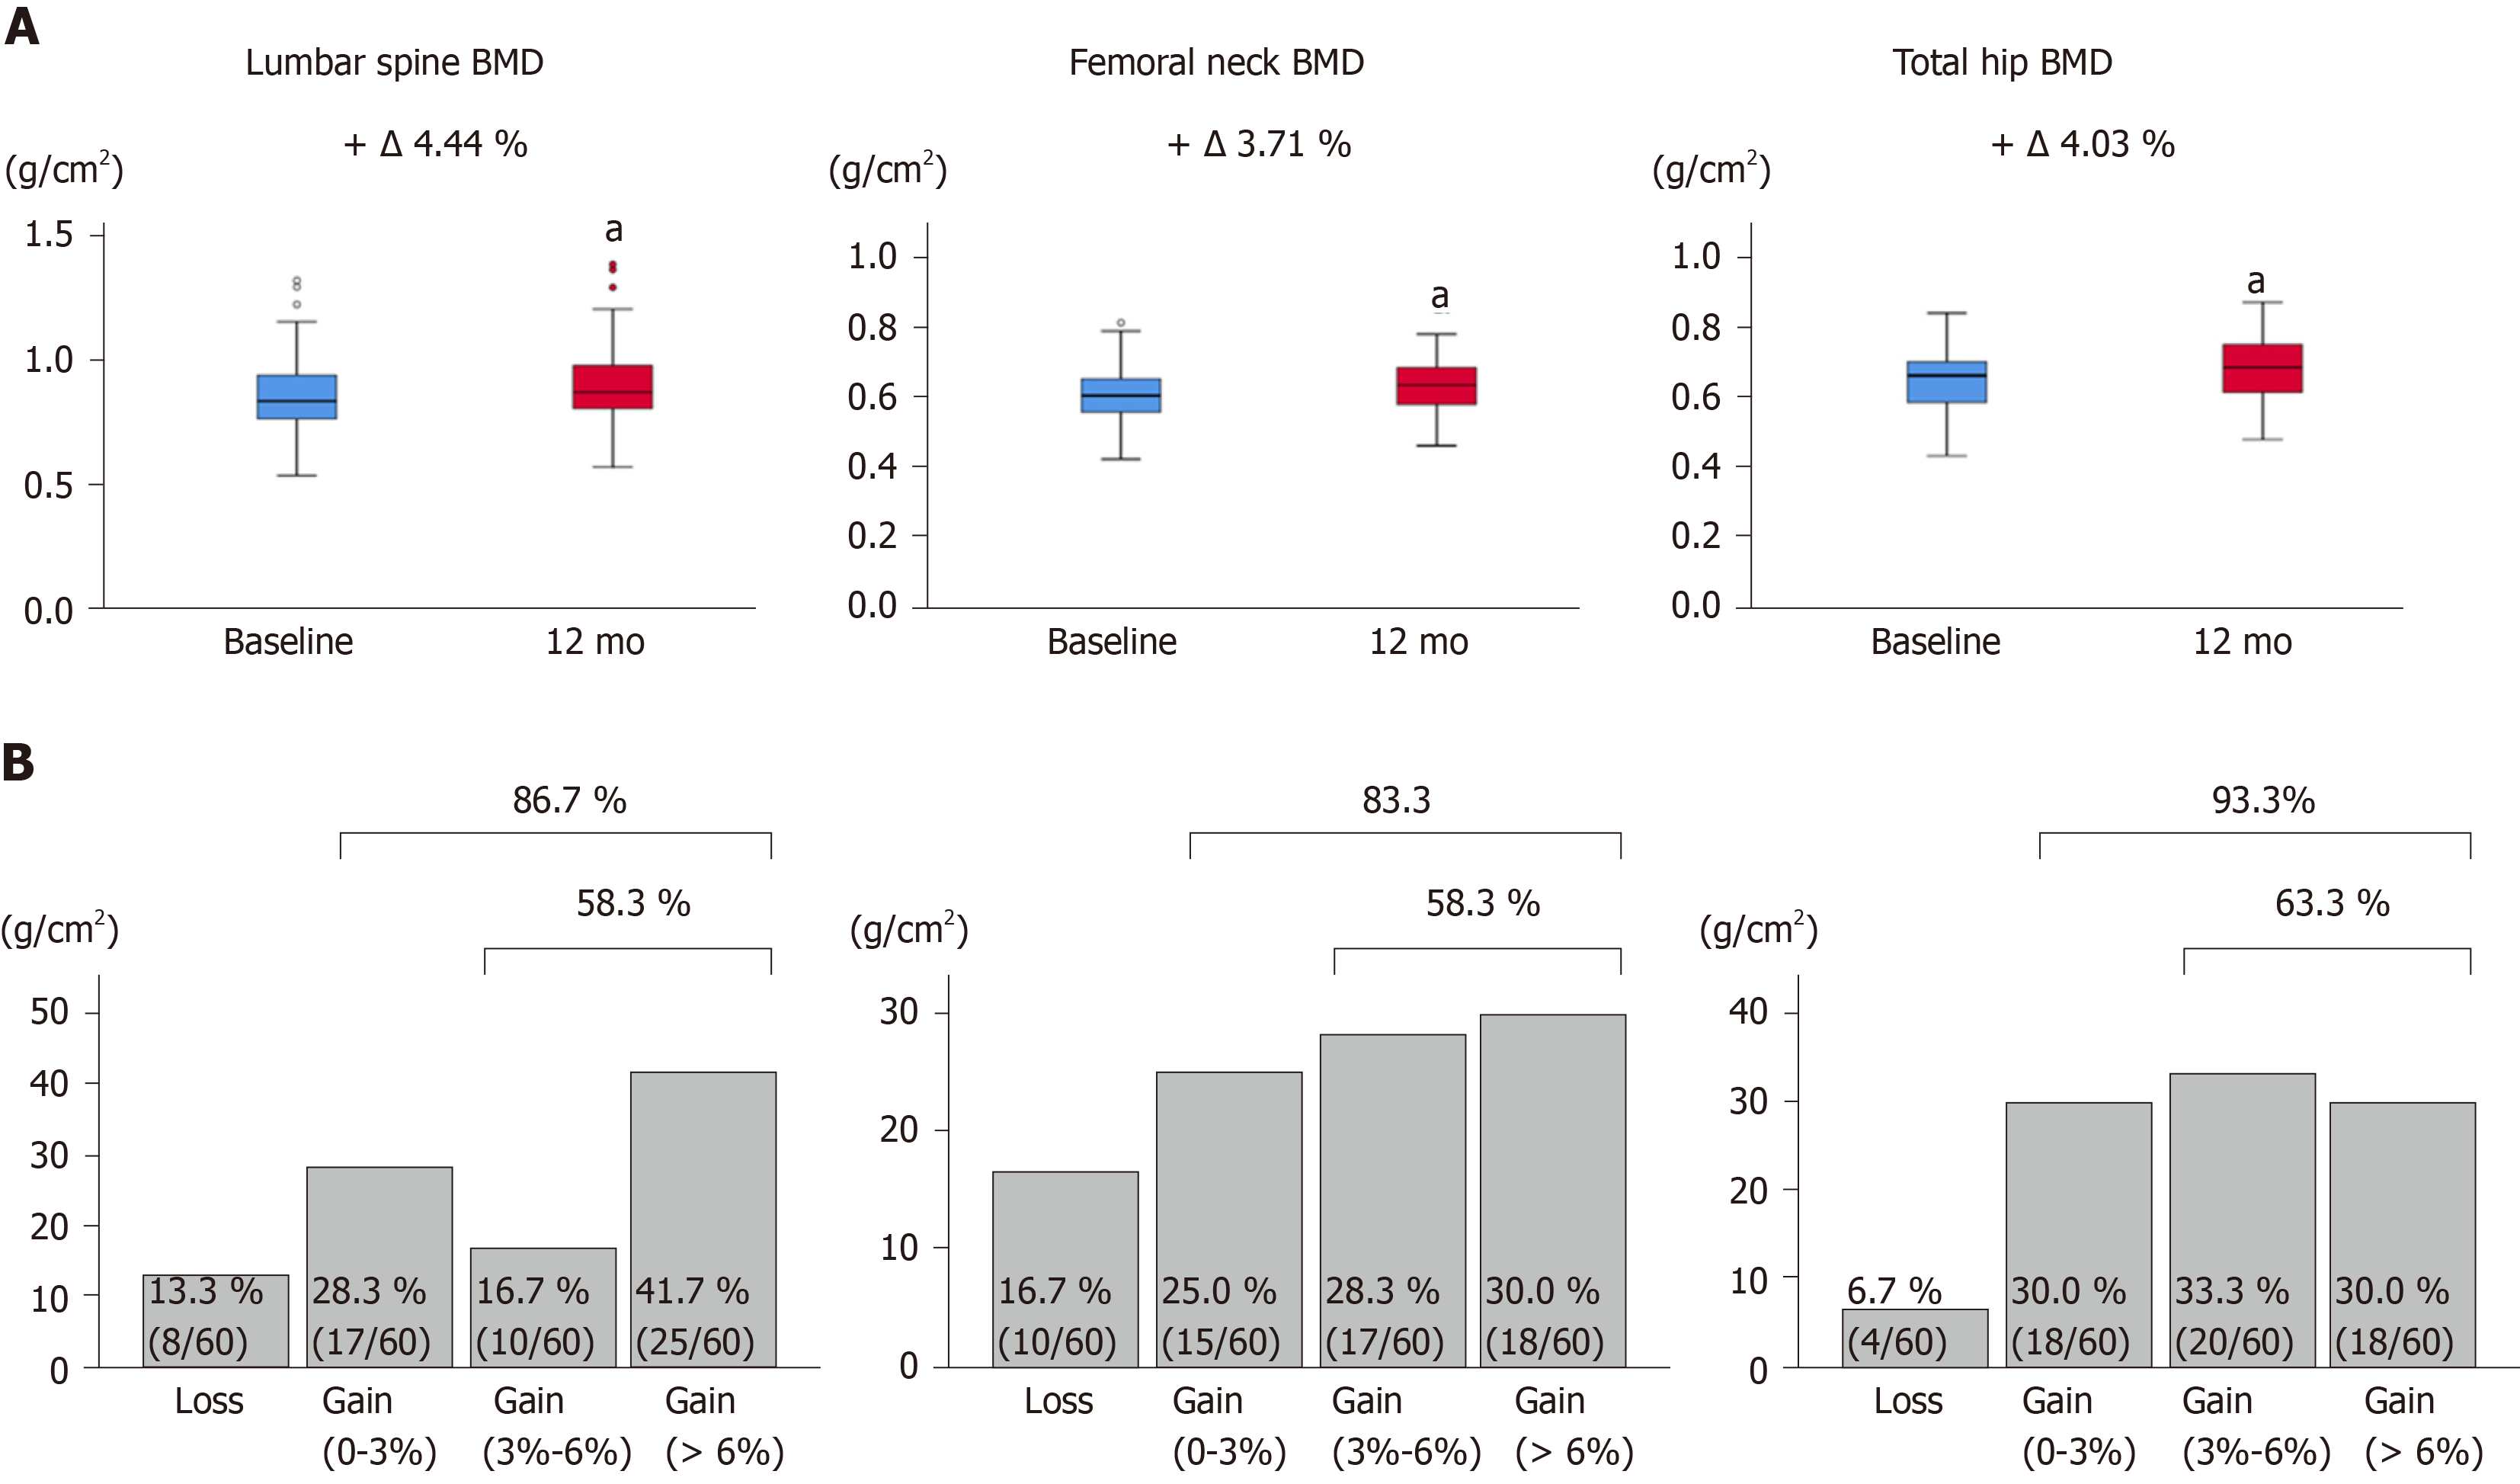
Figure 2 Bone mineral density values and proportion of bone mineral density response categories based on the bone mineral density percentage changes.
A: Bone mineral density (BMD) values at the lumbar spine, femoral neck, and total hip at baseline and 12 mo of denosumab treatment. Deltas and percentages represent median change rates from baseline to 12 mo. aP < 0.001 compared to baseline; B: The proportion of BMD response categories based on the BMD percentage changes from baseline to 12 mo of denosumab treatment at the lumbar spine, femoral neck, and total hip. BMD: Bone mineral density.
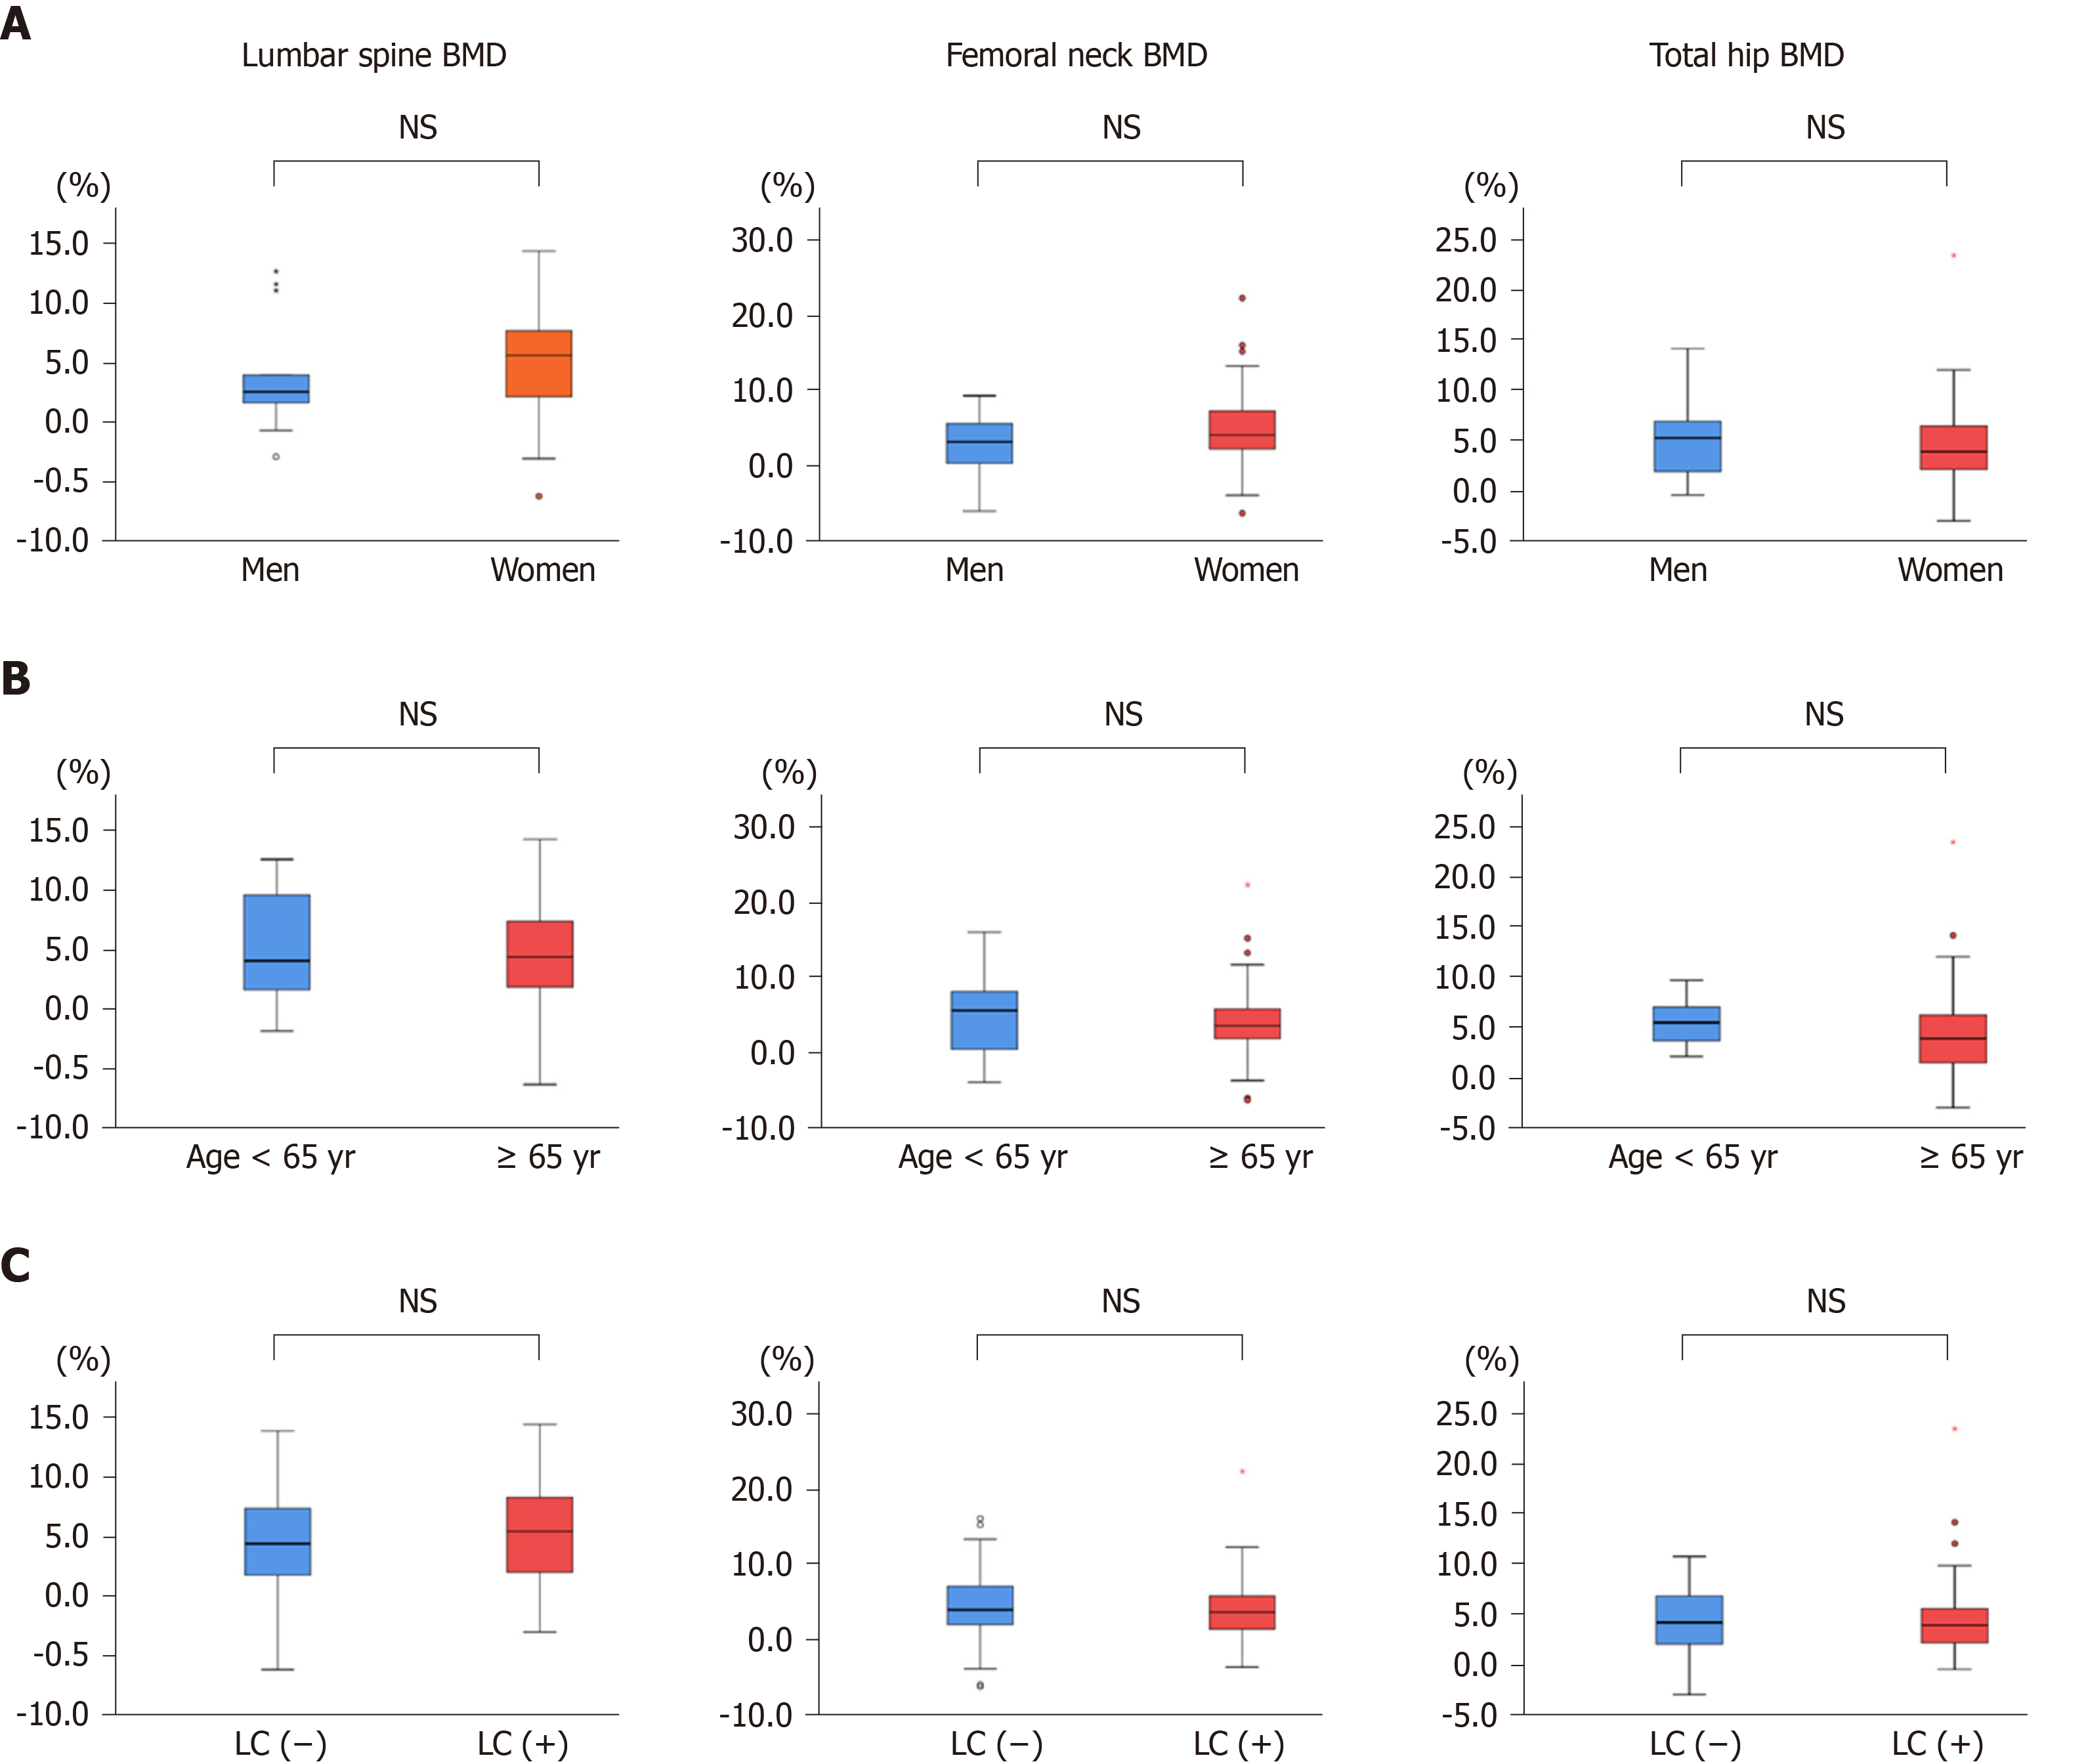
Figure 3 Comparison of the median percentage changes from baseline to 12 mo of denosumab treatment in bone mineral density at the lumbar spine, femoral neck, and total hip.
A: Men and women; B: Patients aged < 65 years and ≥ 65 years; C: Patients with and without liver cirrhosis. There were no significant differences between the groups. NS: Not significant; BMD: Bone mineral density; LC: Liver cirrhosis.
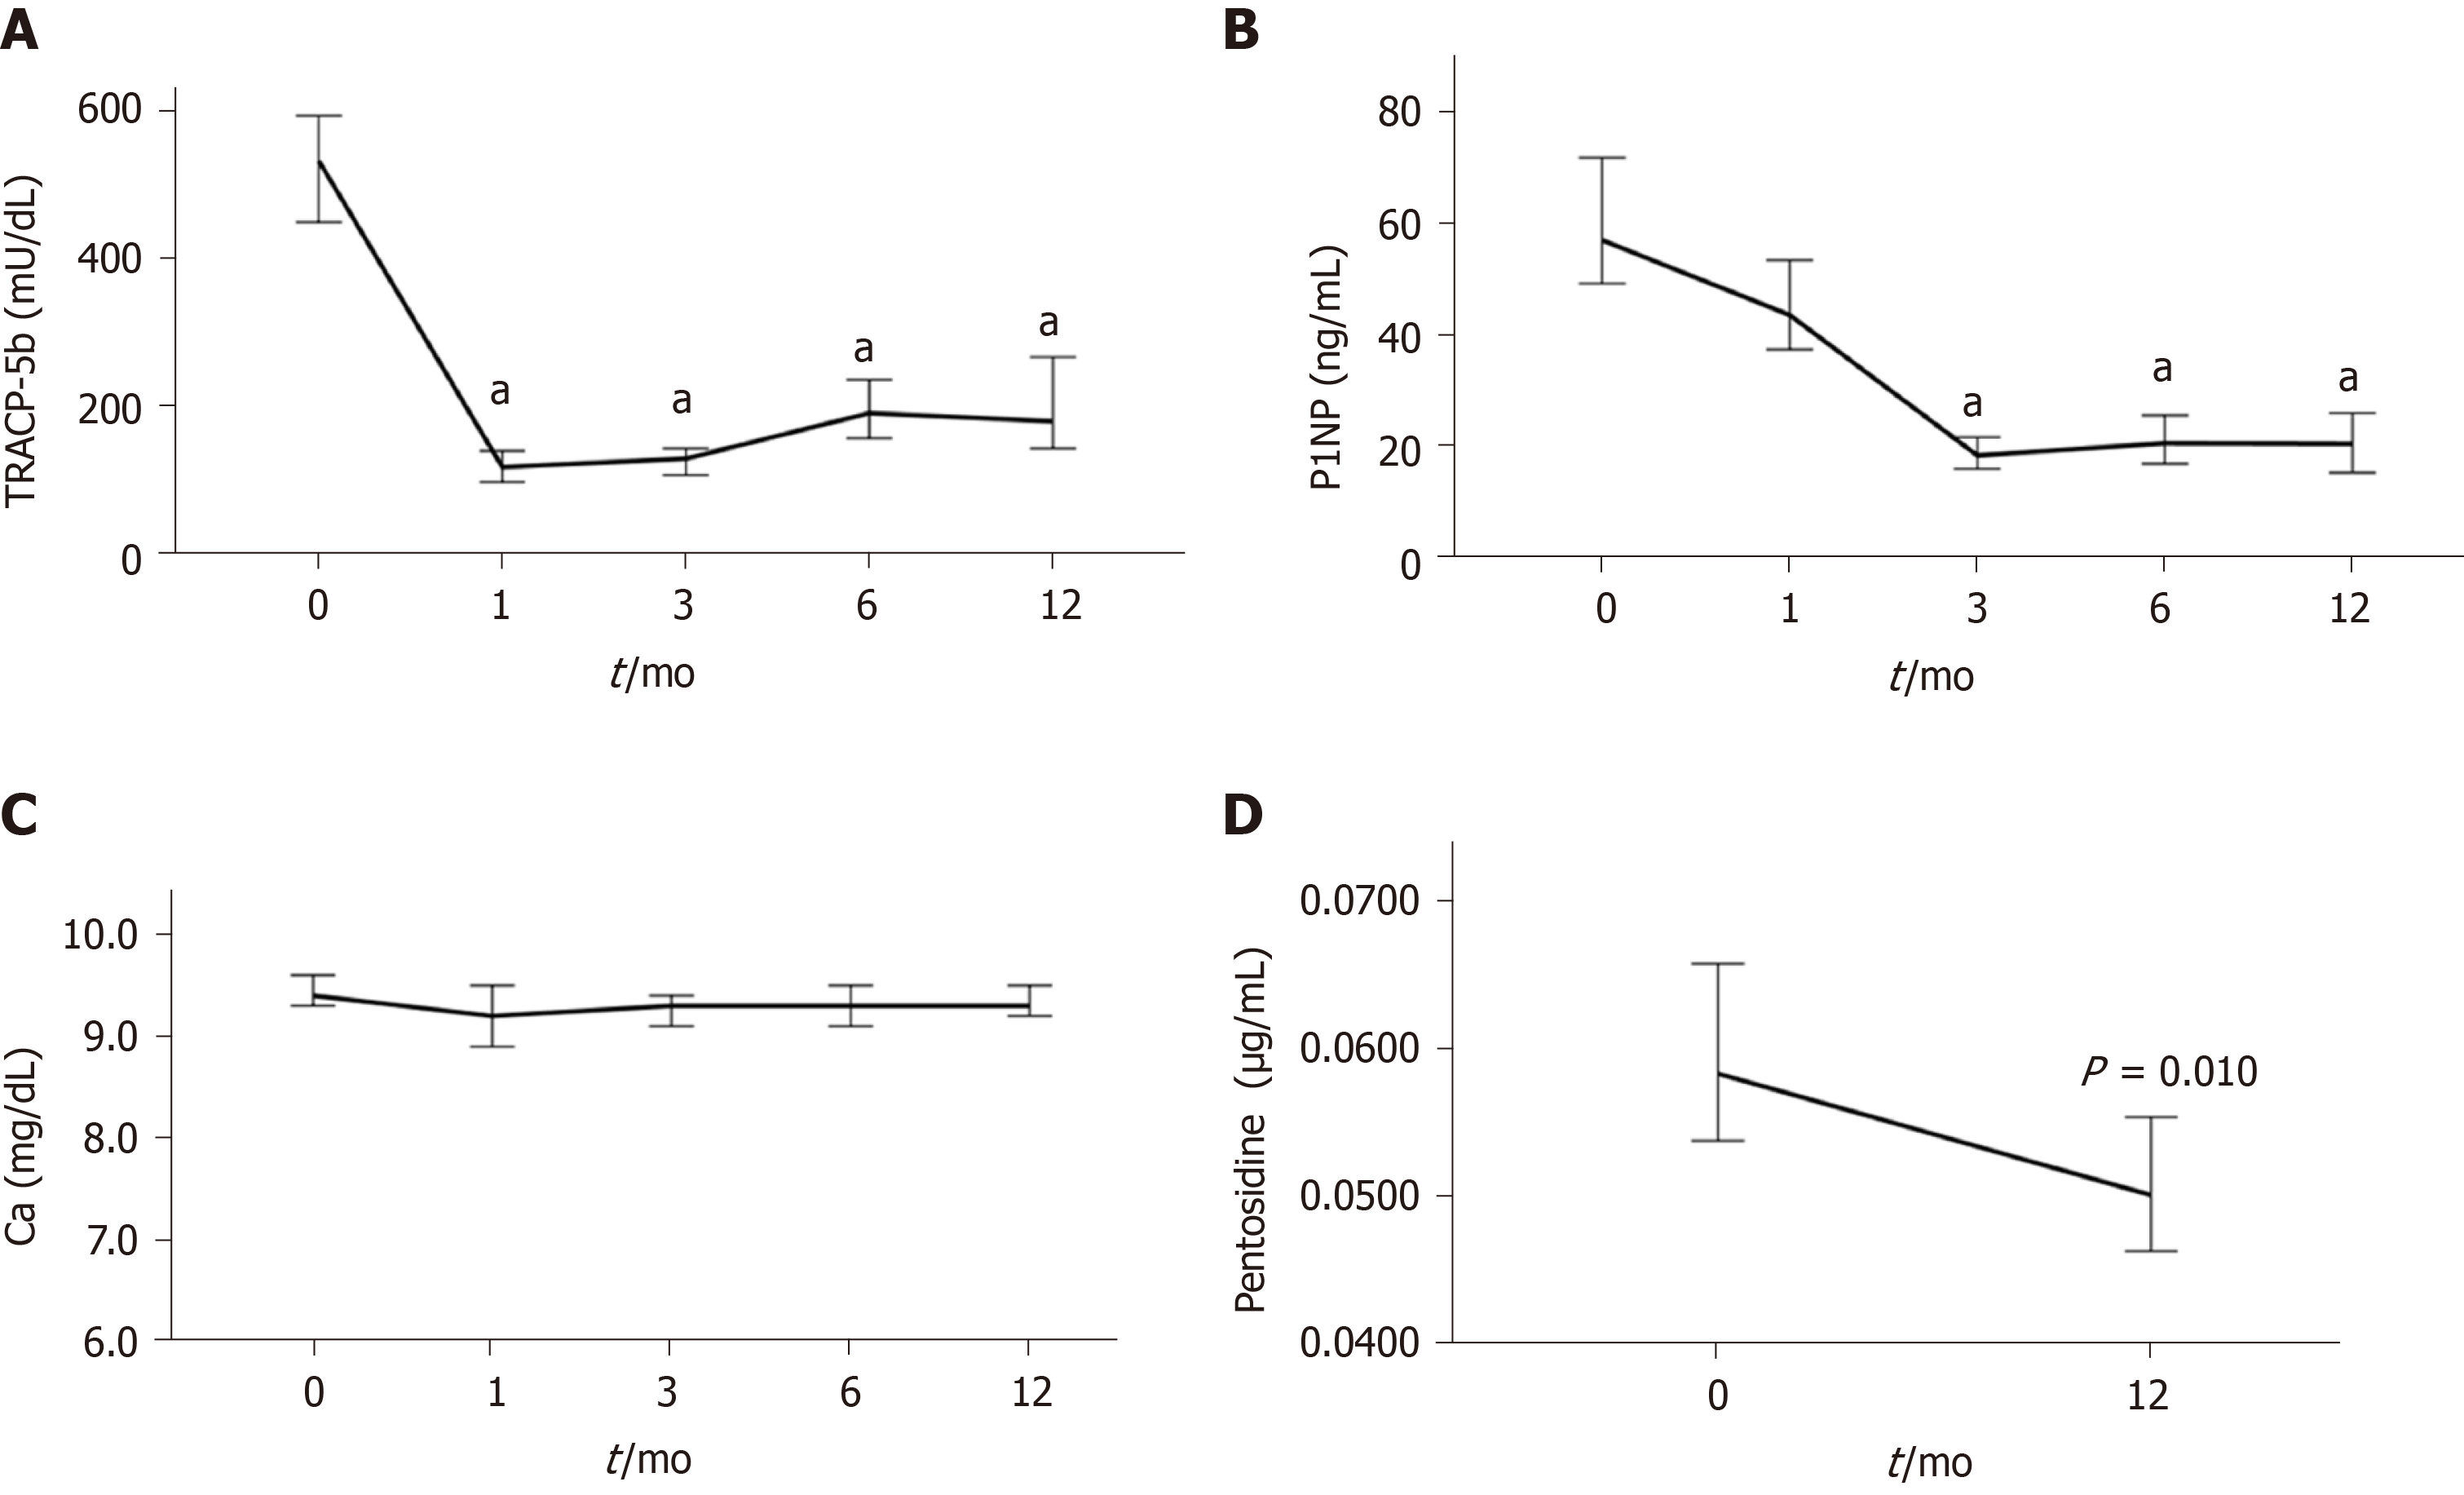
Figure 4 Time-course changes from baseline to 12 mo of denosumab treatment.
A: In the levels of serum tartrate-resistant acid phosphatase 5b; B: Serum procollagen type N-terminal propeptide; C: Serum calcium; and D: Plasma pentosidine. aP < 0.001 vs baseline.
- Citation: Saeki C, Saito M, Oikawa T, Nakano M, Torisu Y, Saruta M, Tsubota A. Effects of denosumab treatment in chronic liver disease patients with osteoporosis. World J Gastroenterol 2020; 26(33): 4960-4971
- URL: https://www.wjgnet.com/1007-9327/full/v26/i33/4960.htm
- DOI: https://dx.doi.org/10.3748/wjg.v26.i33.4960


