Copyright
©The Author(s) 2020.
World J Gastroenterol. Jul 14, 2020; 26(26): 3750-3766
Published online Jul 14, 2020. doi: 10.3748/wjg.v26.i26.3750
Published online Jul 14, 2020. doi: 10.3748/wjg.v26.i26.3750
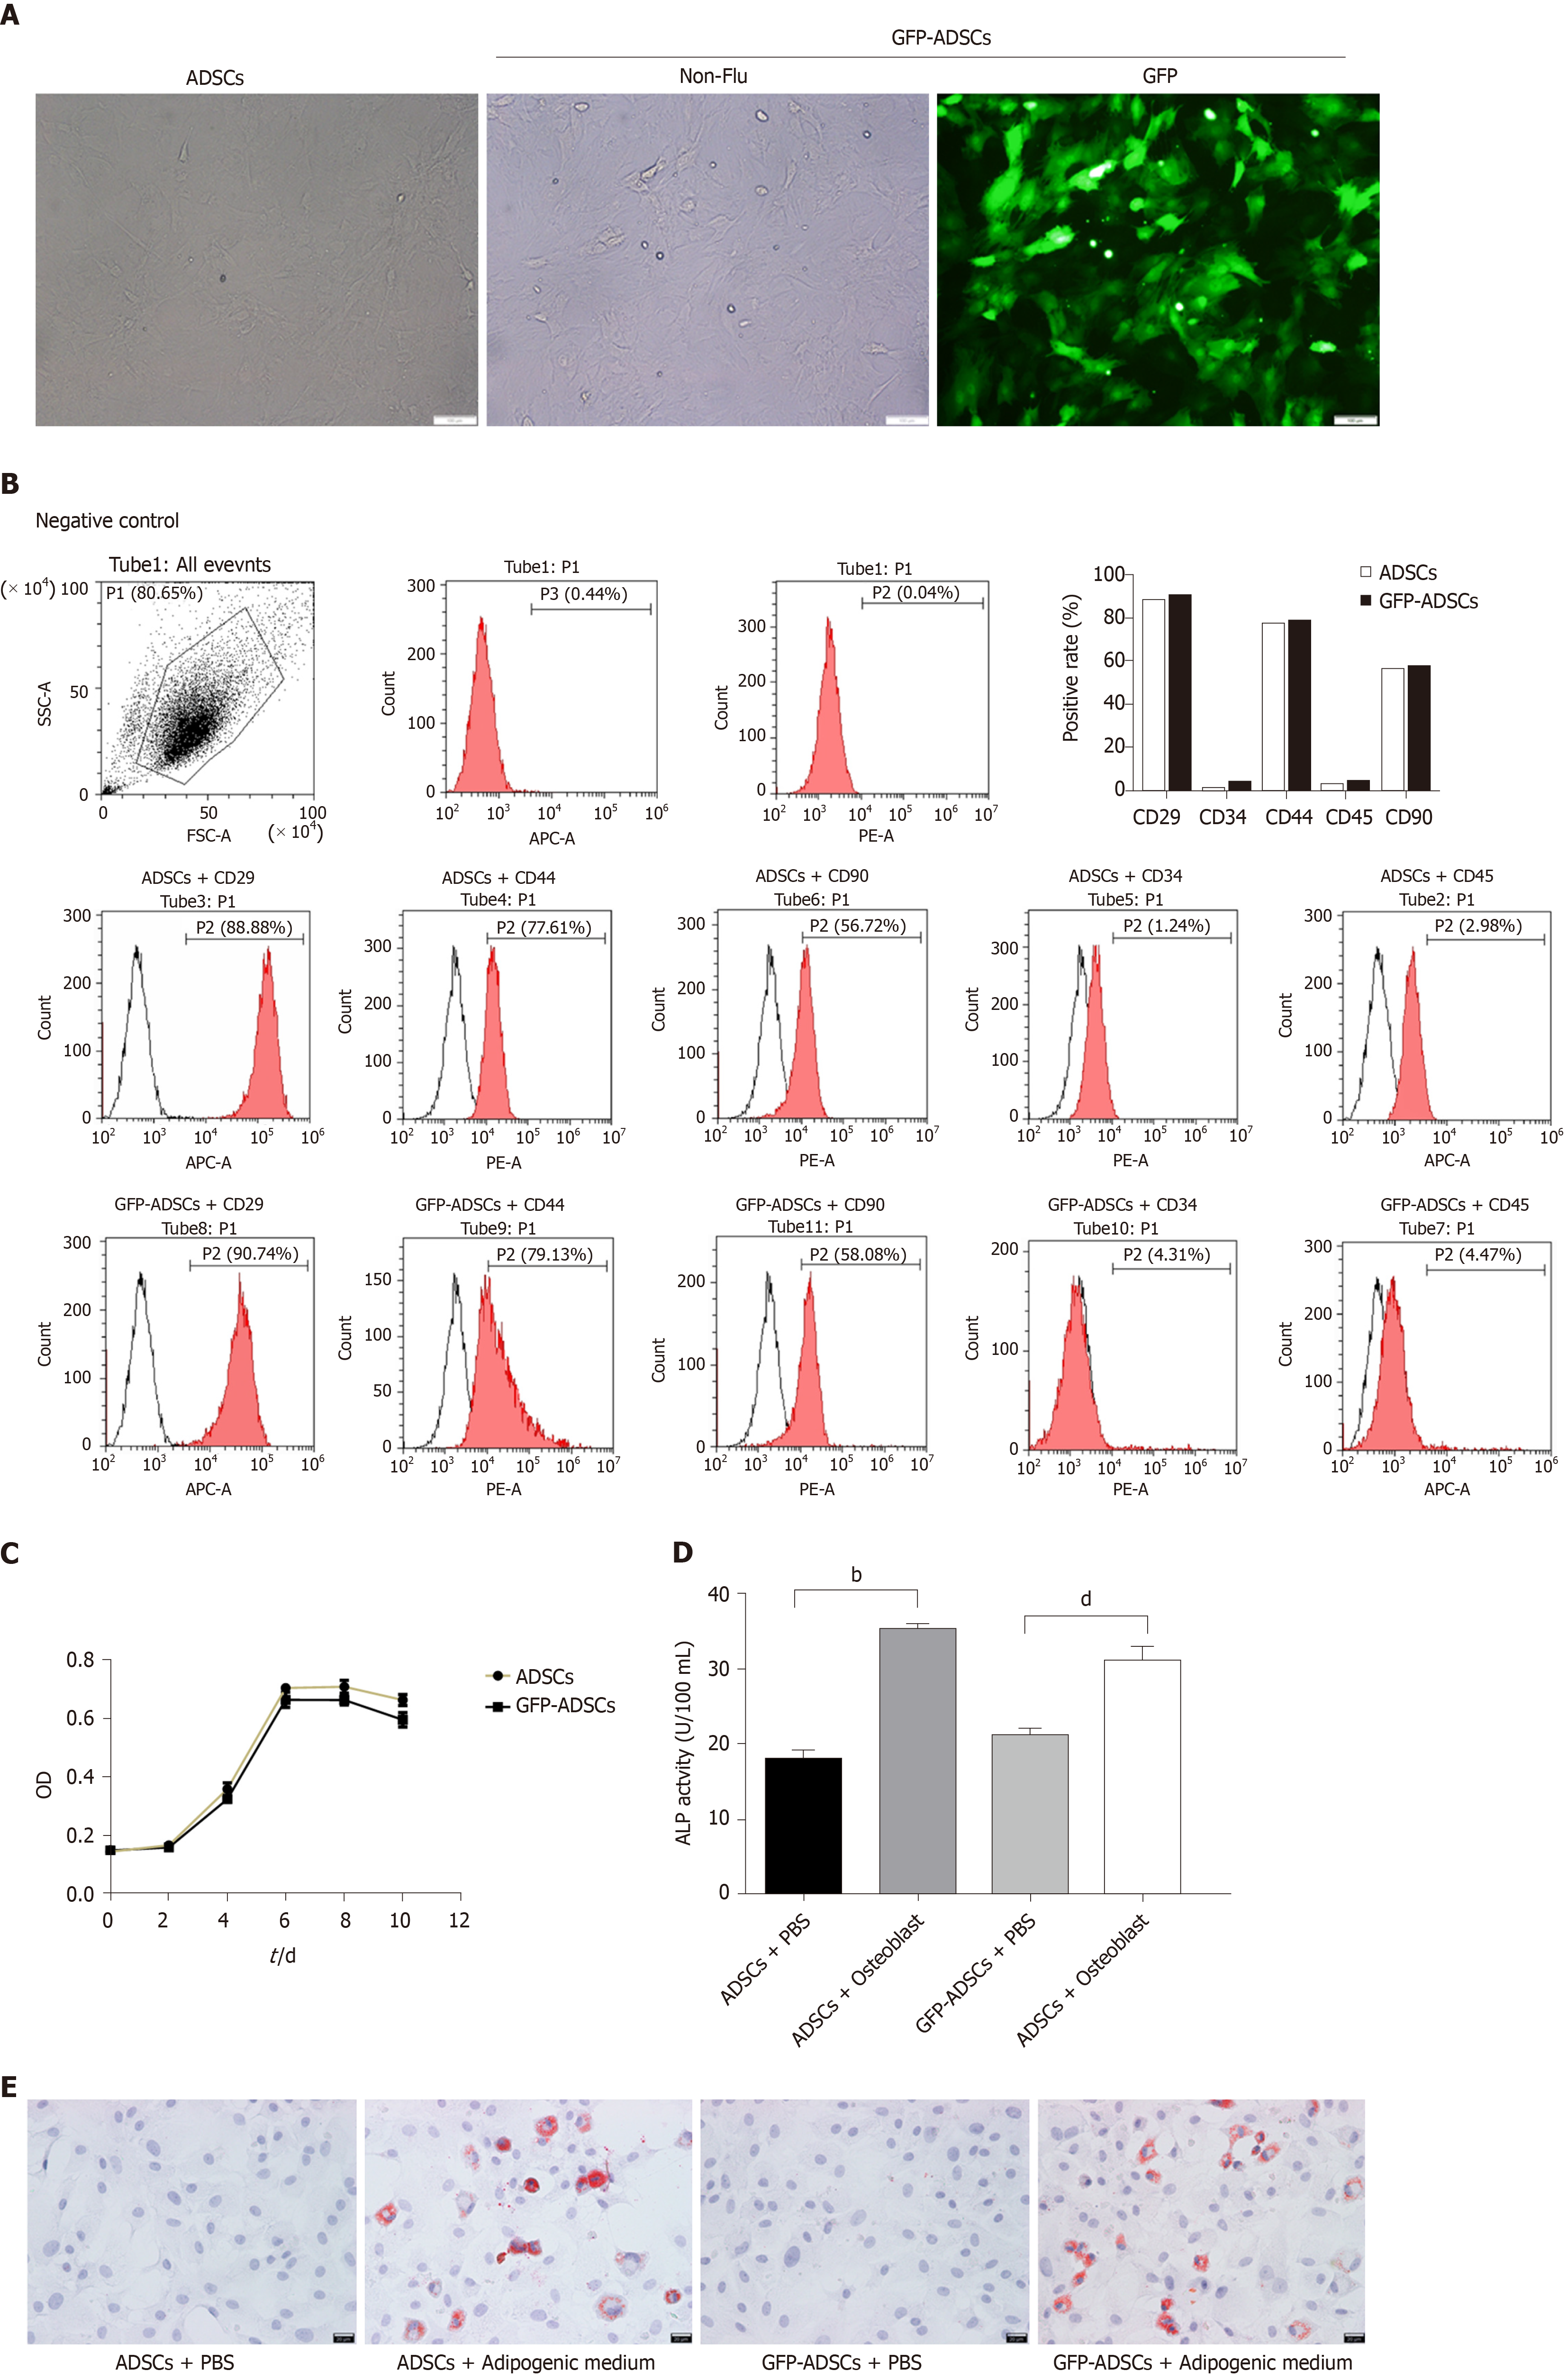
Figure 1 Isolation, culture, and identification of adipose-derived mesenchymal stem cells.
A: Well-grown adipose-derived mesenchymal stem cells (ADSCs) were observed under a microscope (scale bar: 100 μm), and stable expression of green fluorescent protein (GFP) was identified in GFP-ADSCs under a fluorescence microscope (scale bar: 100 μm); B: ADSC surface antigen analysis was carried out by flow cytometry. The characteristic surface biomarkers for ADSCs were confirmed, including CD29, CD44, and CD90 positivity and CD34 and CD45 negativity; C: ADSCs presented a typical S-like proliferation curve; D: Differentiation into osteocytes was confirmed by increased ALP. bP < 0.01 vs ADSCs + PBS, dP < 0.01 vs GFP-ADSCs + PBS; E: Differentiation into adipocytes was confirmed by the presence of lipid vesicles stained with oil red O (scale bar: 20 μm). ADSCs: Adipose-derived mesenchymal stem cells; GFP: Green fluorescent protein.
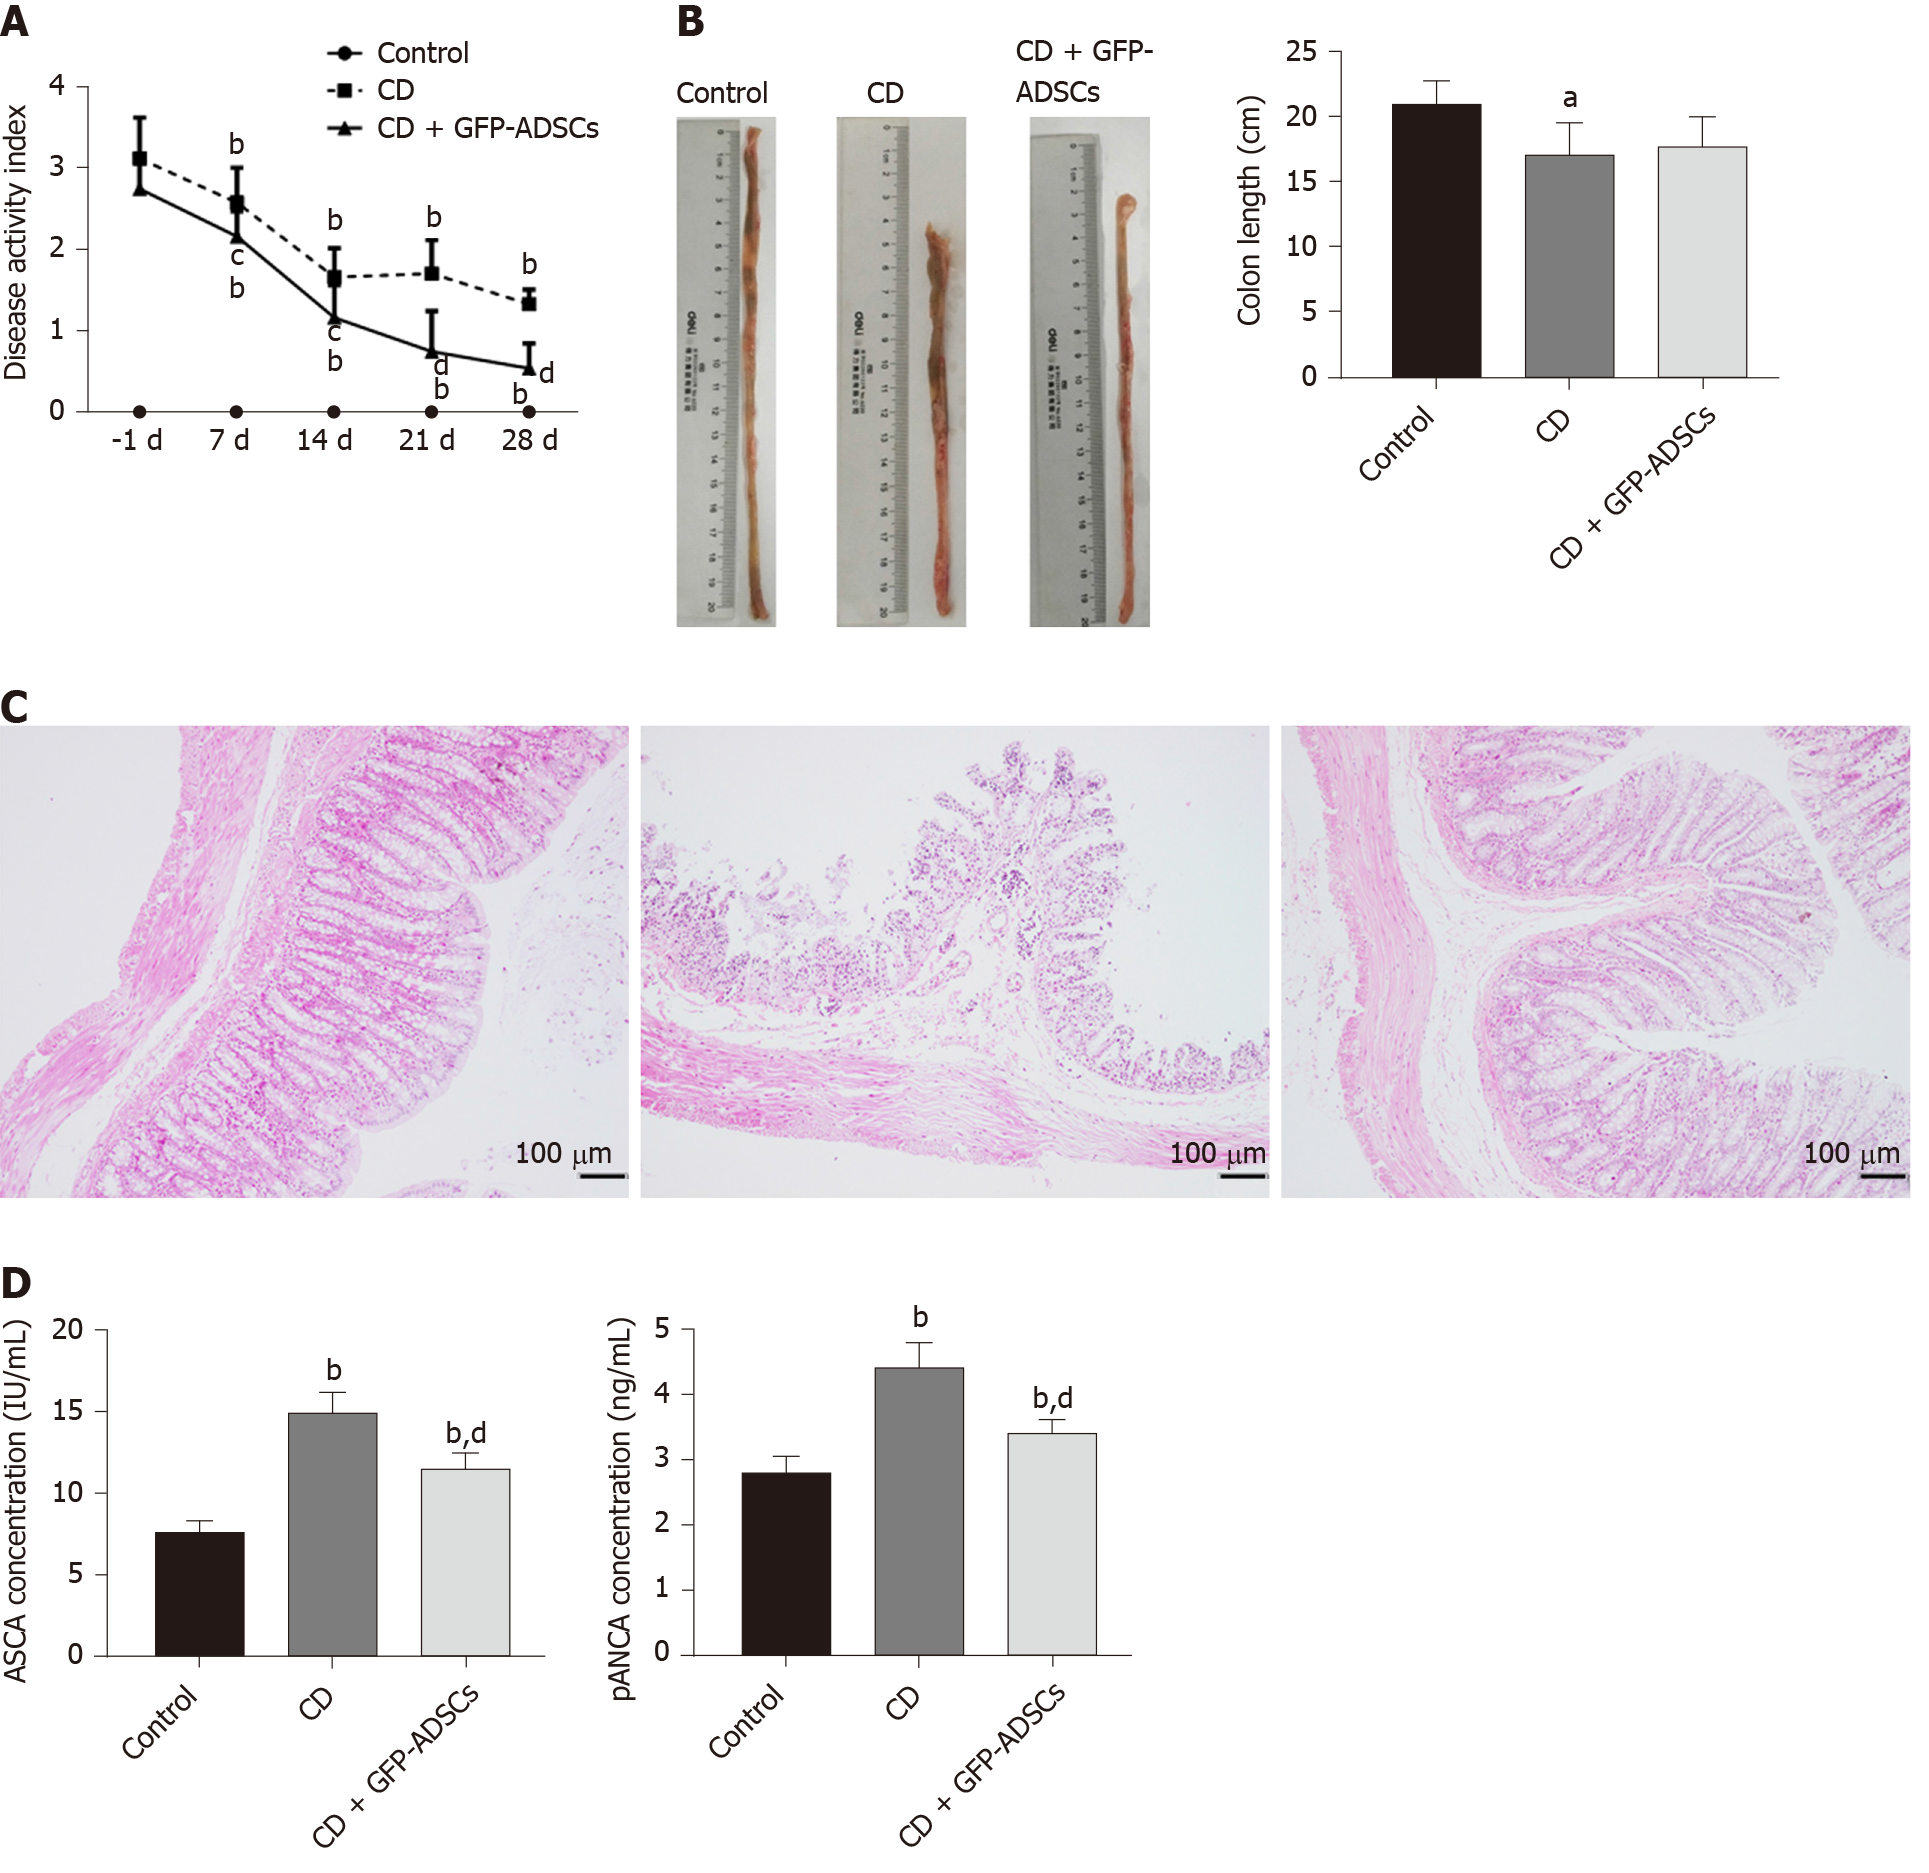
Figure 2 Tail injection of adipose-derived mesenchymal stem cells in rats protects against TNBS-induced colitis.
A: Disease activity index of respective groups from baseline. -1 d indicates the day before adipose-derived mesenchymal stem cell (ADSC) injection, 7 d, 14 d, 21 d, and 28 d represent 7 d, 14 d, 21 d, and 28 d after ADSC therapy, respectively; B: Gross morphology of colon tissue and colon length among the groups; C: Representative hematoxylin and eosin staining of colon tissue in the three groups (scale bar: 100 μm); D: Serum concentrations of anti-sacchromyces cerevisiae antibody and p-antineutrophil cytoplasmic antibody detected by ELISA. Data are presented as the mean ± SD. aP < 0.05, bP < 0.01 vs control group; cP < 0.05, dP < 0.01 vs CD group. ADSCs: Adipose-derived mesenchymal stem cells; CD: Crohn’s disease; GFP: Green fluorescent protein.
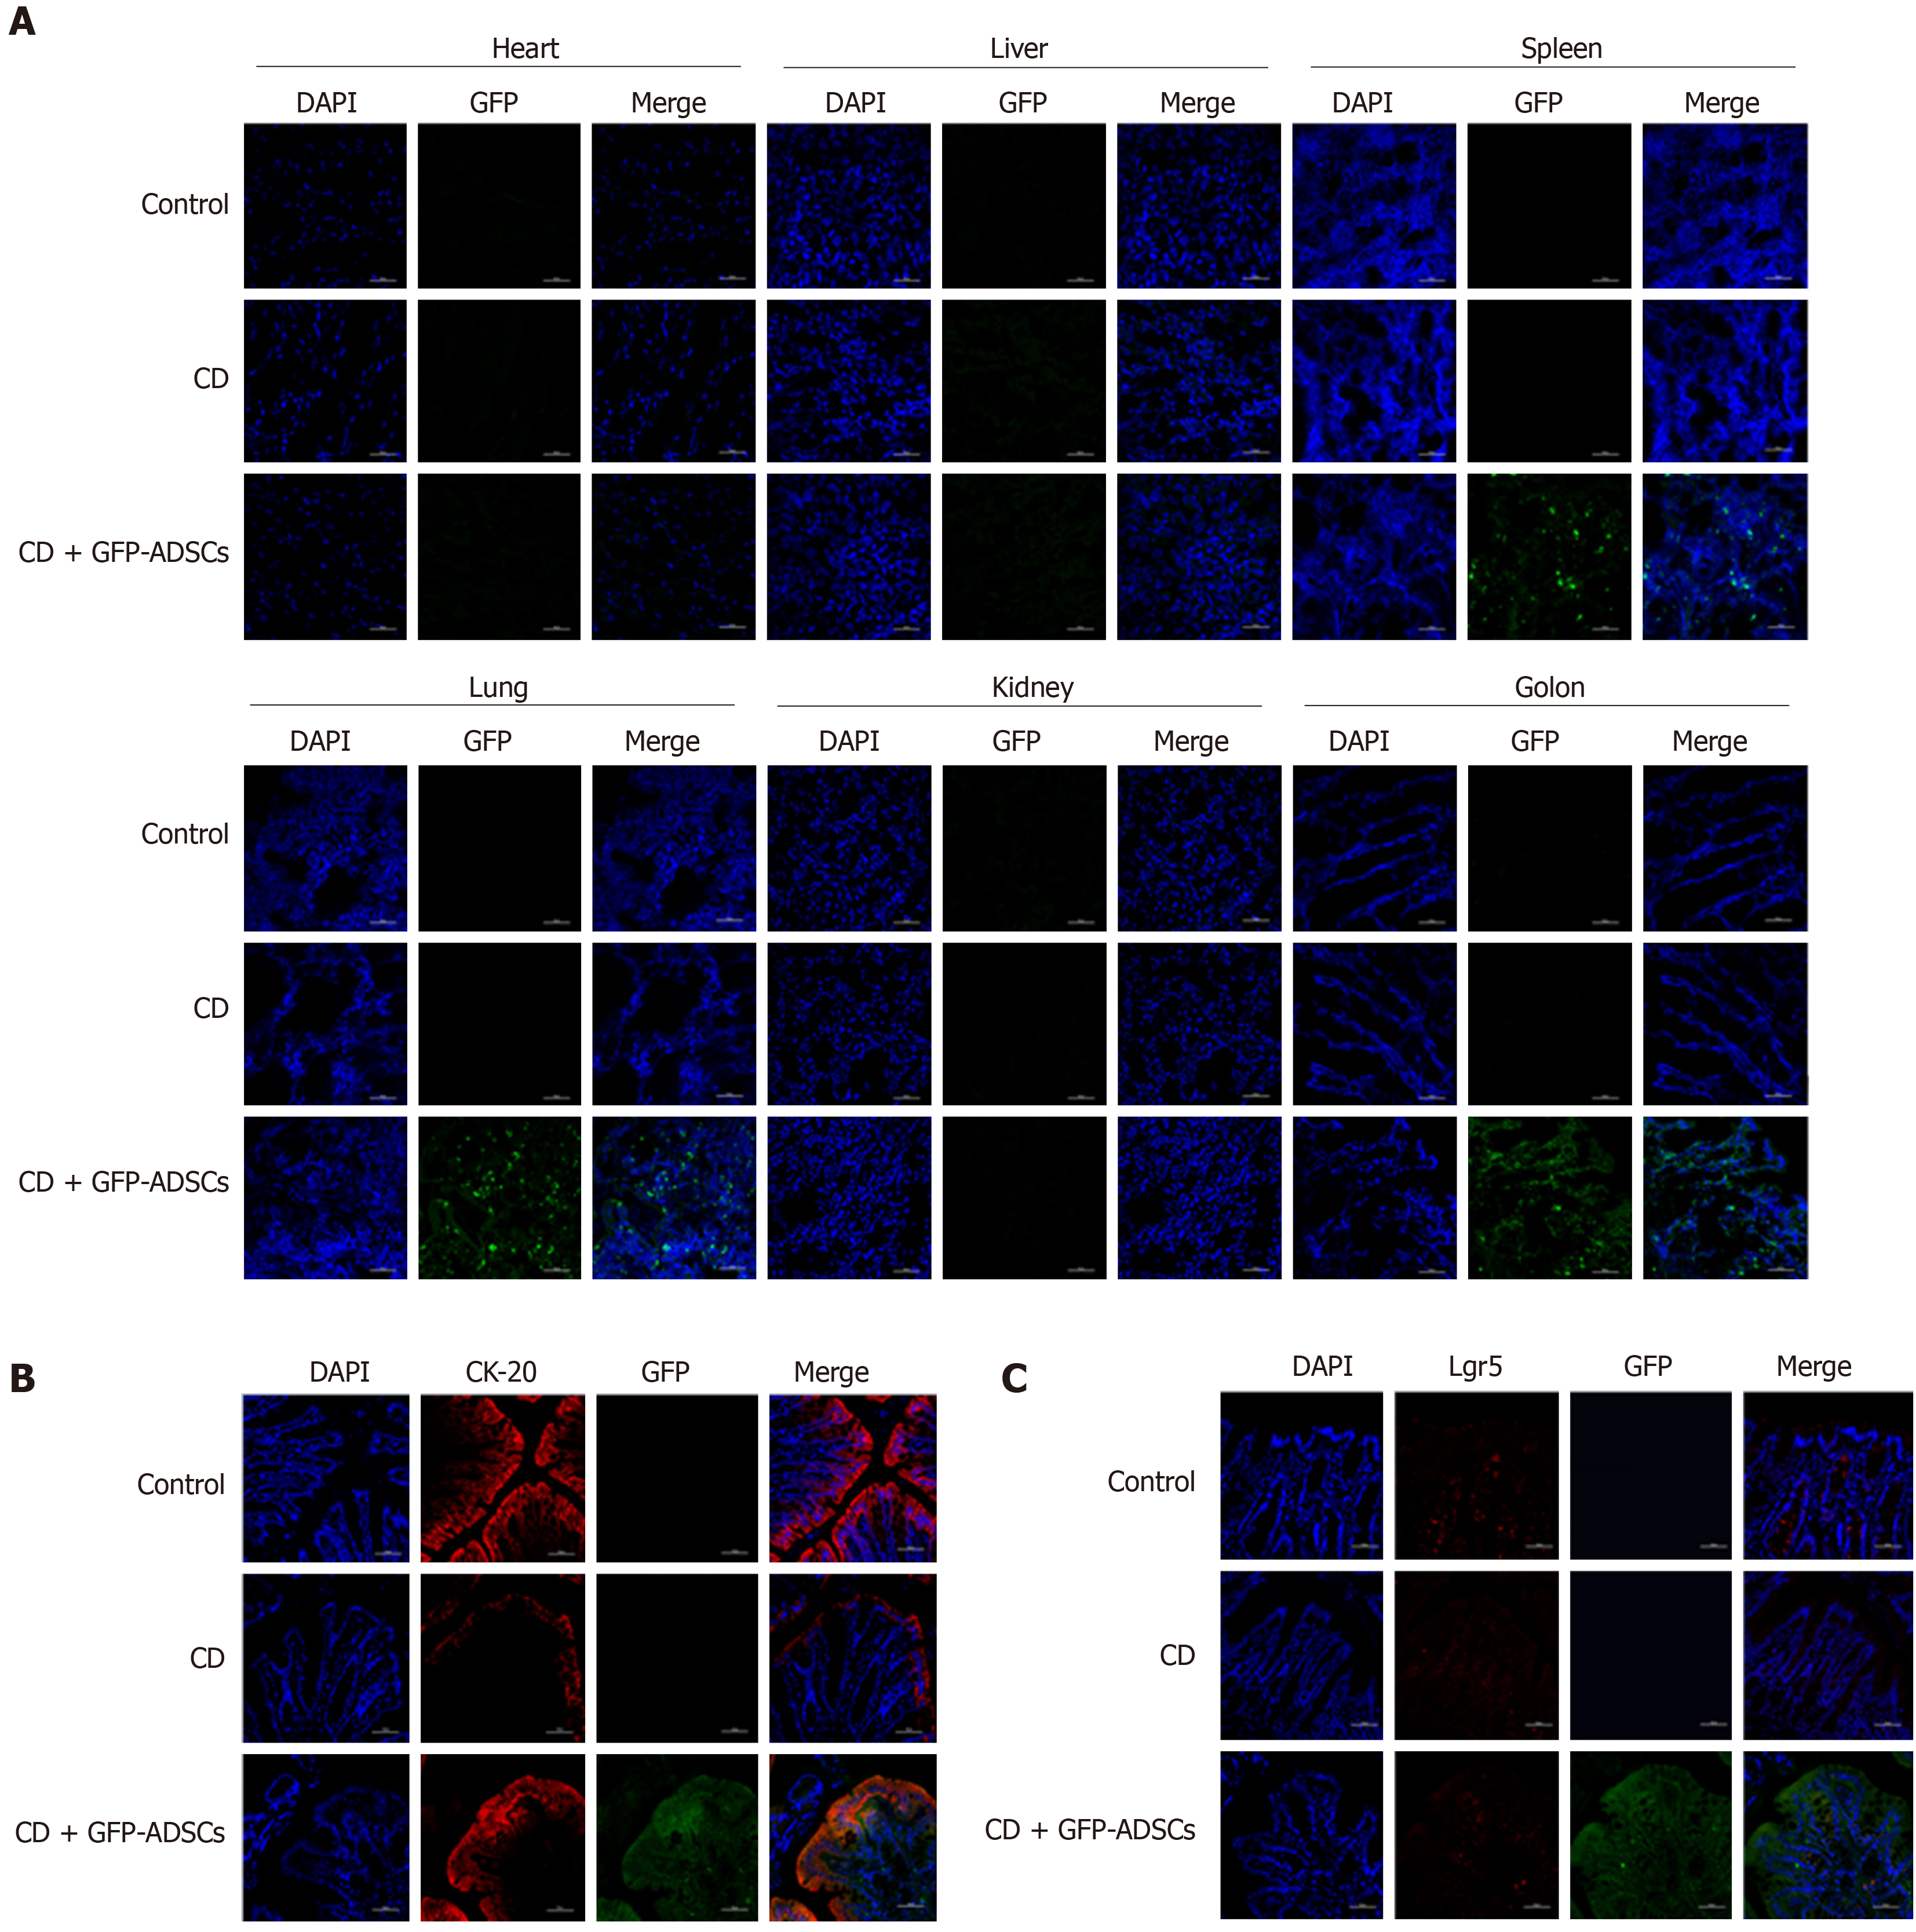
Figure 3 Distribution of adipose-derived mesenchymal stem cells and their colocalization with intestinal stem cells and intestinal epithelial cells.
A: Distribution of green fluorescent protein (GFP)-positive adipose-derived mesenchymal stem cells (ADSCs) was detected mostly in the inflamed colon (scale bar: 50 μm); B: Immunofluorescence analysis for GFP and CK-20 showed the colocalization between ADSCs and intestinal epithelial cells (scale bar: 50 μm); C: Immunofluorescence analysis for GFP and Lgr5 showed that there was no colocalization between ADSCs and intestinal stem cells (scale bar: 50 μm). ADSCs: adipose-derived mesenchymal stem cells; CD: Crohn’s disease; GFP: Green fluorescent protein.
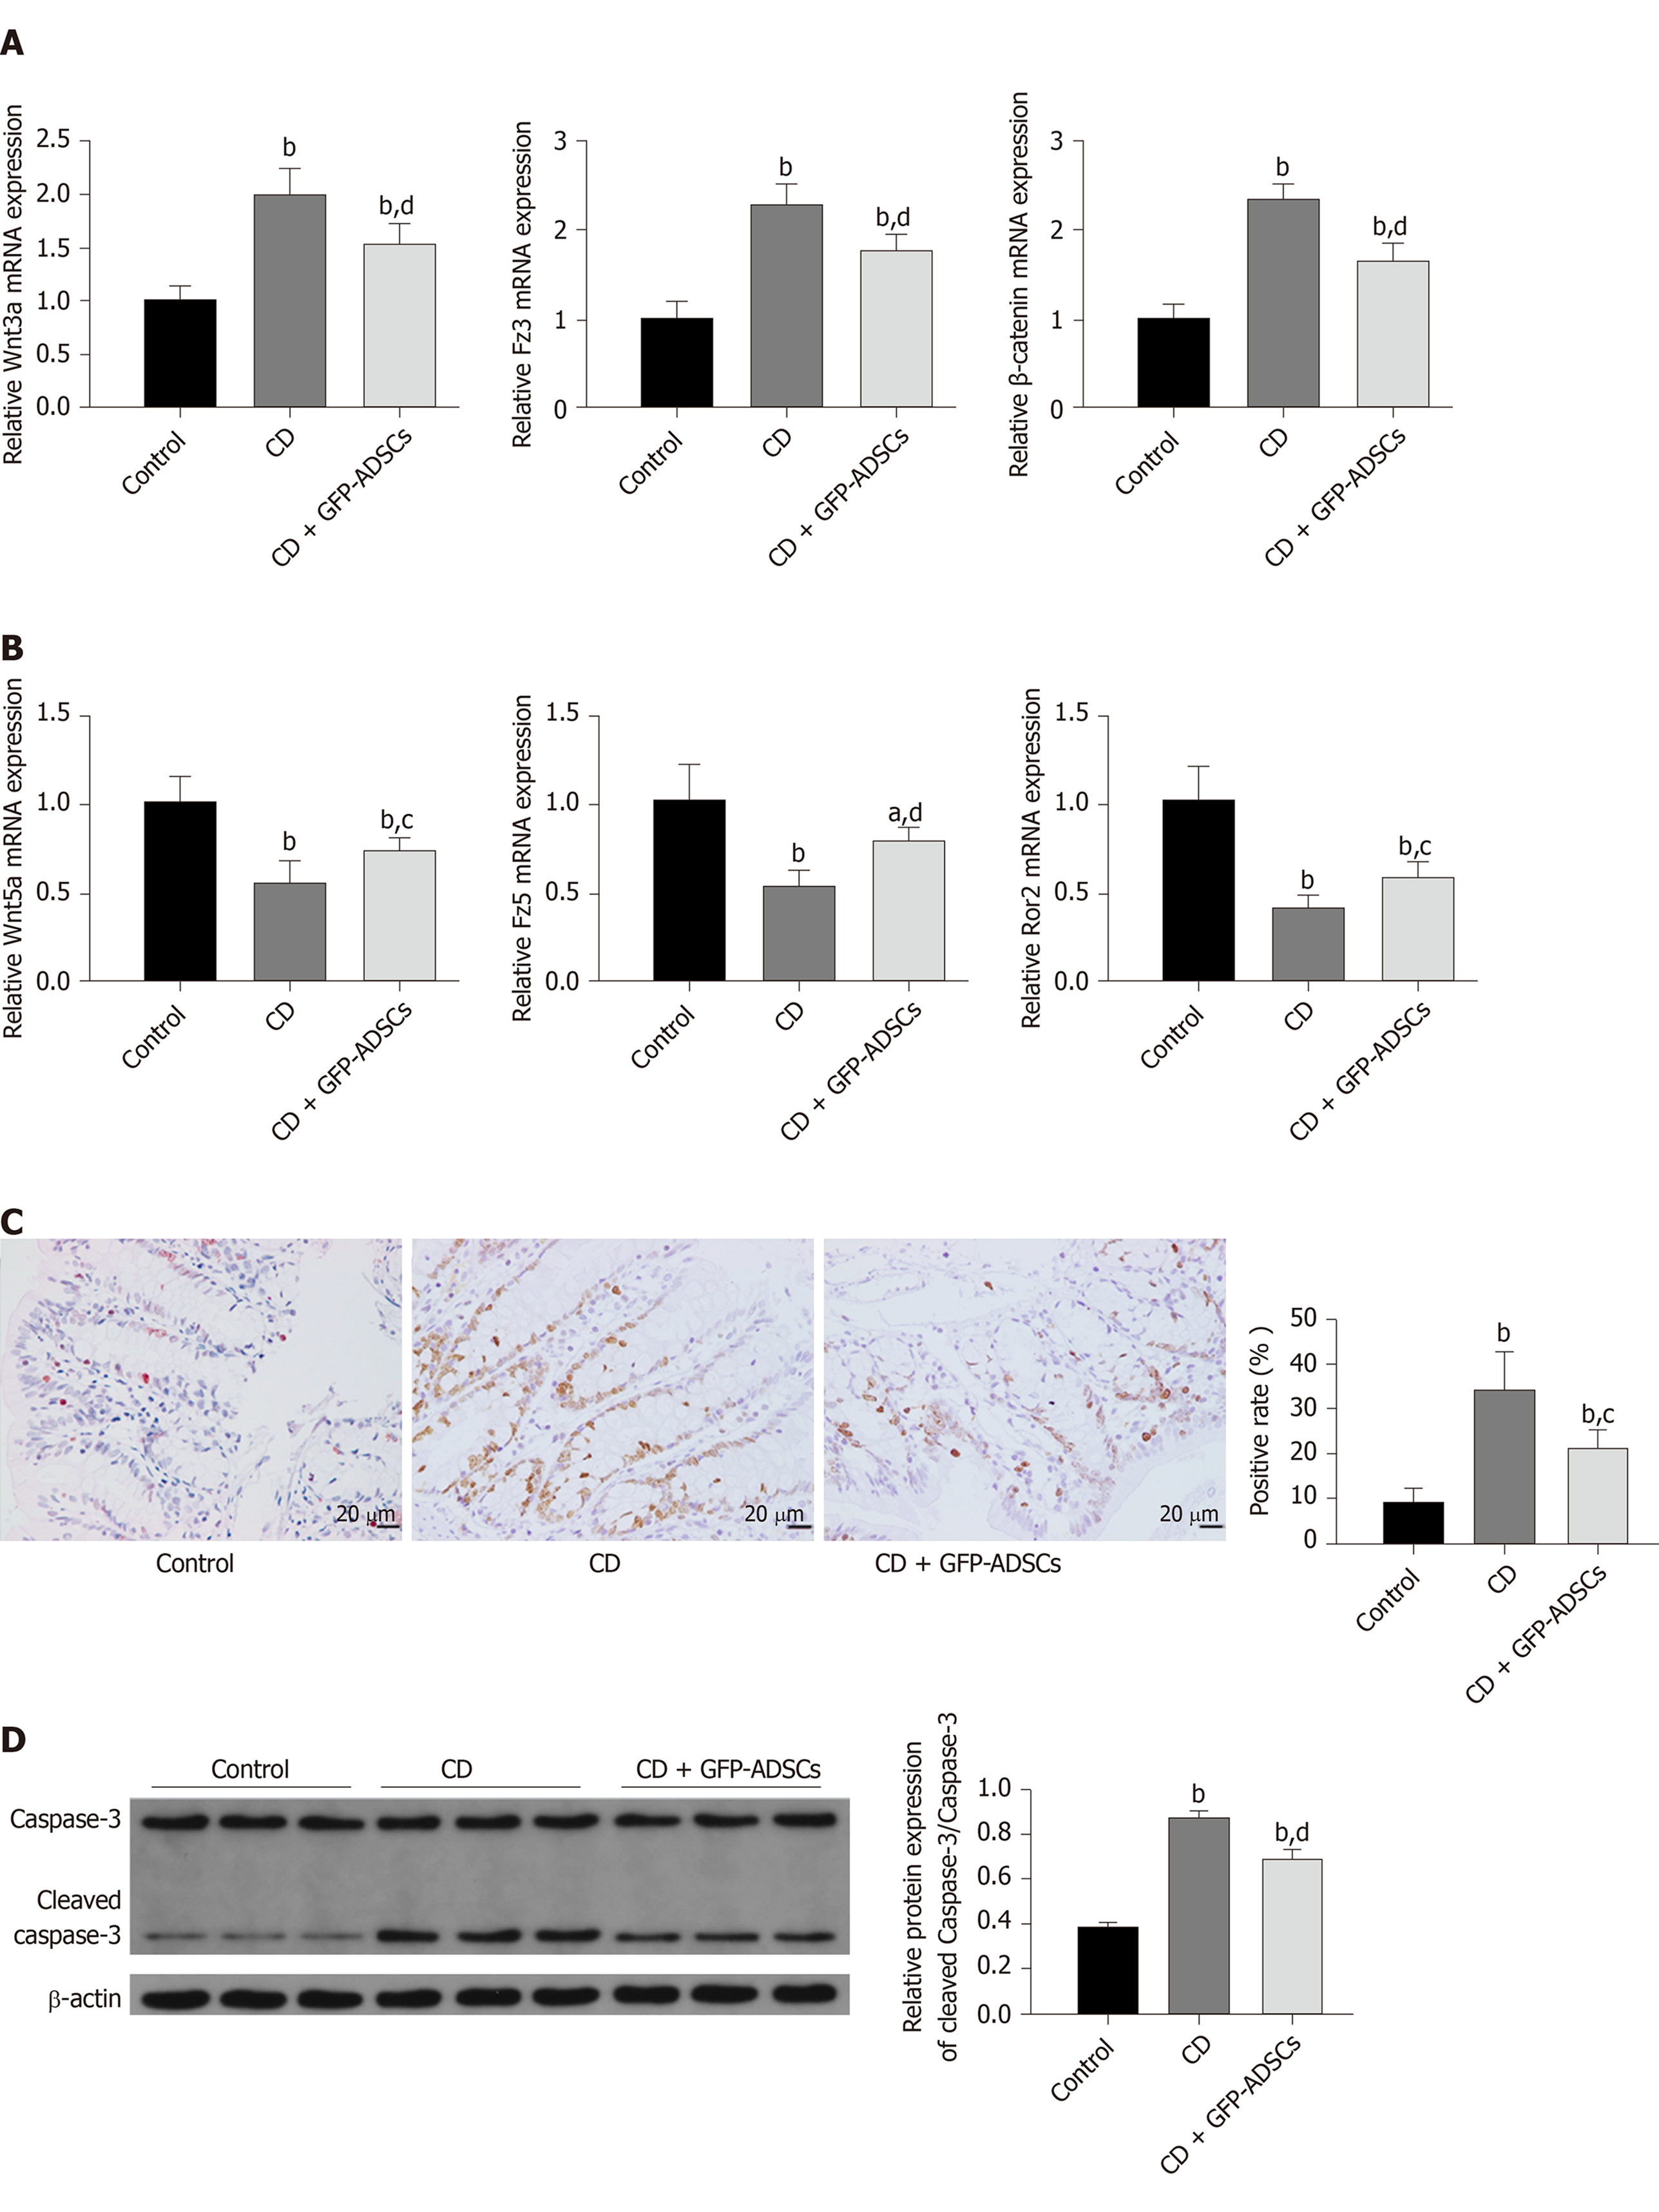
Figure 4 Effect and mechanism of adipose-derived mesenchymal stem cell administration in rats with TNBS-induced colitis.
A: mRNA from colonic extracts was analyzed by qRT-PCR for the major molecules in the canonical Wnt signaling pathway: Wnt3a, Fz3, and β-catenin; B: mRNA from colonic extracts was analyzed by qRT-PCR for the major molecules in the noncanonical Wnt signaling pathway: Wnt5a, Fz5, and Ror2. Expression is presented as a ratio of cytokine/β-actin; C: Apoptosis of colonic cells was visualized by a TUNEL assay (scale bar: 20 μm), and semiquantitative analysis was performed; D: The expression of caspase-3 and cleaved-caspase 3 was evaluated by Western blot and compared among the control, CD, and GFP-ADSC therapy groups. Quantification is expressed as the fold induction. Data are presented as the mean ± SD. aP < 0.05, bP < 0.01 vs control group; cP < 0.05, dP < 0.01 vs CD group. ADSCs: Adipose-derived mesenchymal stem cells; CD: Crohn’s disease; GFP: Green fluorescent protein.
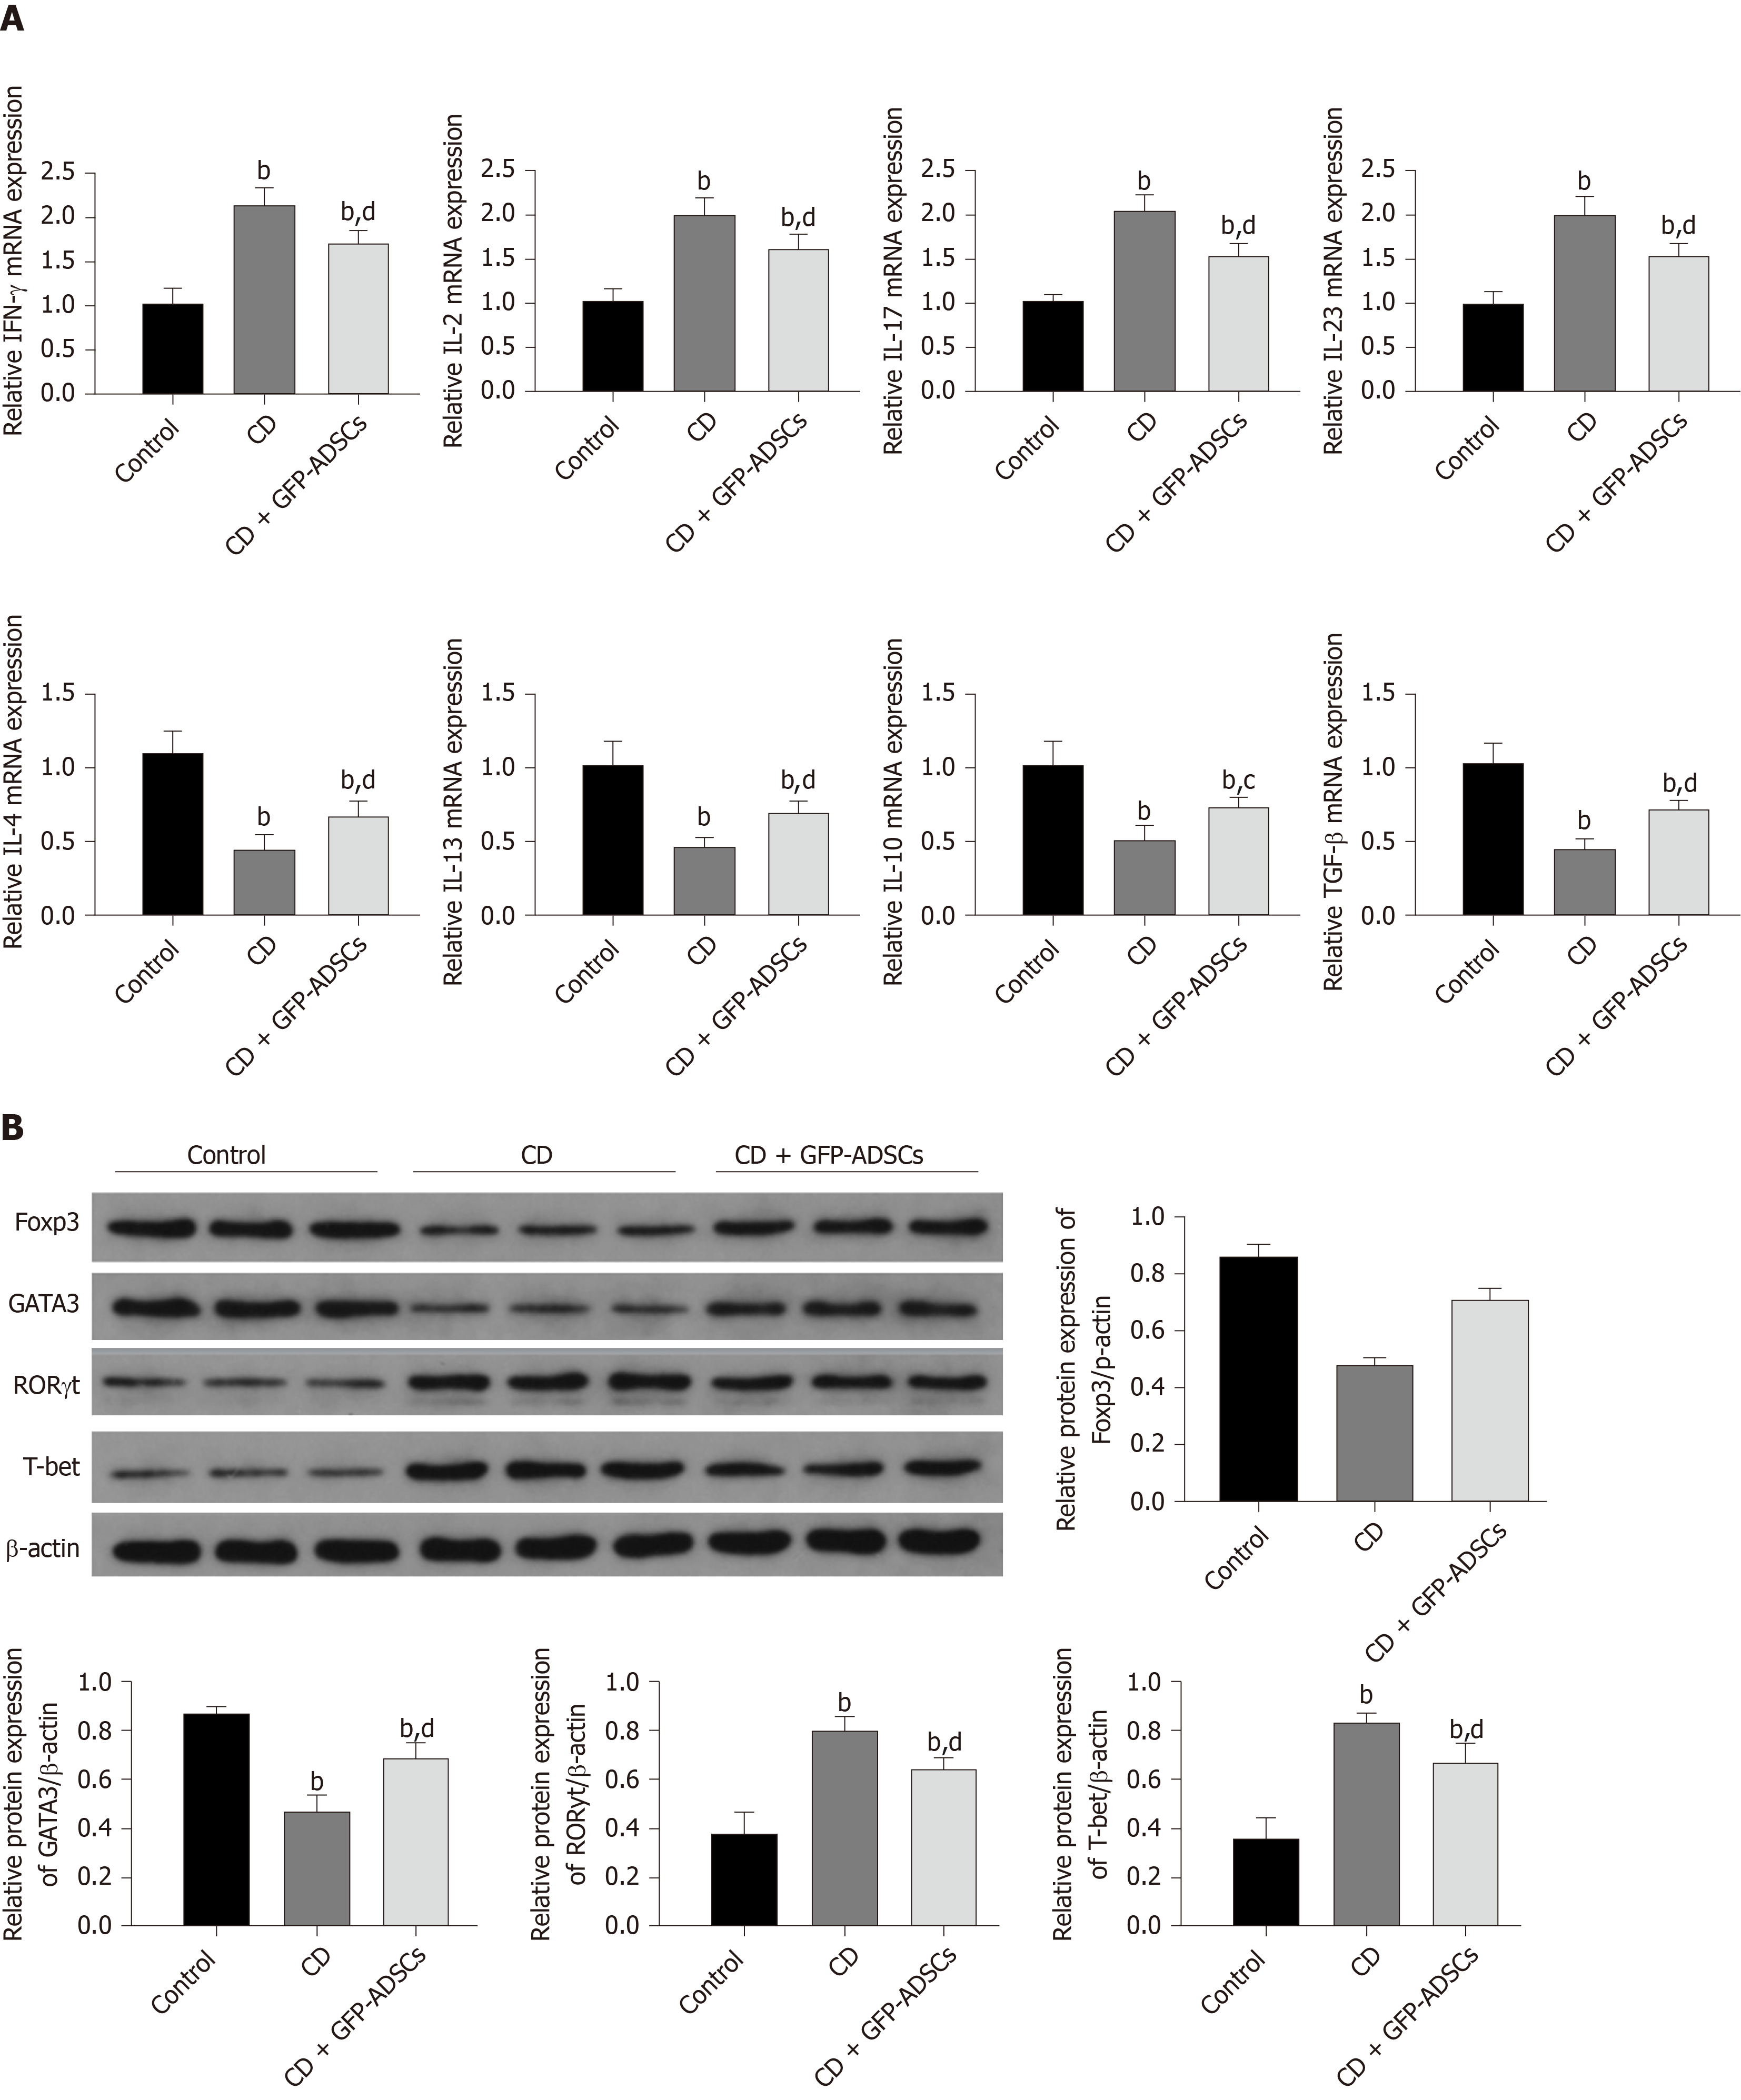
Figure 5 Changes in inflammatory markers and T cell-secreted molecules.
A: Total mRNA from colonic extracts was analyzed by qRT-PCR for inflammatory cytokines involved in colitis: IFN-γ, IL-2, IL-17, IL-23, IL-4, IL-13, IL-10, and TGF-β; B: Western blot analysis of Foxp3, GATA3, RORγ, and T-bet. Data are presented as the mean ± SD. bP < 0.01 vs control group; cP < 0.05, dP < 0.01 vs CD group. IFN-γ: Interferon-γ; IL-6: Interleukin-6; IL-17: Interleukin-17; IL-23: Interleukin-23; IL-4: Interleukin-4; IL-13: Interleukin-13; IL-10: Interleukin-10; TGF-β: Transforming growth factor. ADSCs: Adipose-derived mesenchymal stem cells; CD: Crohn’s disease; GFP: Green fluorescent protein.
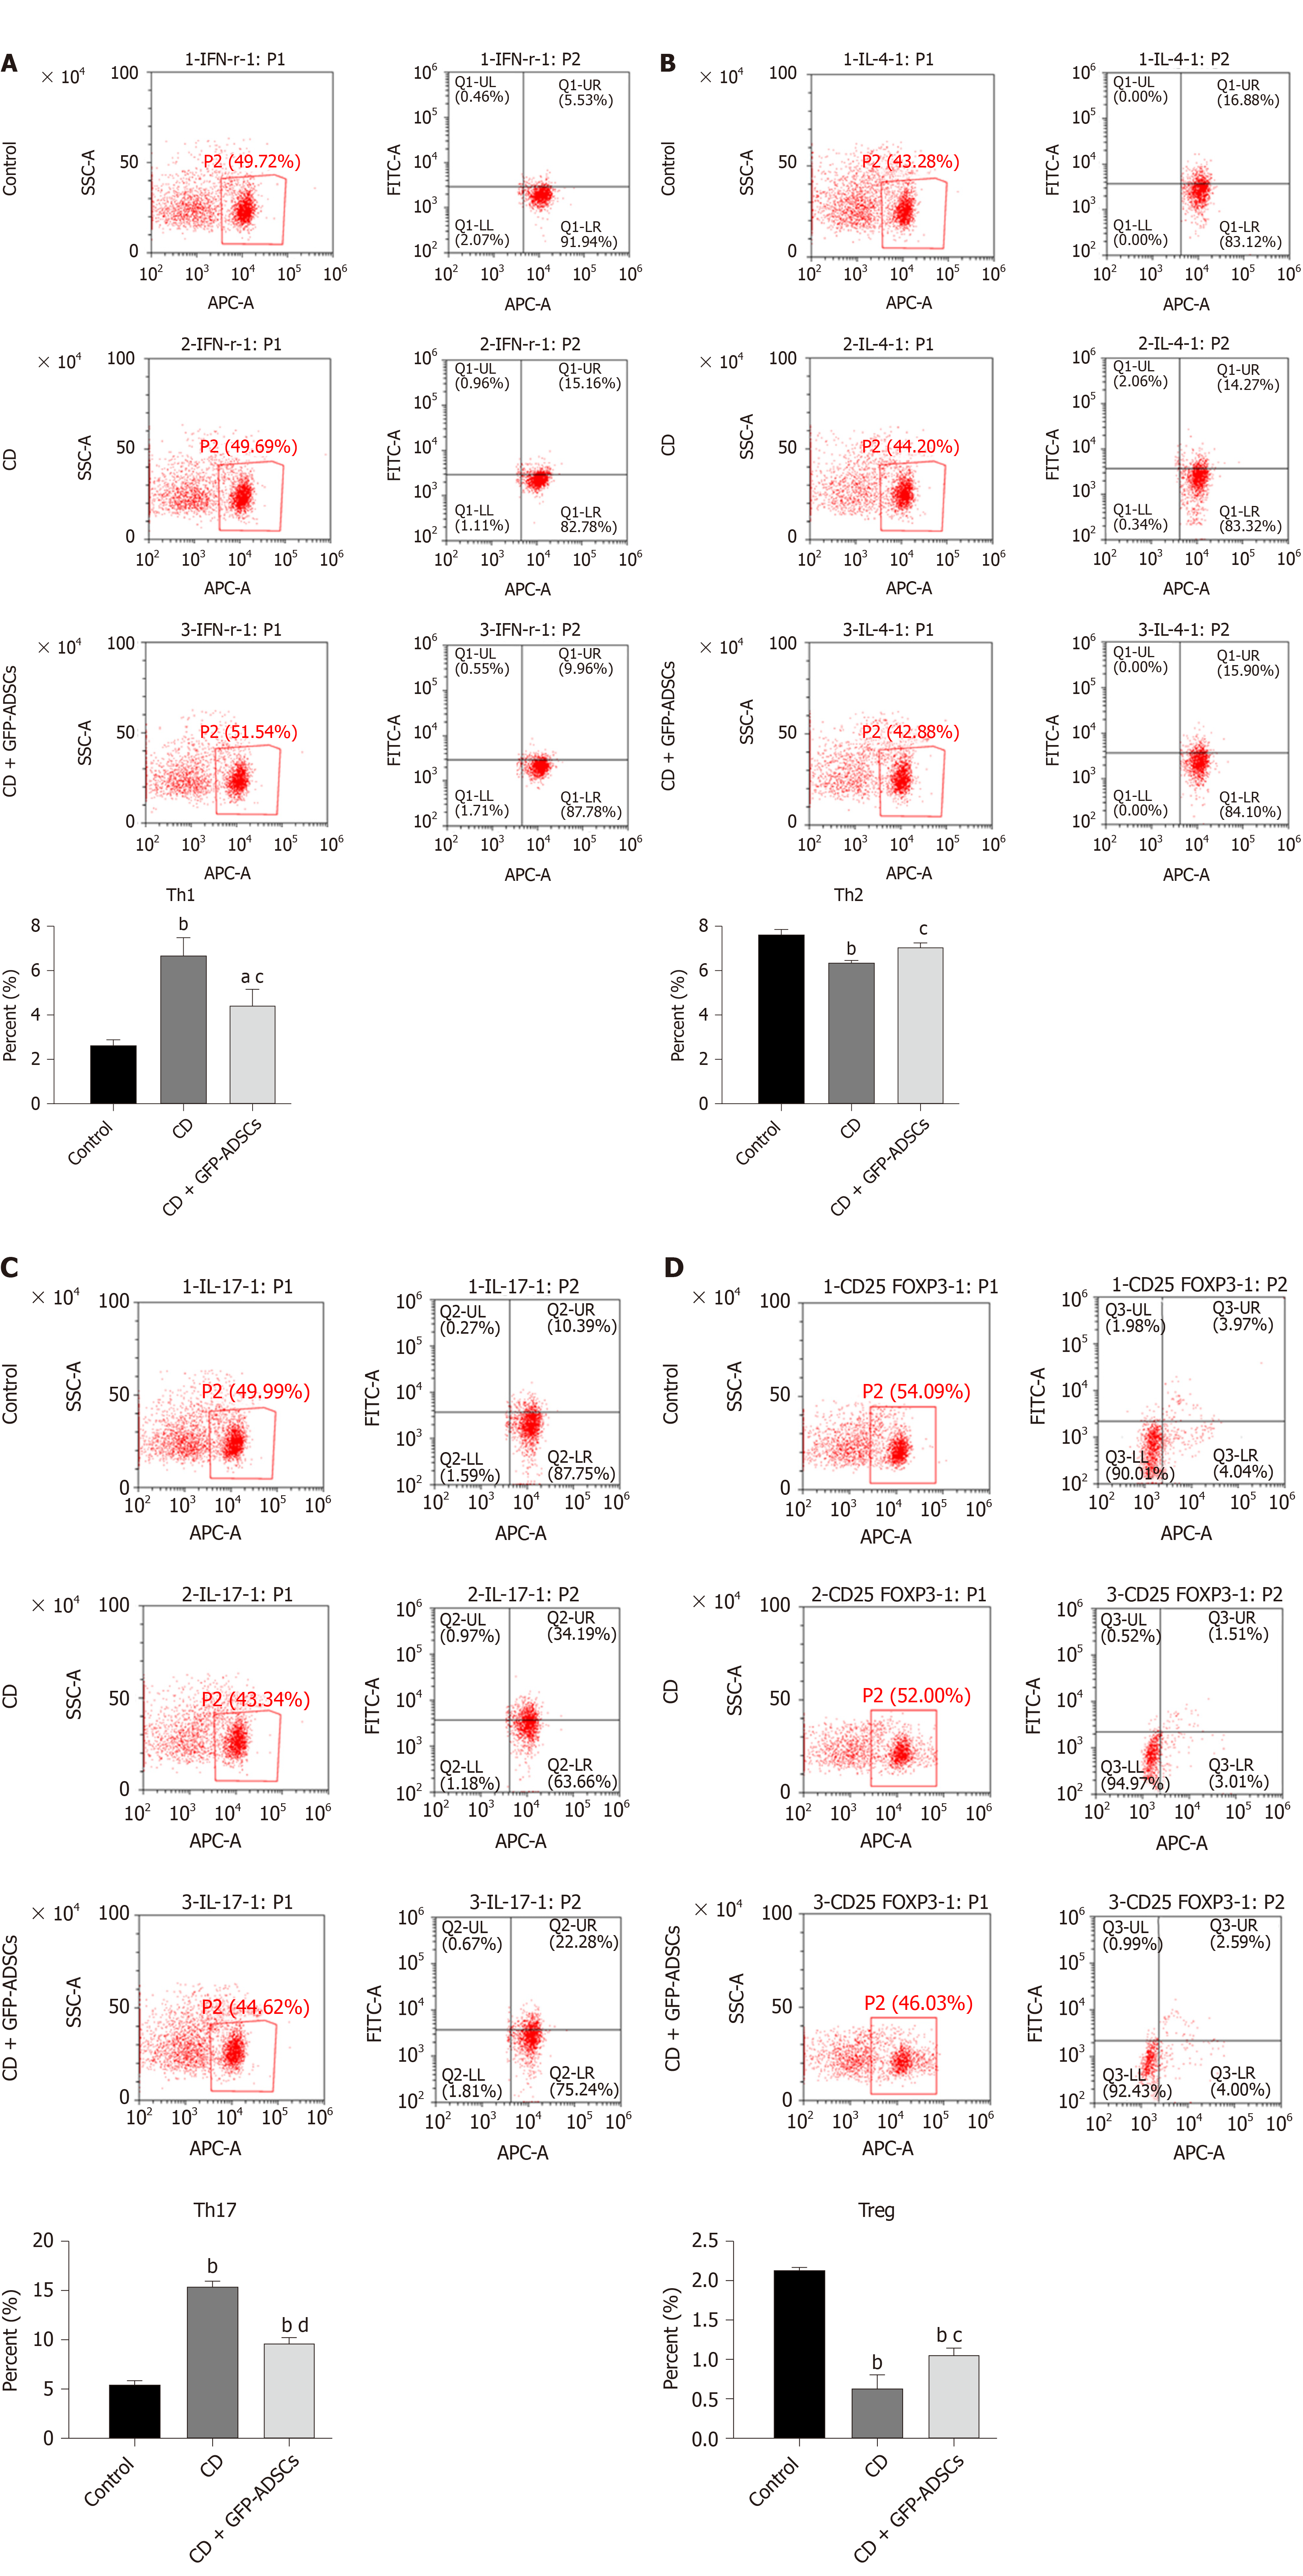
Figure 6 Tail injection of adipose-derived mesenchymal stem cells corrects the T cell imbalance in TNBS-induced colitis.
The administration of ADSCs suppressed the overproduction of Th1 and Th17 cells induced by trinitrobenzene sulfonic acid and upregulated the decline of Th2 and Treg cells, as shown by flow cytometry. A: Th1 expression; B: Th2 expression; C: Th17 expression; D: Treg expression. Data are presented as the mean ± SD. aP < 0.05, bP < 0.01 vs control group; cP < 0.05, dP < 0.01 vs CD group. ADSCs: Adipose-derived mesenchymal stem cells; GFP: CD: Crohn’s disease; Green fluorescent protein.
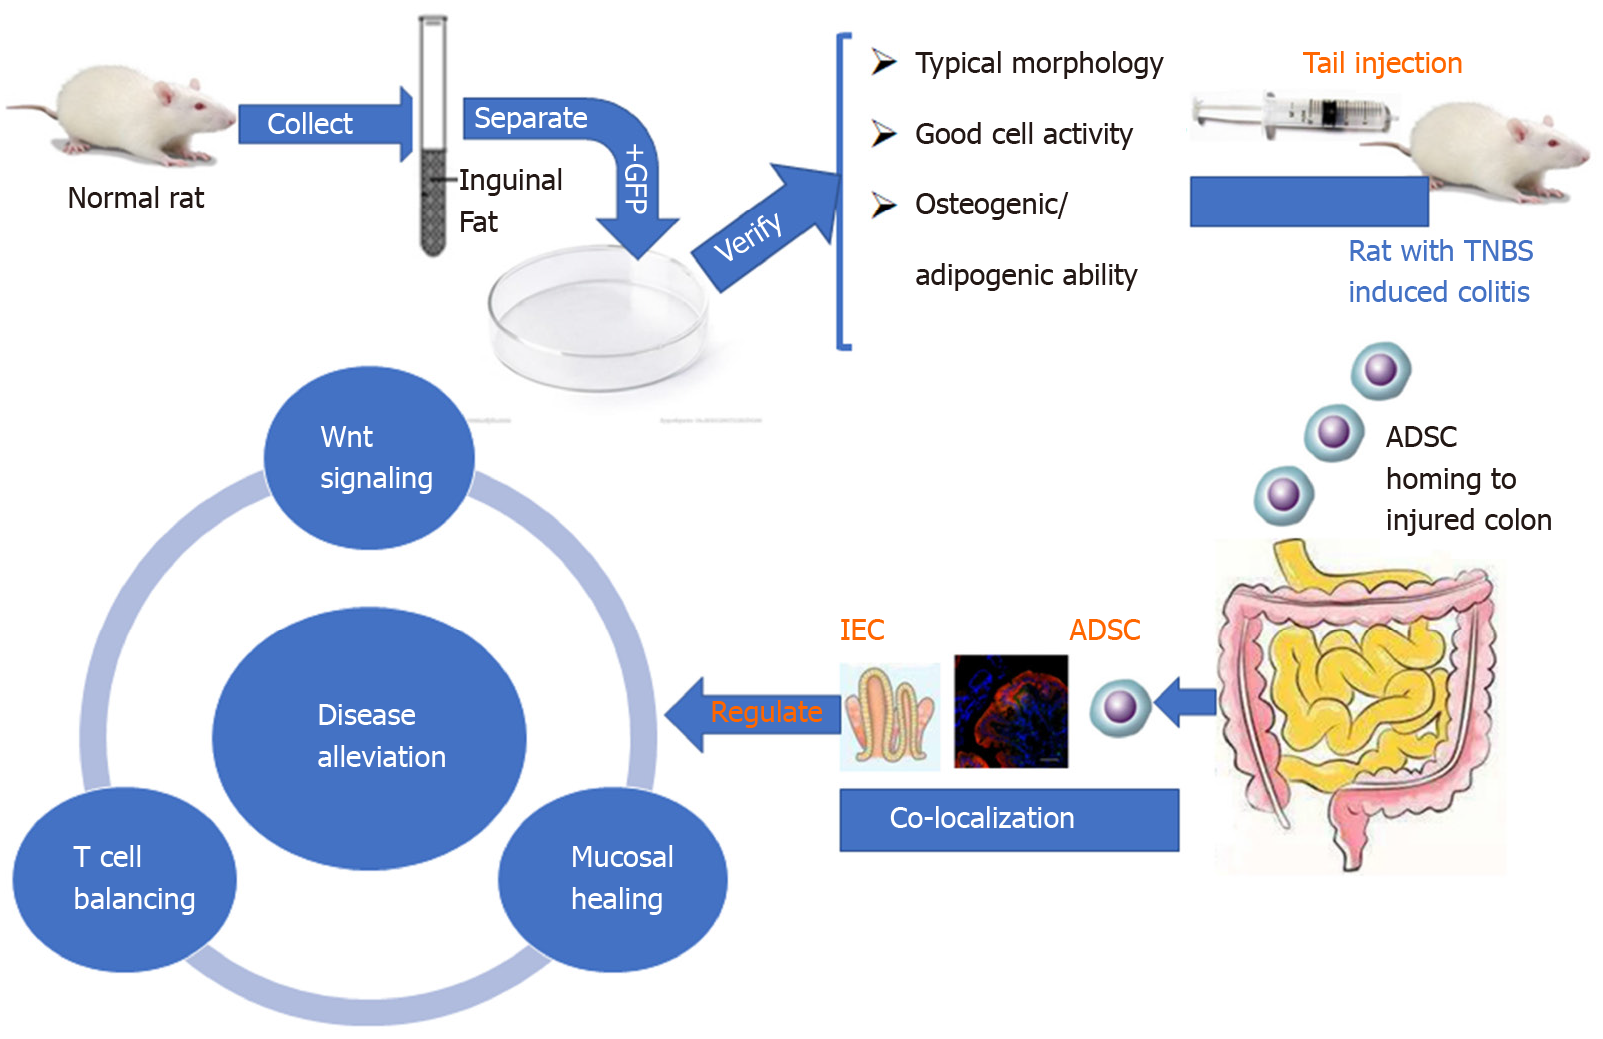
Figure 7 Schematic diagram of the sequential steps and potential mechanism of adipose-derived mesenchymal stem cells in treating the Crohn’s disease phenotype.
ADSC: Adipose-derived mesenchymal stem cell; GFP: Green fluorescent protein; TNBS: Trinitrobenzene sulfonic acid; IEC: intestinal epithelial cell.
- Citation: Gao JG, Yu MS, Zhang MM, Gu XW, Ren Y, Zhou XX, Chen D, Yan TL, Li YM, Jin X. Adipose-derived mesenchymal stem cells alleviate TNBS-induced colitis in rats by influencing intestinal epithelial cell regeneration, Wnt signaling, and T cell immunity. World J Gastroenterol 2020; 26(26): 3750-3766
- URL: https://www.wjgnet.com/1007-9327/full/v26/i26/3750.htm
- DOI: https://dx.doi.org/10.3748/wjg.v26.i26.3750


