Copyright
©The Author(s) 2020.
World J Gastroenterol. Jun 21, 2020; 26(23): 3304-3317
Published online Jun 21, 2020. doi: 10.3748/wjg.v26.i23.3304
Published online Jun 21, 2020. doi: 10.3748/wjg.v26.i23.3304
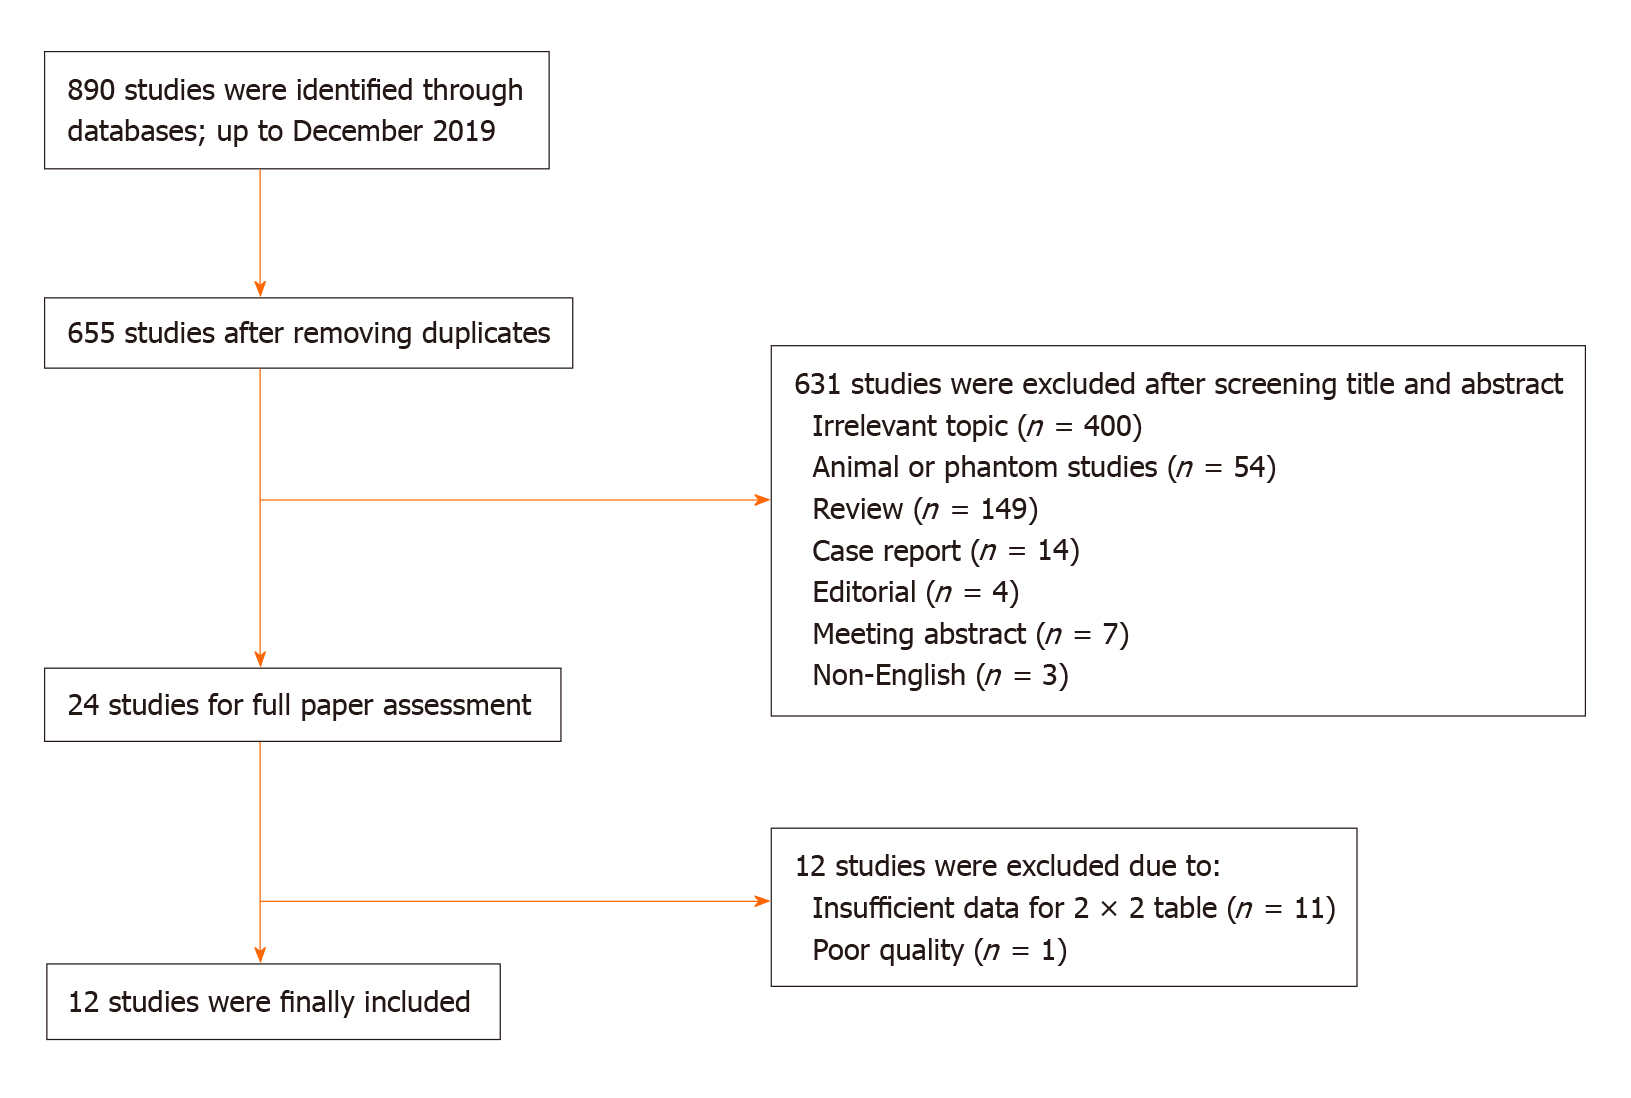
Figure 1 Flowchart of study inclusion and exclusion.
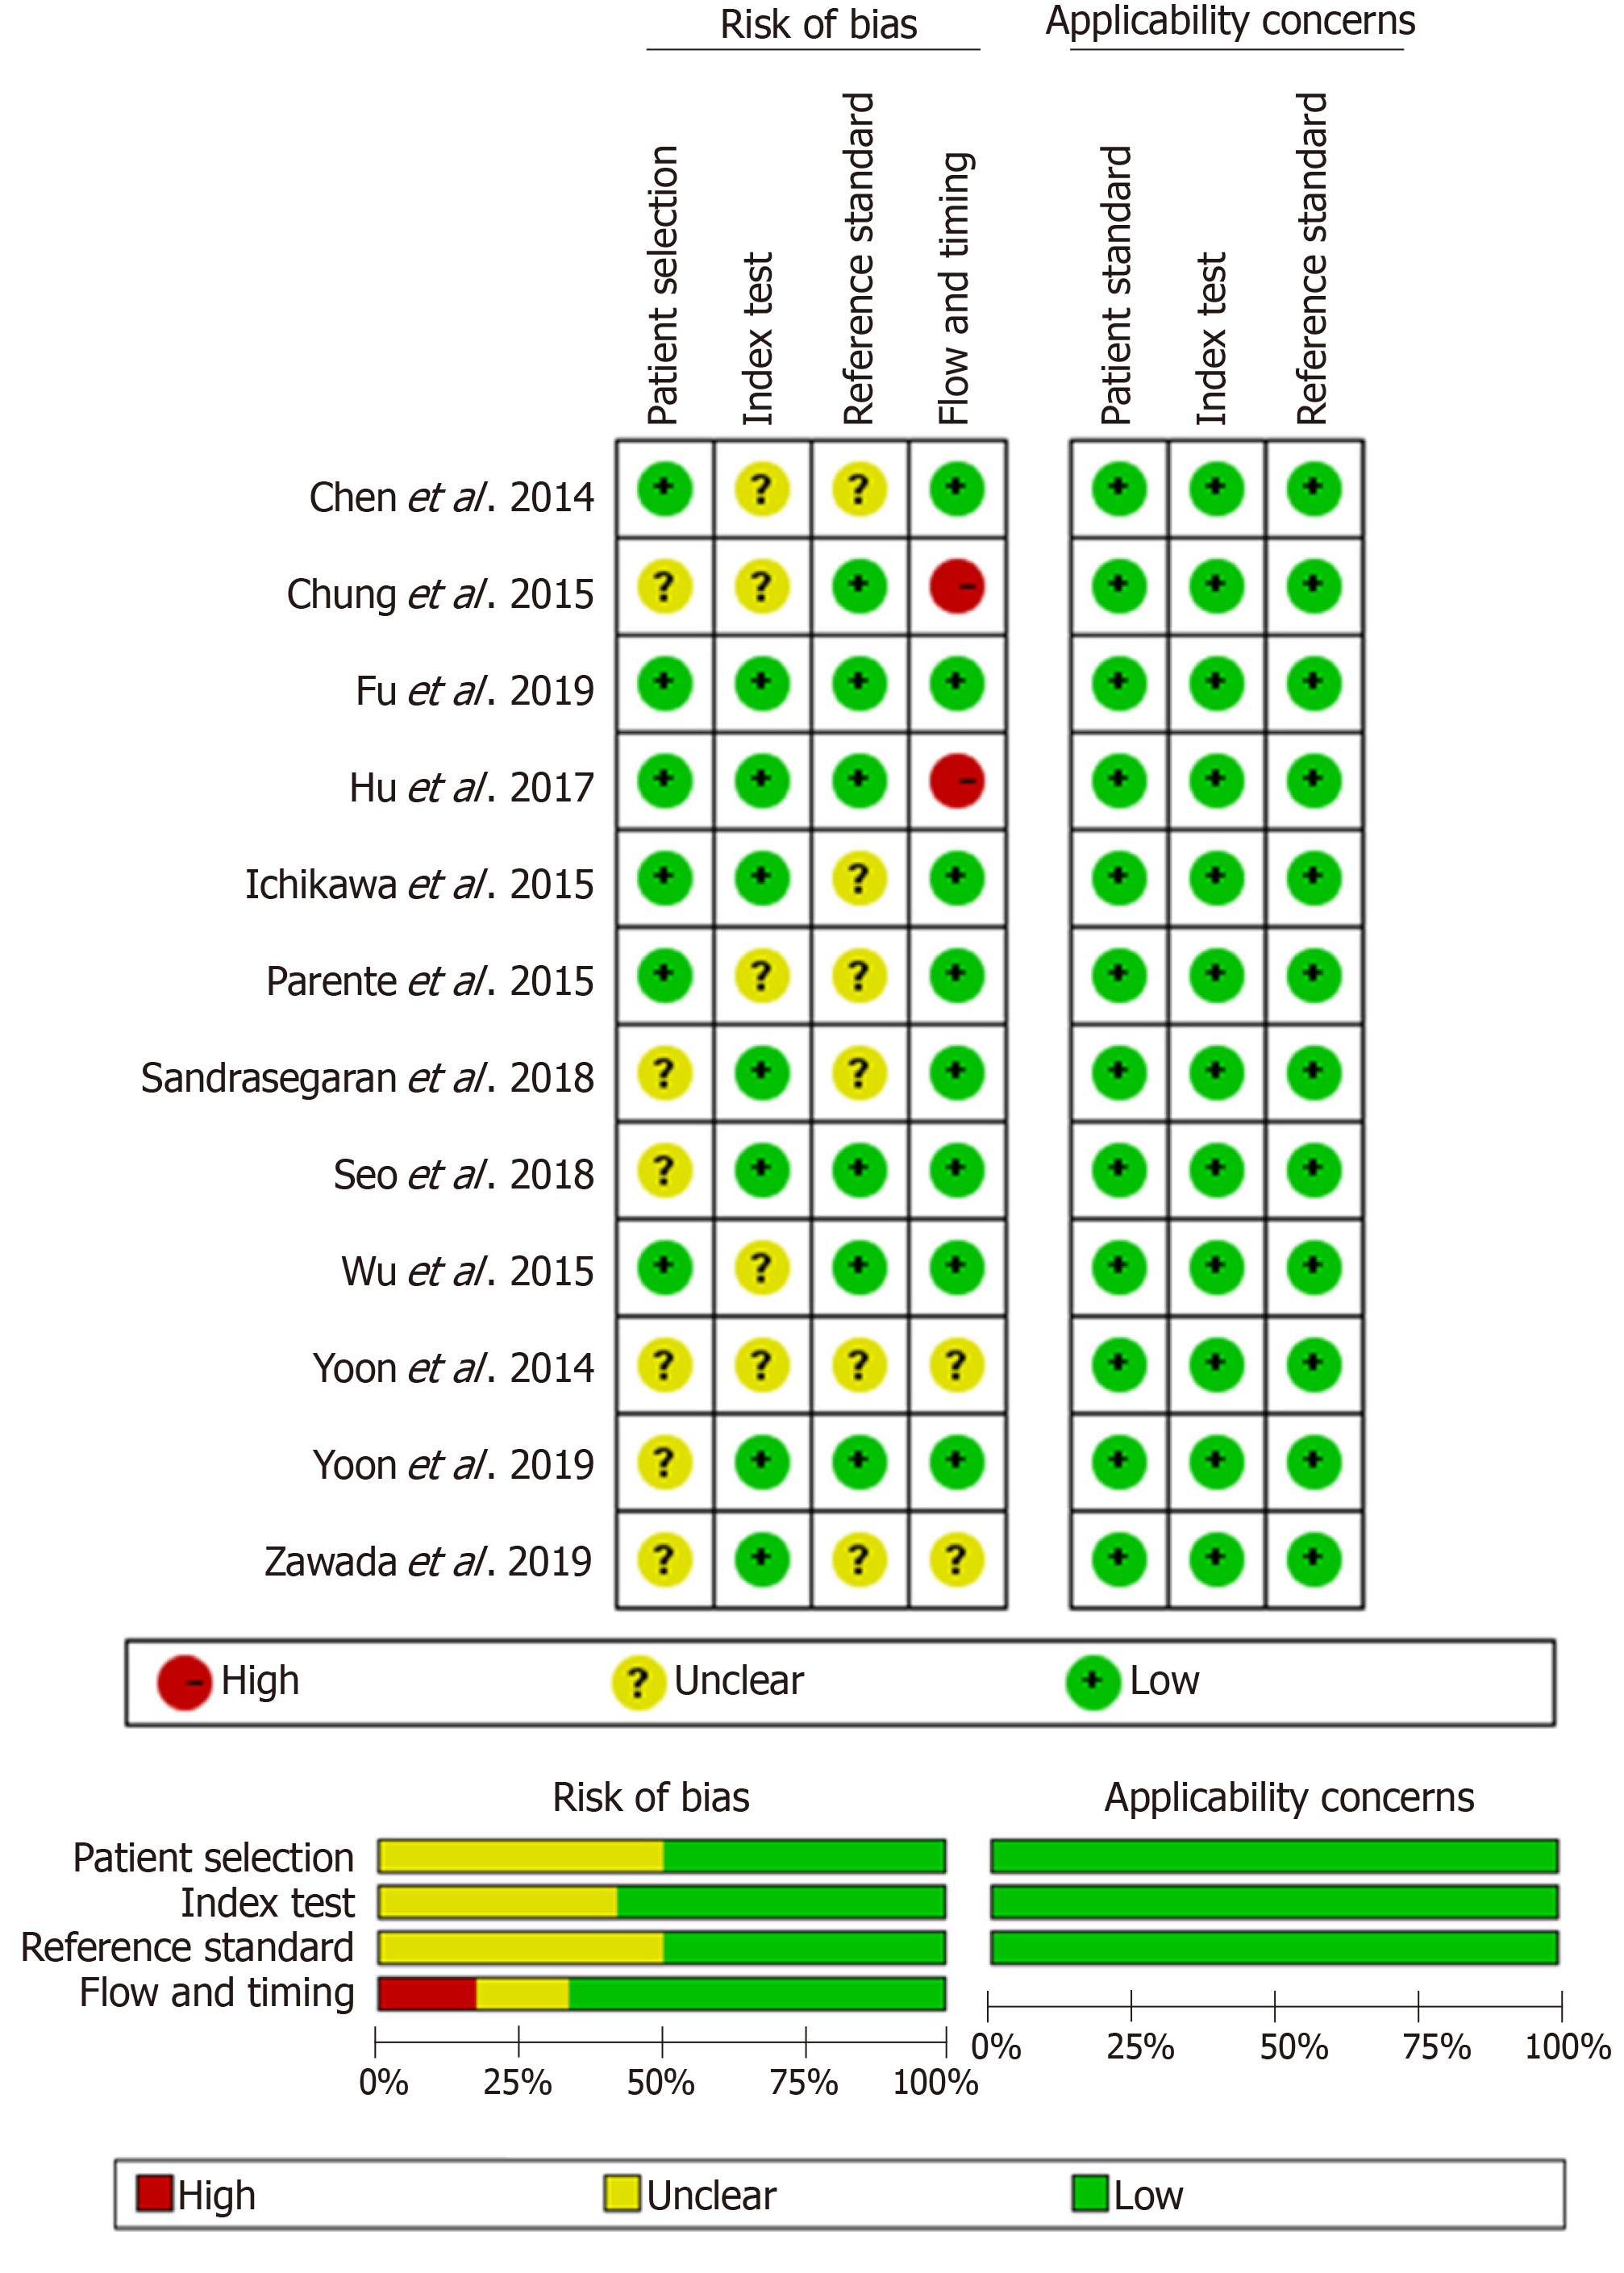
Figure 2 Quality assessment of included studies according to Quality Assessment of Diagnostic Accuracy Studies-2.
The results showed that the quality of the included studies was good.
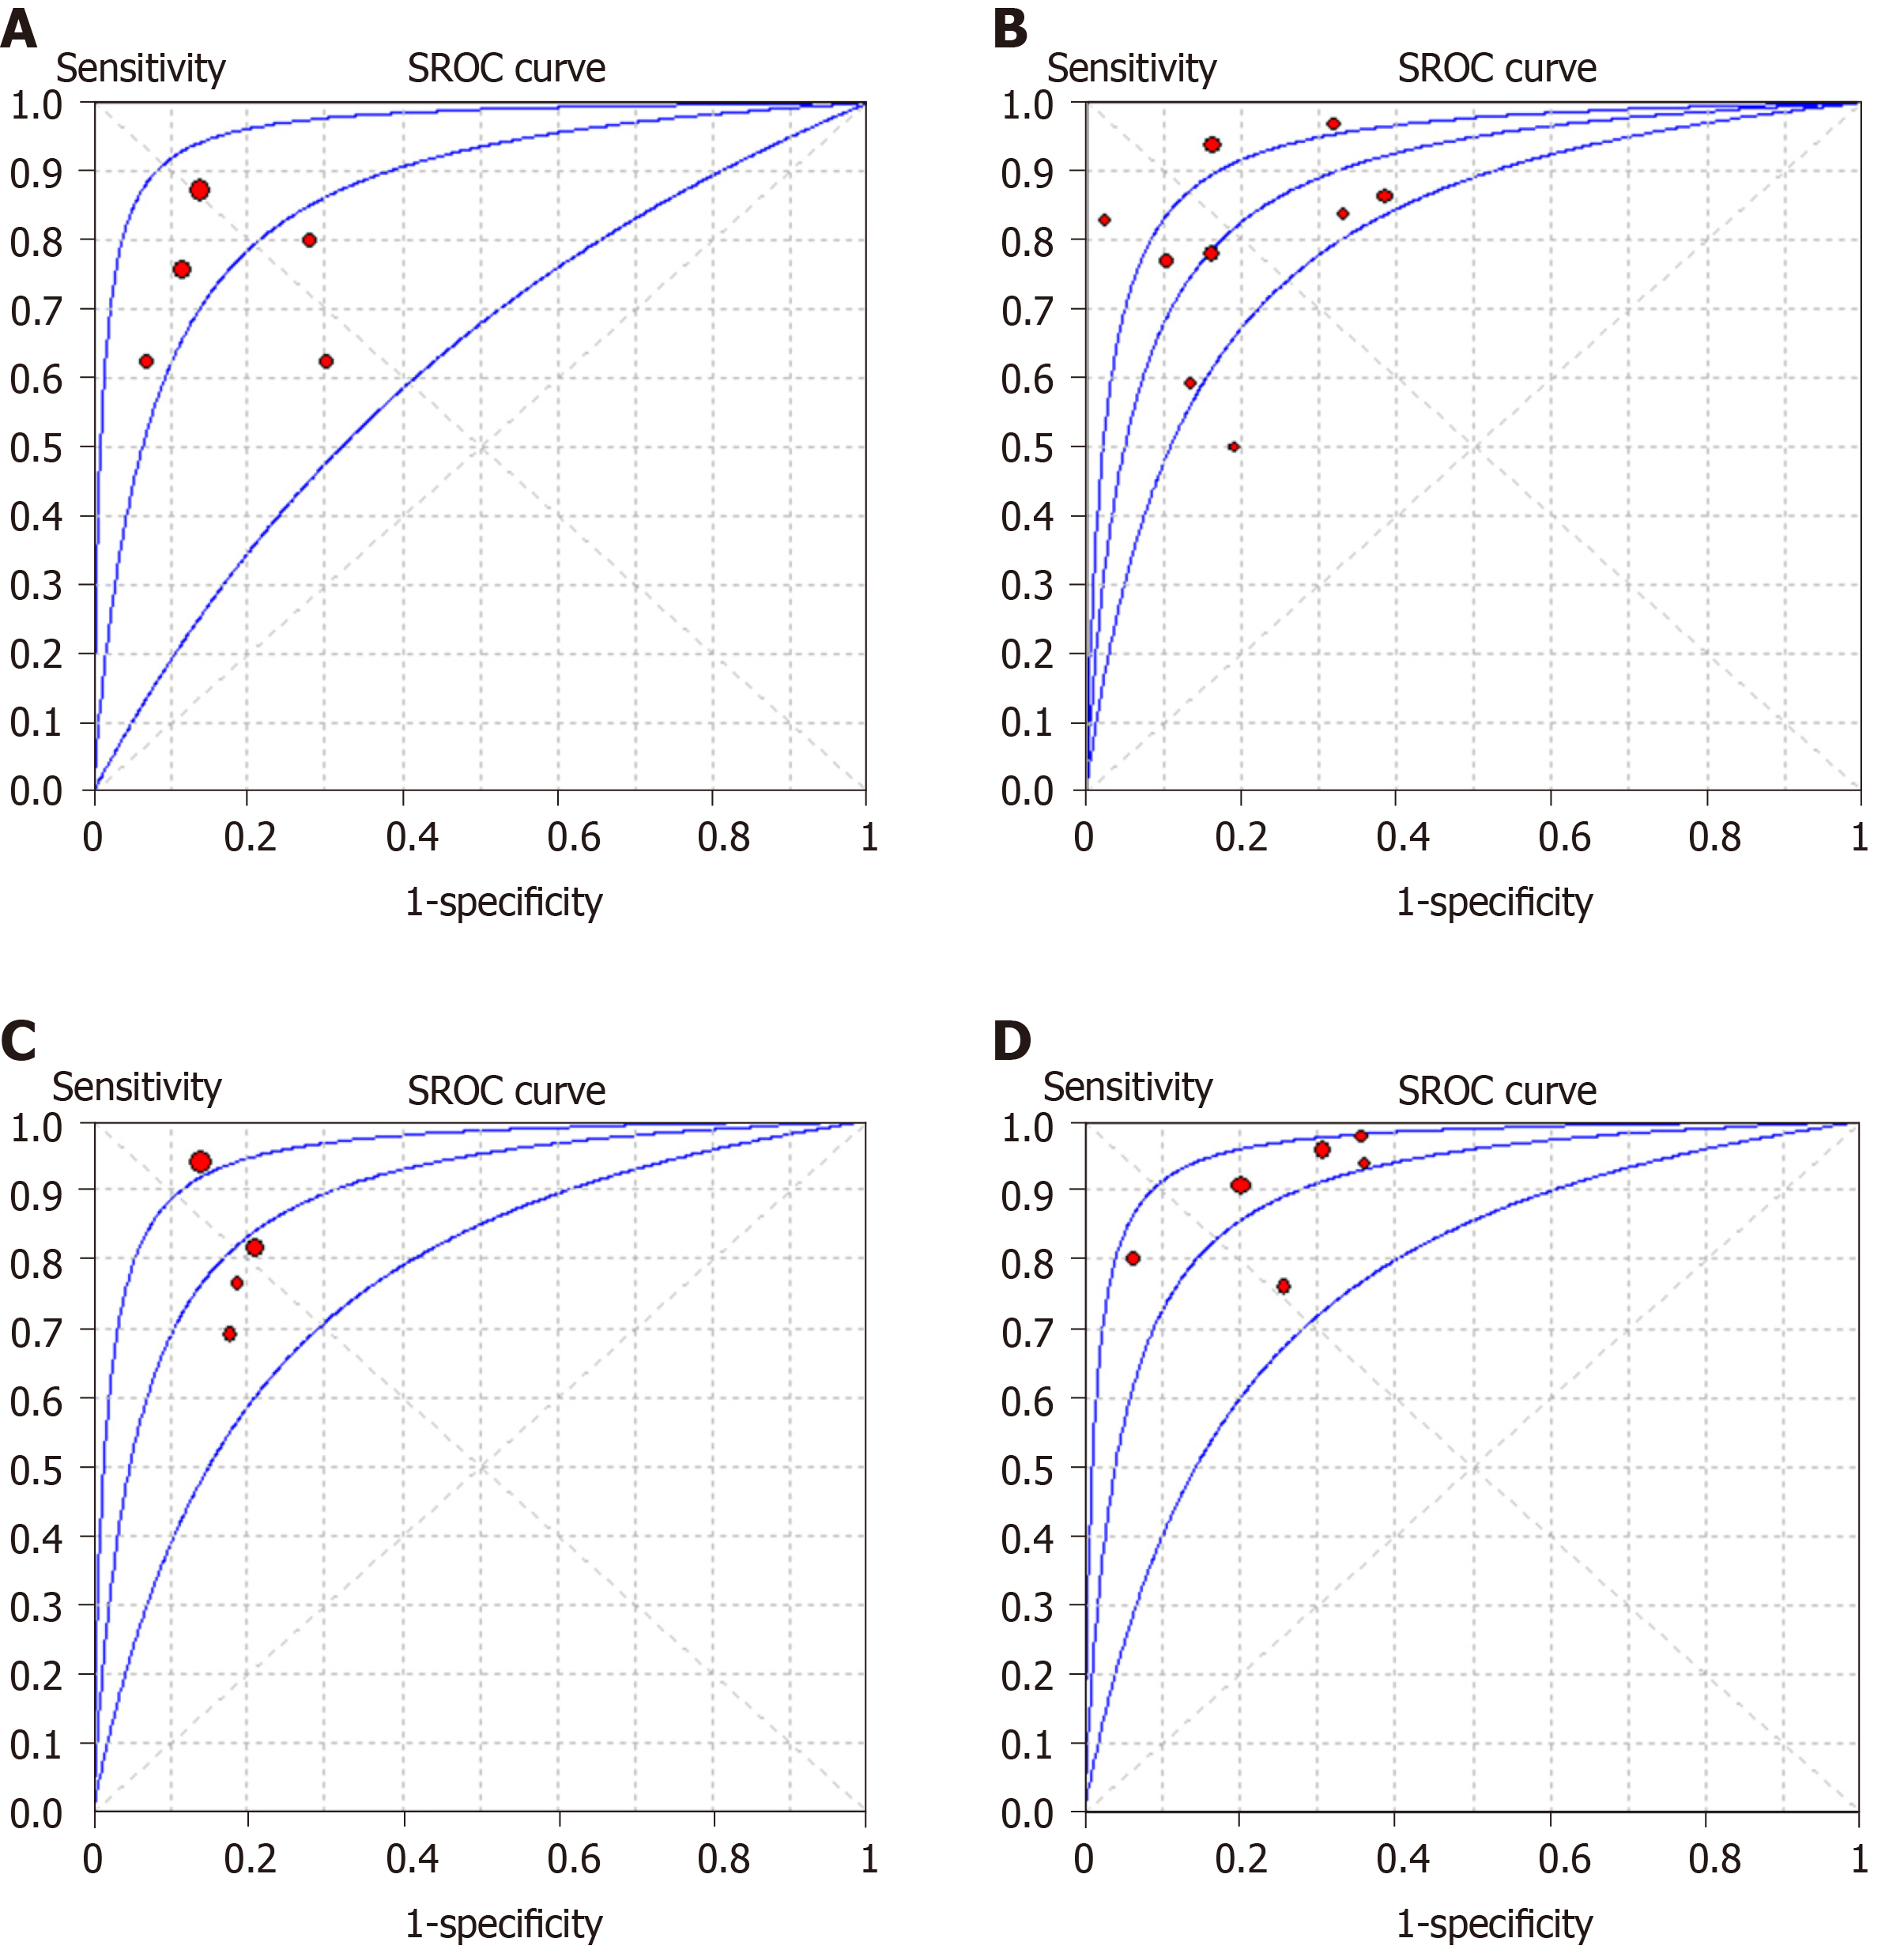
Figure 3 Summary receiver operating characteristic curves of intravoxel incoherent motion in detecting and staging liver fibrosis.
A and B: The area under the curves are 0.862 for liver fibrosis (LF) ≥ F1 (A), B: 0.883 (0.856-0.909) for LF ≥ F2 (B); C and D: 0.886 (0.865-0.907) for LF ≥ F3 (C) and 0.899 (0.866-0.932) for LF = F4 (D), respectively. SROC: Summary receiver operating characteristic.
- Citation: Ye Z, Wei Y, Chen J, Yao S, Song B. Value of intravoxel incoherent motion in detecting and staging liver fibrosis: A meta-analysis. World J Gastroenterol 2020; 26(23): 3304-3317
- URL: https://www.wjgnet.com/1007-9327/full/v26/i23/3304.htm
- DOI: https://dx.doi.org/10.3748/wjg.v26.i23.3304


