Copyright
©The Author(s) 2020.
World J Gastroenterol. May 21, 2020; 26(19): 2374-2387
Published online May 21, 2020. doi: 10.3748/wjg.v26.i19.2374
Published online May 21, 2020. doi: 10.3748/wjg.v26.i19.2374
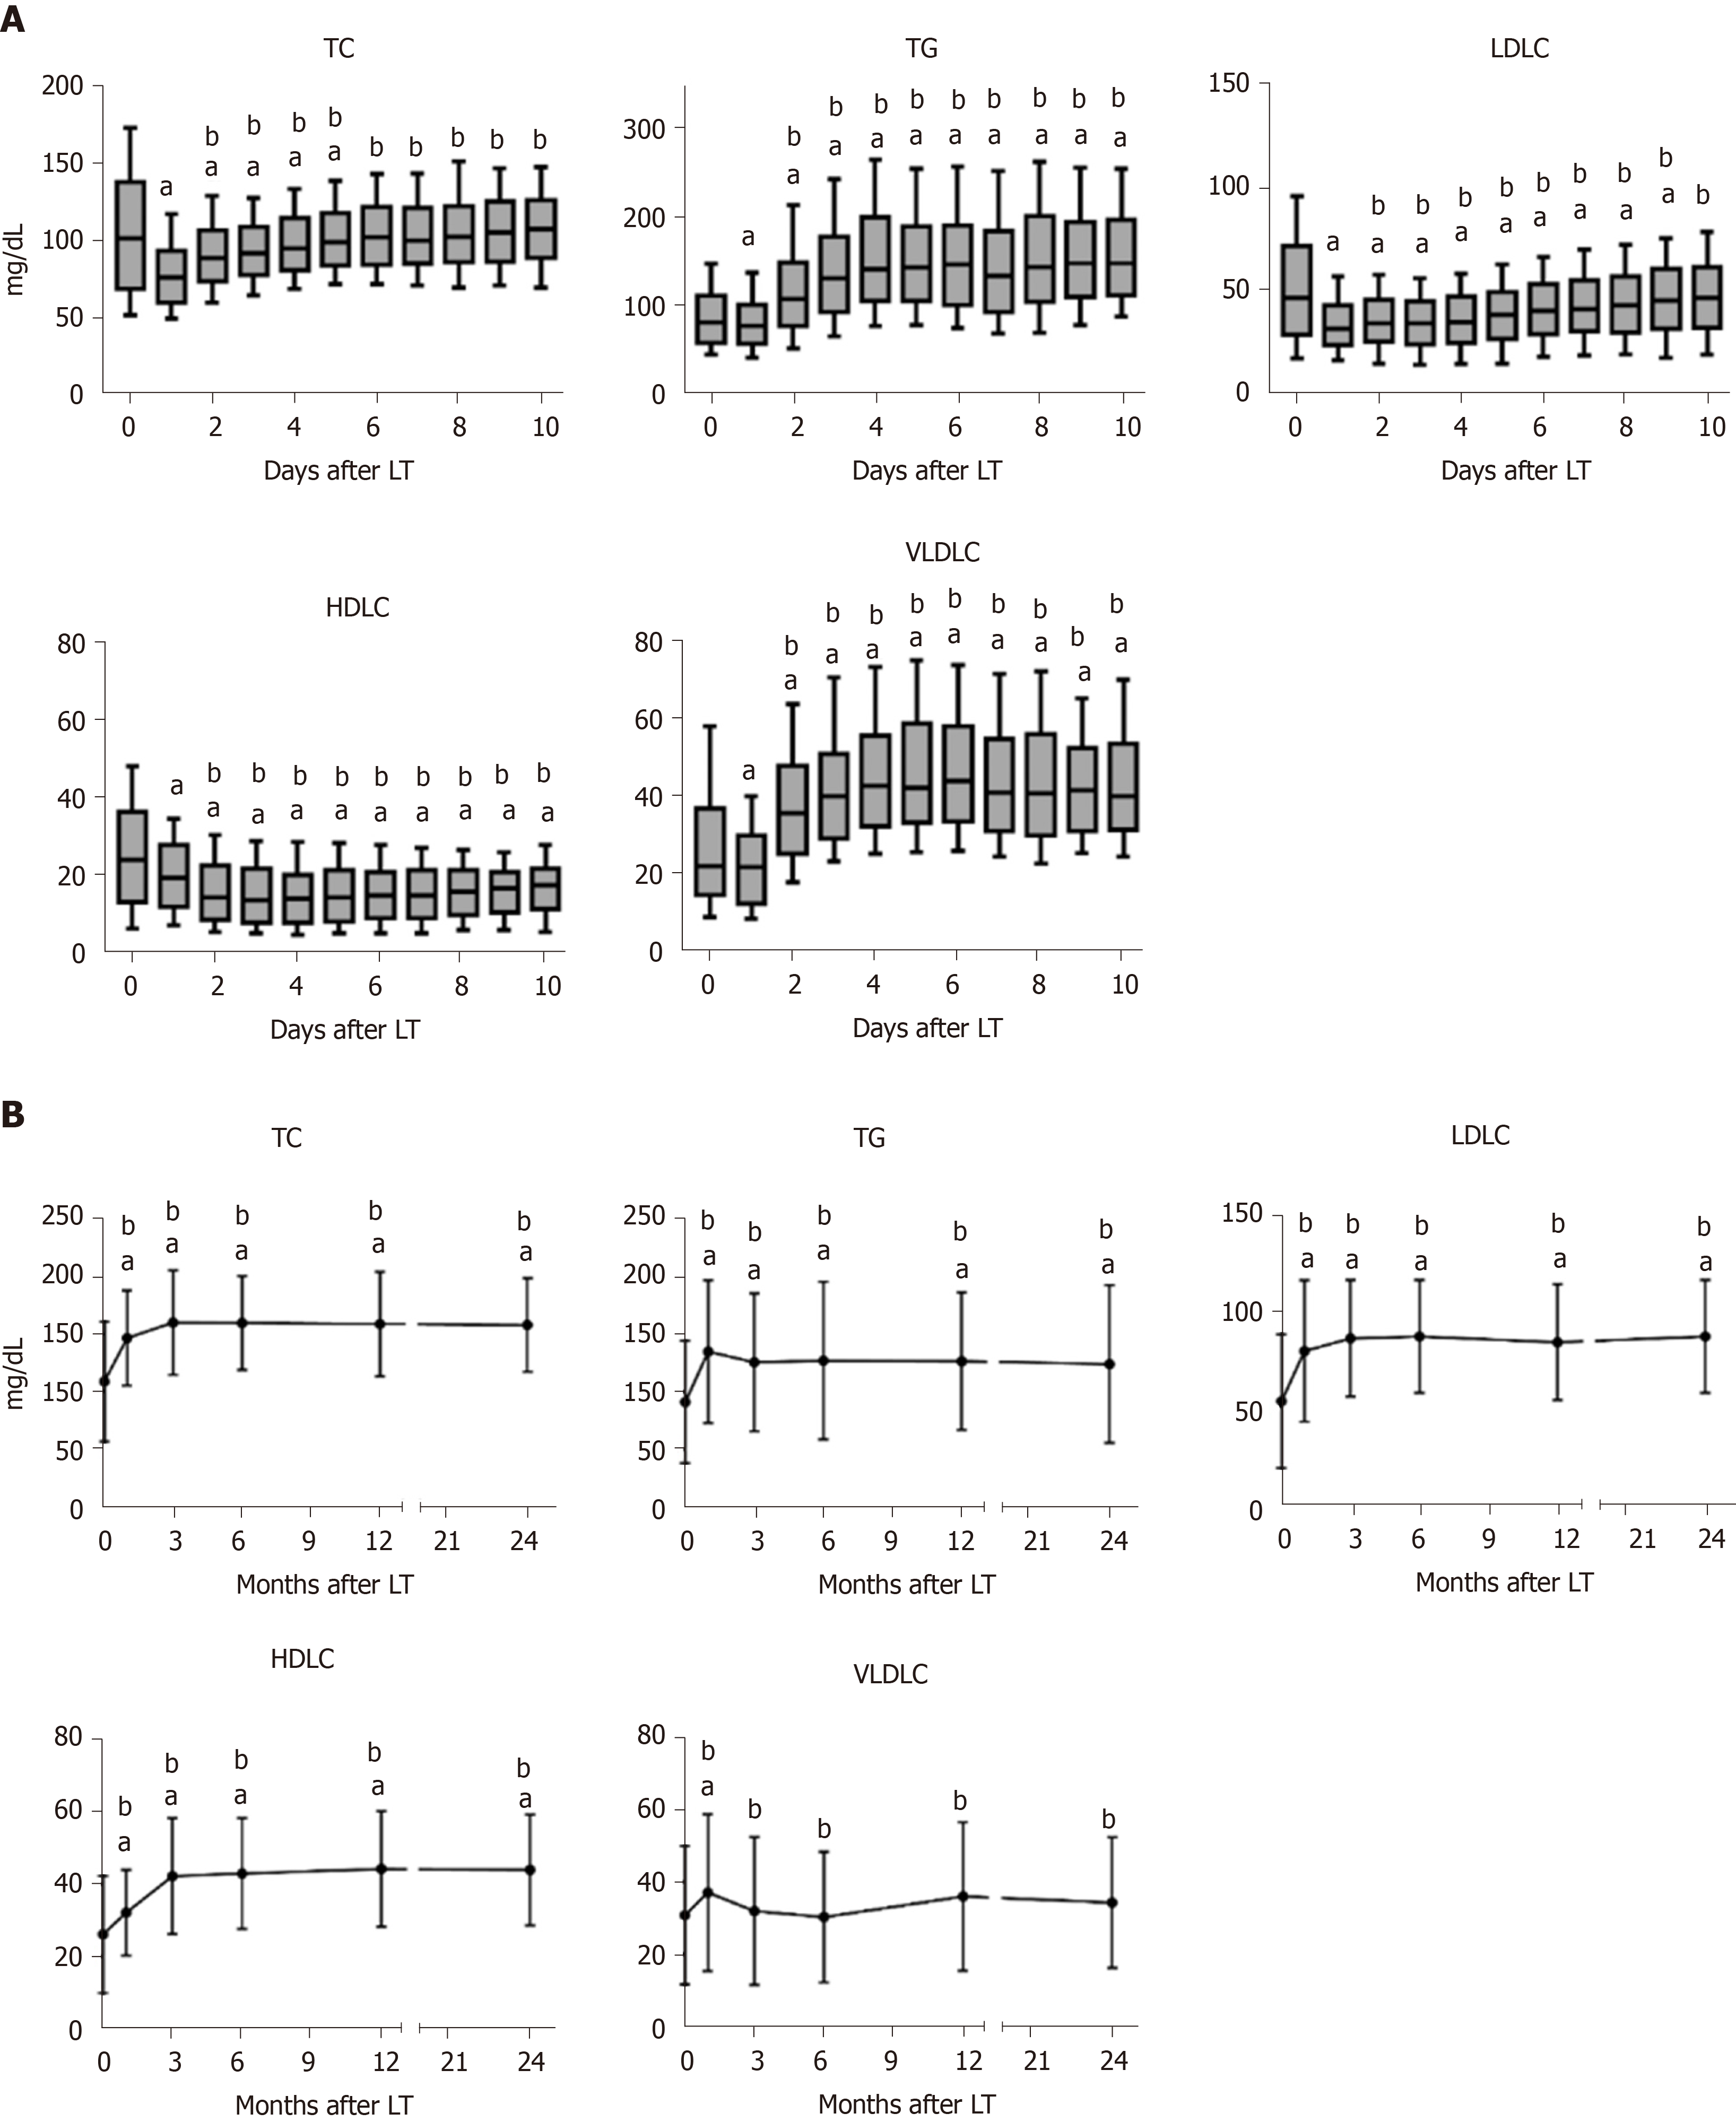
Figure 1 Dynamic process of lipid profile after liver transplantation.
A: Dynamic changes of total cholesterol, triglyceride, high-density lipoprotein cholesterol, low-density lipoprotein cholesterol, and very low-density lipoprotein cholesterol during 10 d after liver transplantation; B: Dynamic changes of total cholesterol, triglyceride, high-density lipoprotein cholesterol, low-density lipoprotein cholesterol, and very low-density lipoprotein cholesterol during 24 mo after liver transplantation. Data are expressed as the mean ± SD or median (10-90 percentiles). aP < 0.05 vs pre-transplant; bP < 0.05 vs day 1. TC: Total cholesterol; TG: Triglyceride; HDLC: High-density lipoprotein cholesterol; LDLC: Low-density lipoprotein cholesterol; VLDLC: Very low-density lipoprotein cholesterol; LT: Liver transplantation.
Figure 2 Impact of post-transplant dyslipidemia on survival.
A: Comparison of overall survival between post-transplant dyslipidemia and non-post-transplant dyslipidemia groups in all patients; B: Comparison of overall survival between post-transplant dyslipidemia and non-post-transplant dyslipidemia groups in hepatocellular carcinoma patients; C: Comparison of tumor-free survival between post-transplant dyslipidemia and non-post-transplant dyslipidemia groups in hepatocellular carcinoma patients. PTDL: Post-transplant dyslipidemia; LT: Liver transplantation; HCC: Hepatocellular carcinoma.
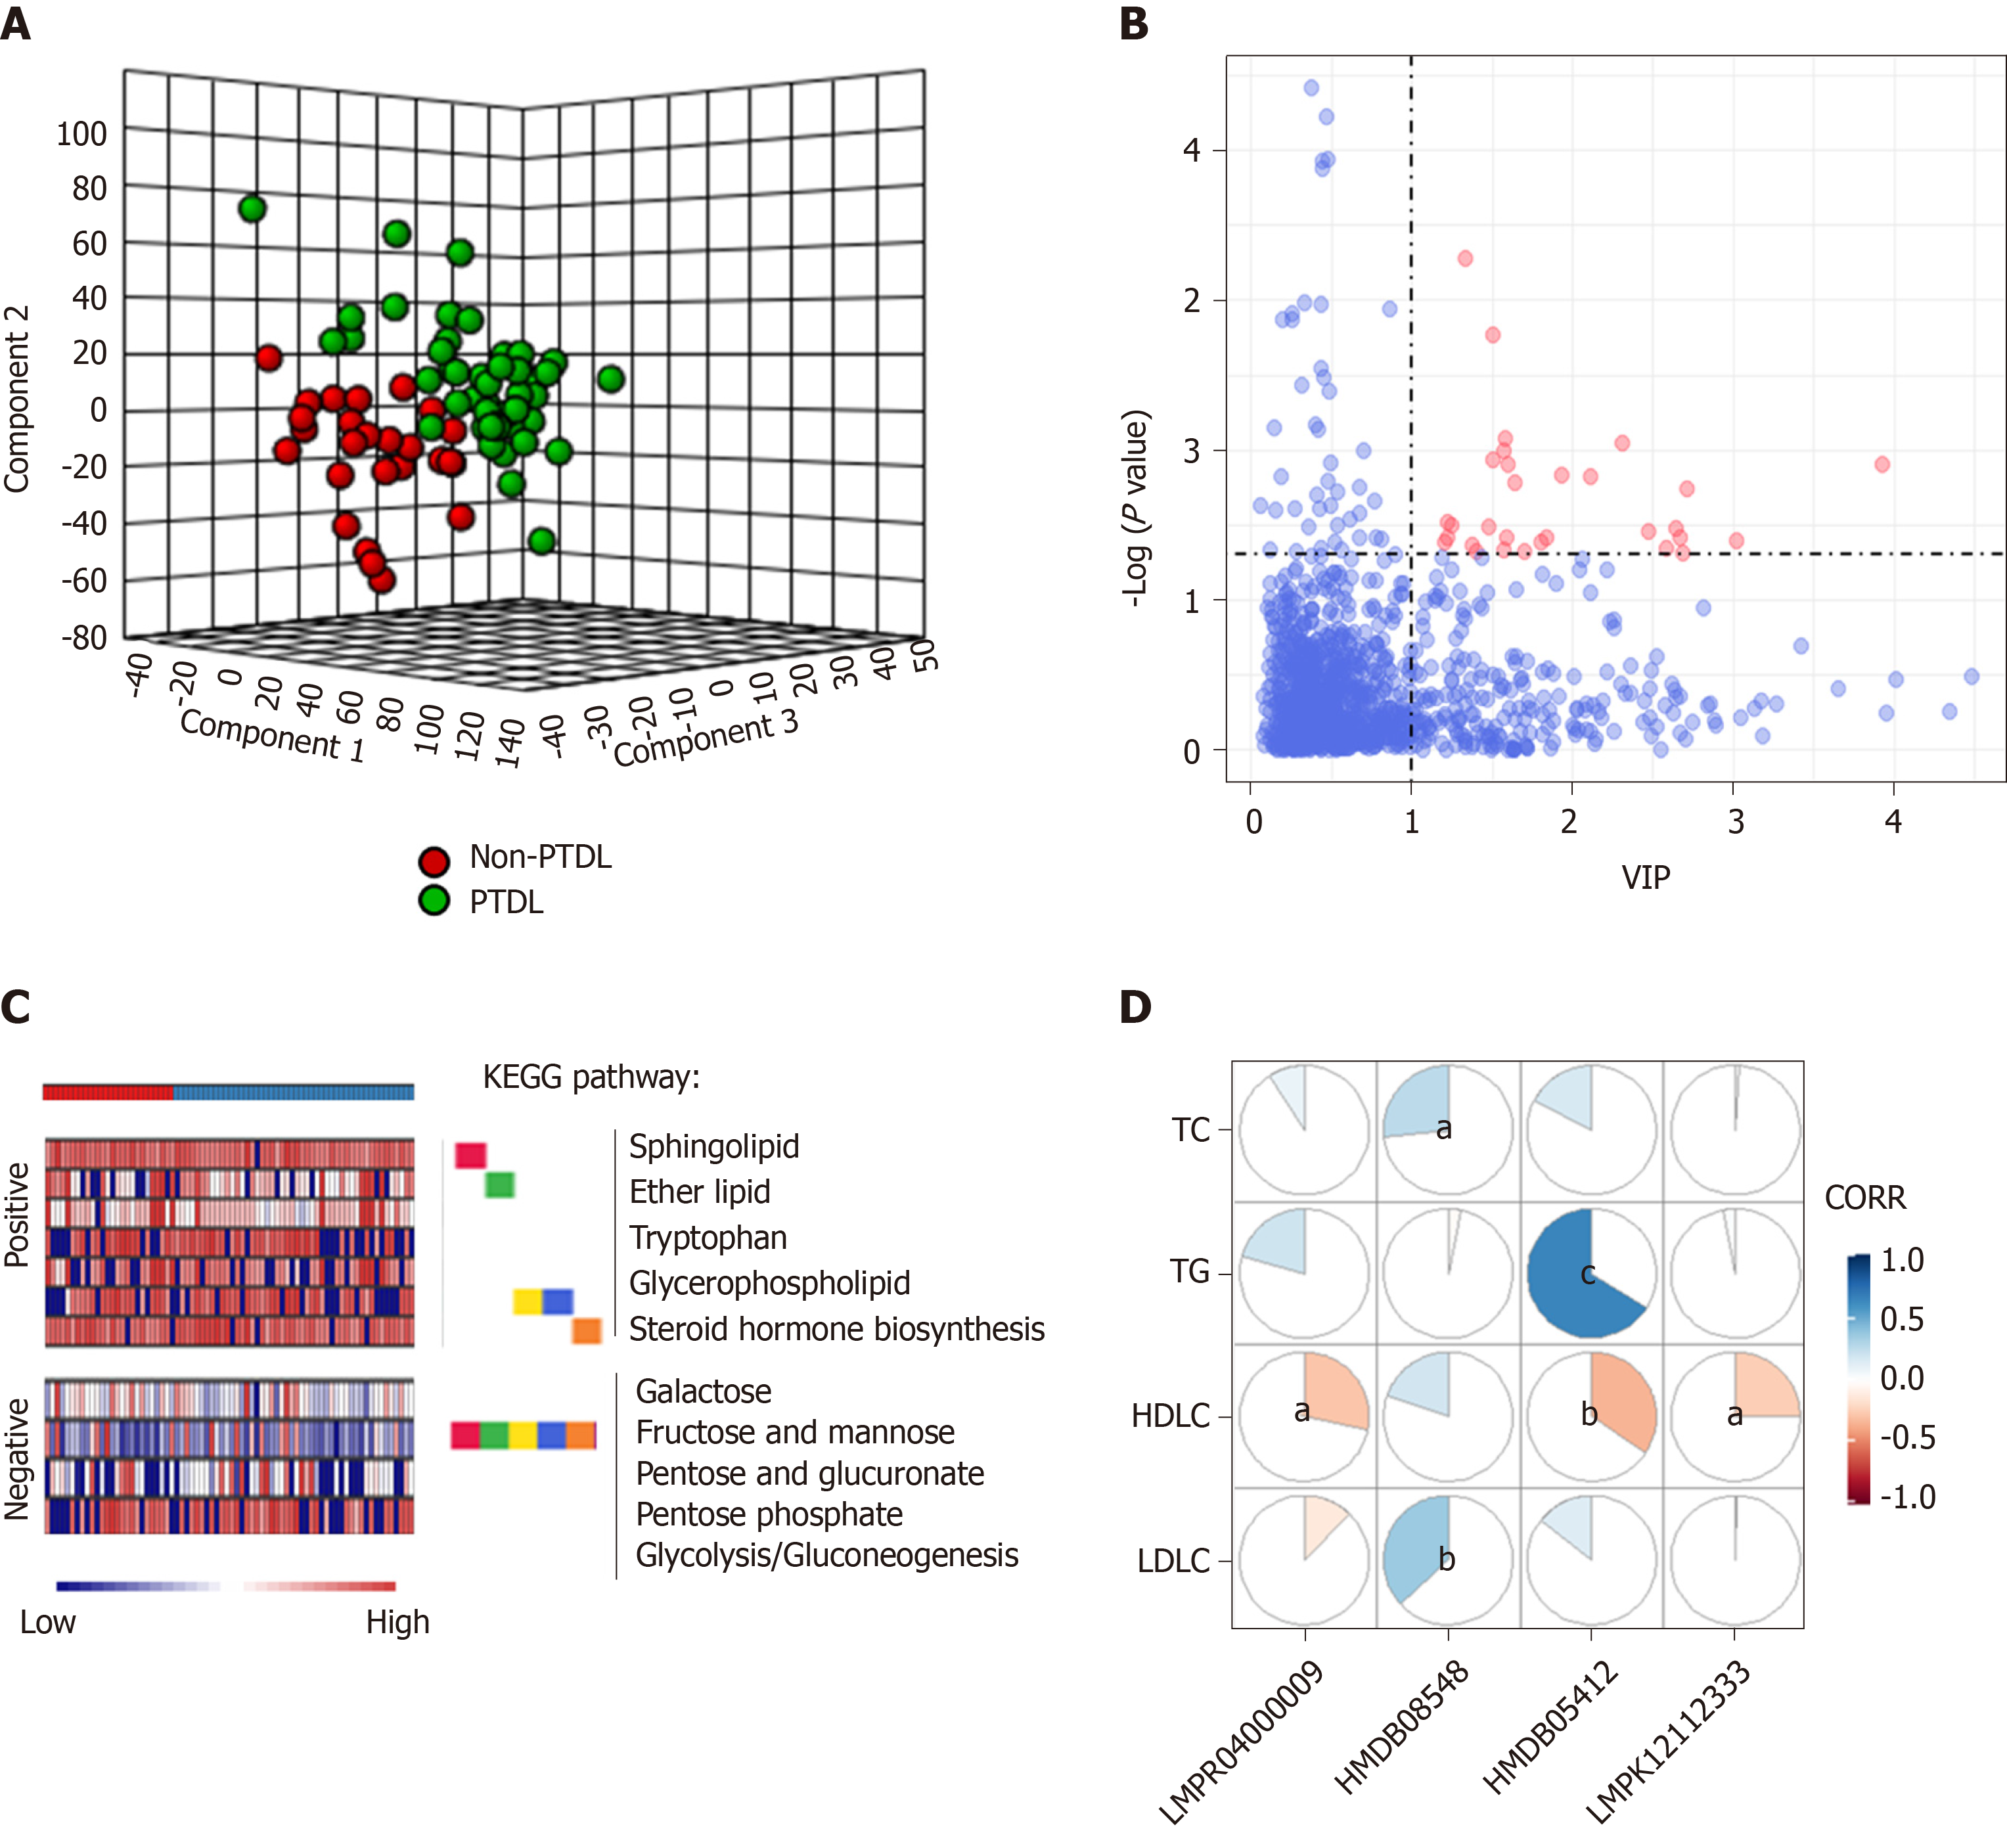
Figure 3 Metabolomic profiles of post-transplant dyslipidemia and non-post-transplant dyslipidemia groups.
A: 3-D scores plot between selected components in partial least squares-discriminant analysis; B: Thirty differentially expressed metabolites (scatter plot; variable importance in the projection > 1, P < 0.05) were annotated with red color; C: Concentrated display of the abundant differential features (positive and negative ion modes on the top and bottom, respectively) between non-post-transplant dyslipidemia and post-transplant dyslipidemia groups using Mummichog 2.0; D: Correlation between metabolites and lipid profile in recipients. aP < 0.05; bP < 0.01; cP < 0.001. PTDL: Post-transplant dyslipidemia; VIP: Variable Importance in the Projection; TC: Total cholesterol; TG: Triglycerides; HDLC: High-density lipoprotein cholesterol; LDLC: Low-density lipoprotein cholesterol; CORR: Correlation.
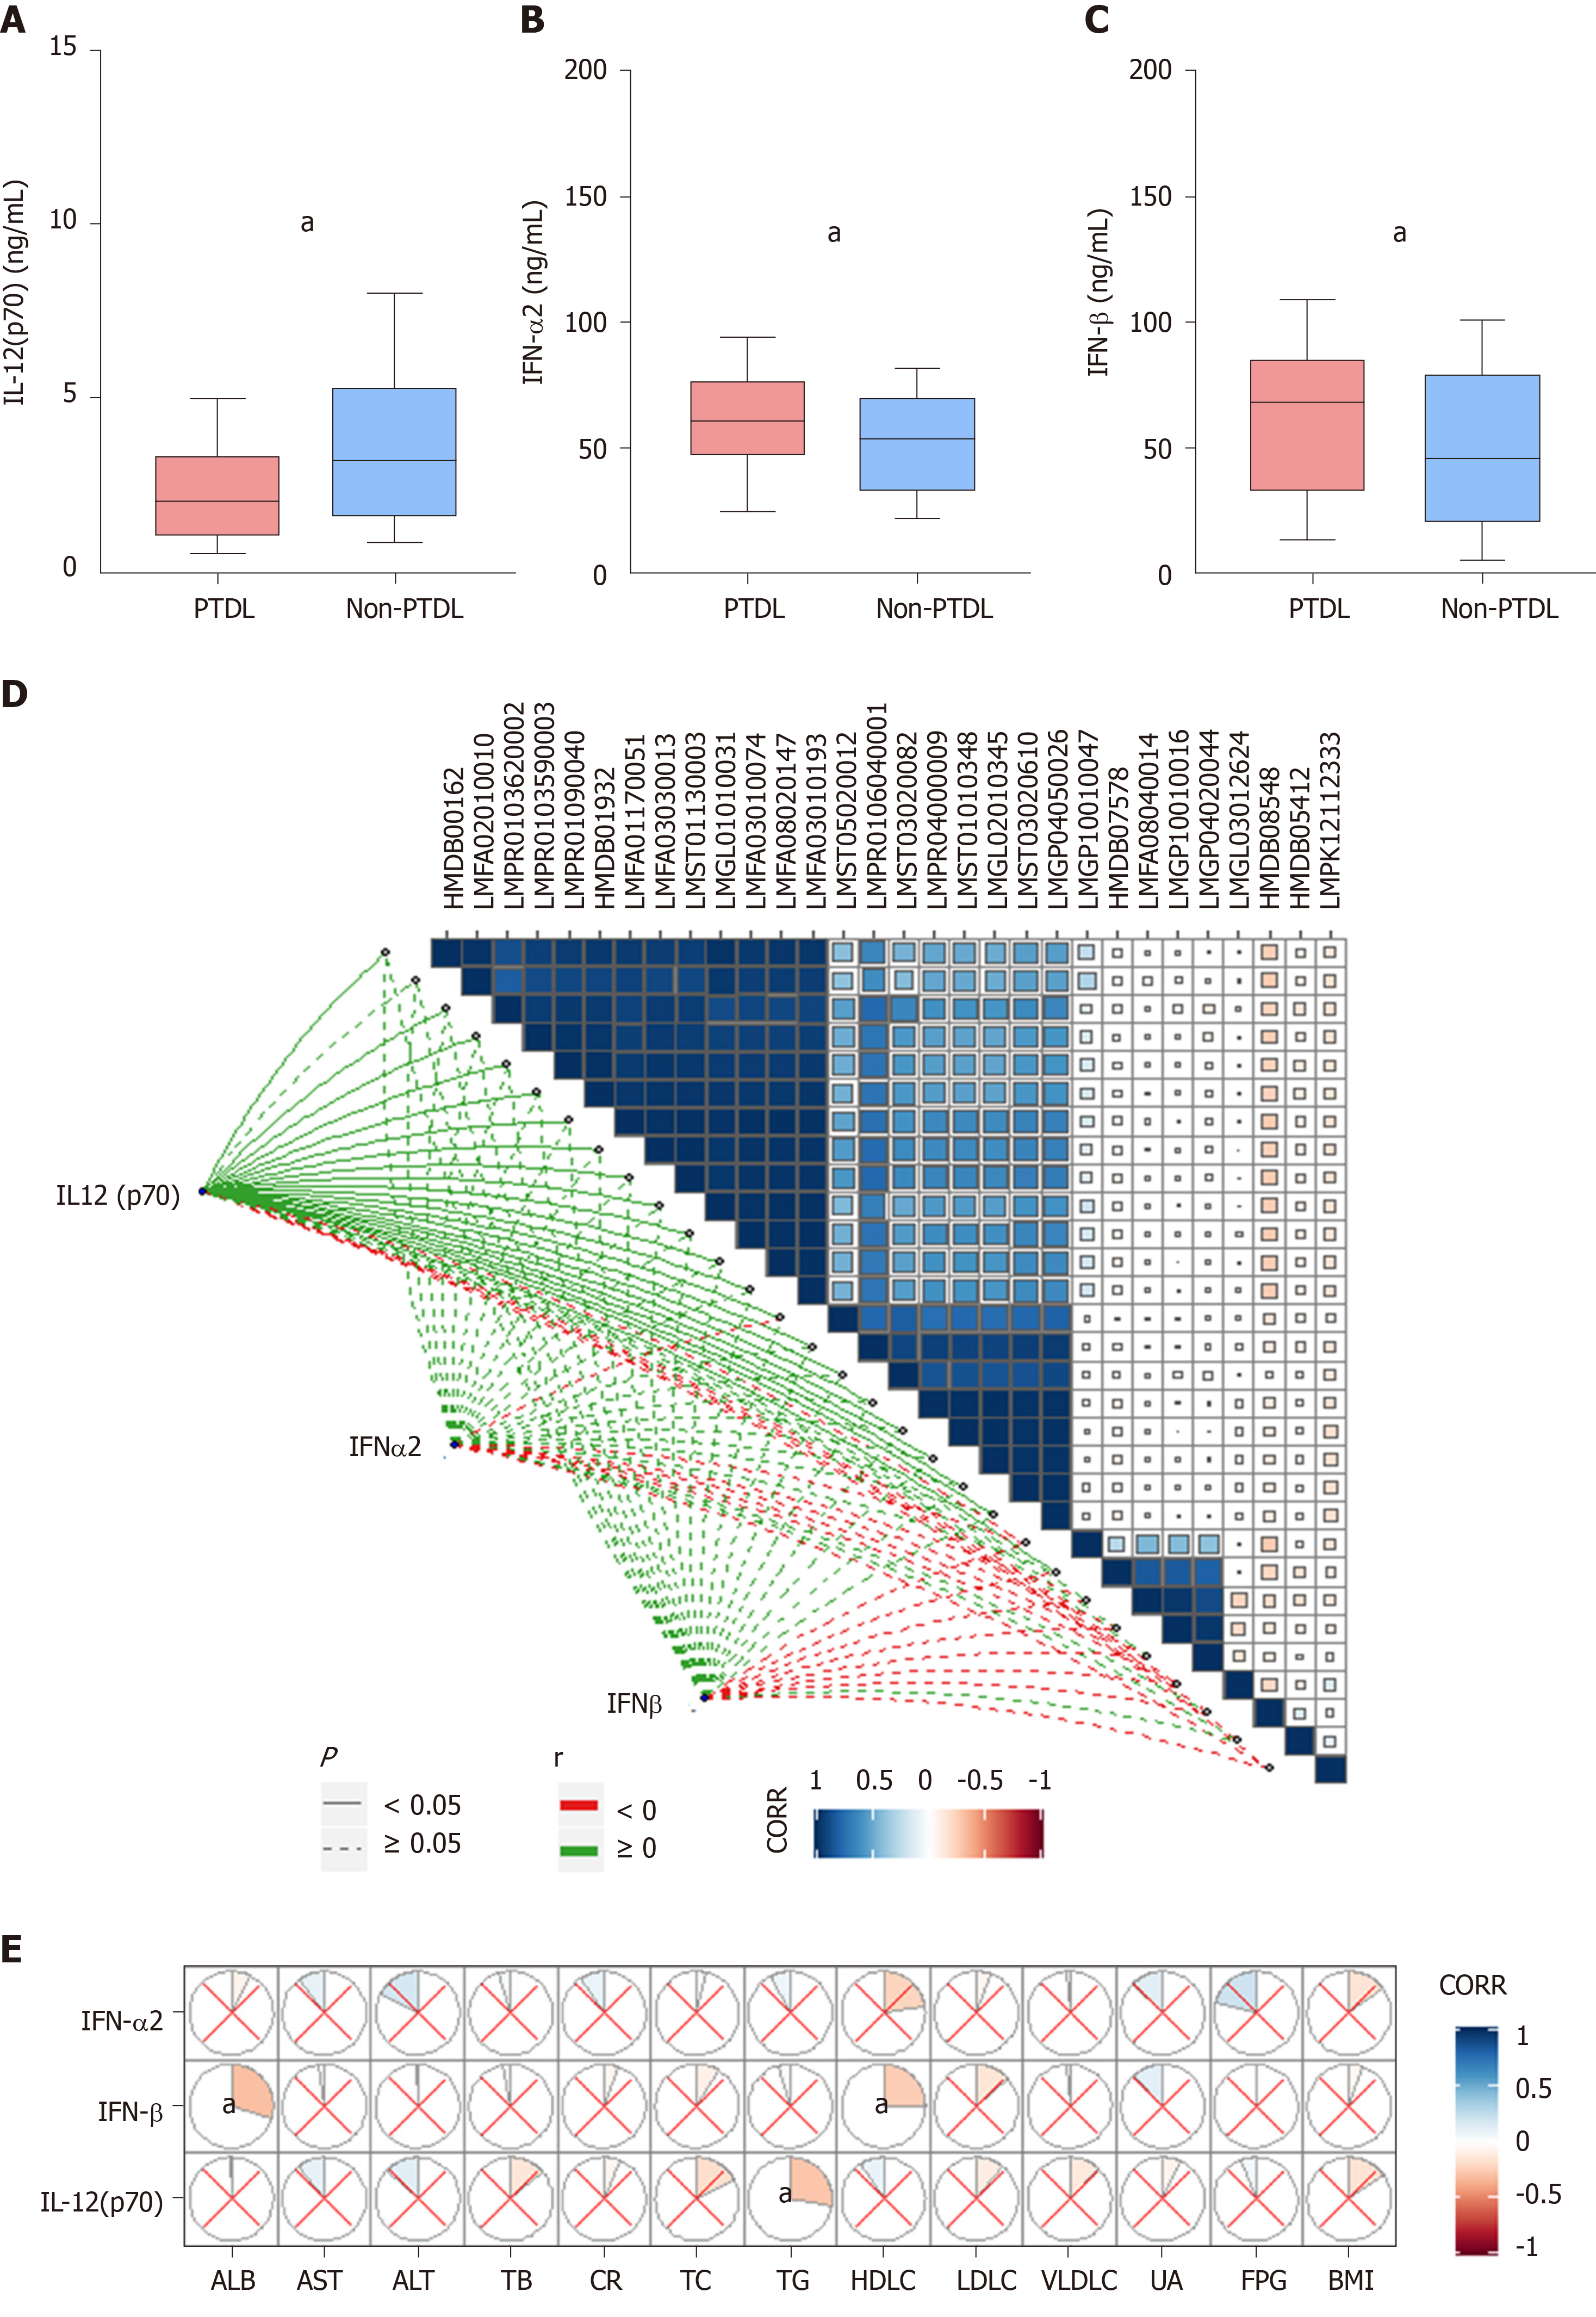
Figure 4 Peripheral cytokine profile of post-transplant dyslipidemia and non-post-transplant dyslipidemia groups.
A-C: The interleukin (IL)-12 (p70), IFN-α2, and IFN-β levels were significantly differentially expressed between post-transplant dyslipidemia group and non-post-transplant dyslipidemia group; D: Correlations between differential cytokines and metabolic profiles; E: Correlation between differential cytokines and recipients’ pre-transplant clinical metabolic parameters. aP < 0.05. PTDL: Post-transplant dyslipidemia; ALB: Albumin; AST: Aspartate aminotransferase; ALT: Alanine aminotransferase; TB: Total bilirubin; CR: Creatinine; TC: Total cholesterol; TG: Triglyceride; HDLC: High-density lipoprotein cholesterol; LDLC: Low density lipoprotein cholesterol; VLDLC: Very low-density lipoprotein cholesterol; UA: Uric acid; FBG: Fasting blood glucose; BMI: Body mass index; CORR: Correlation.
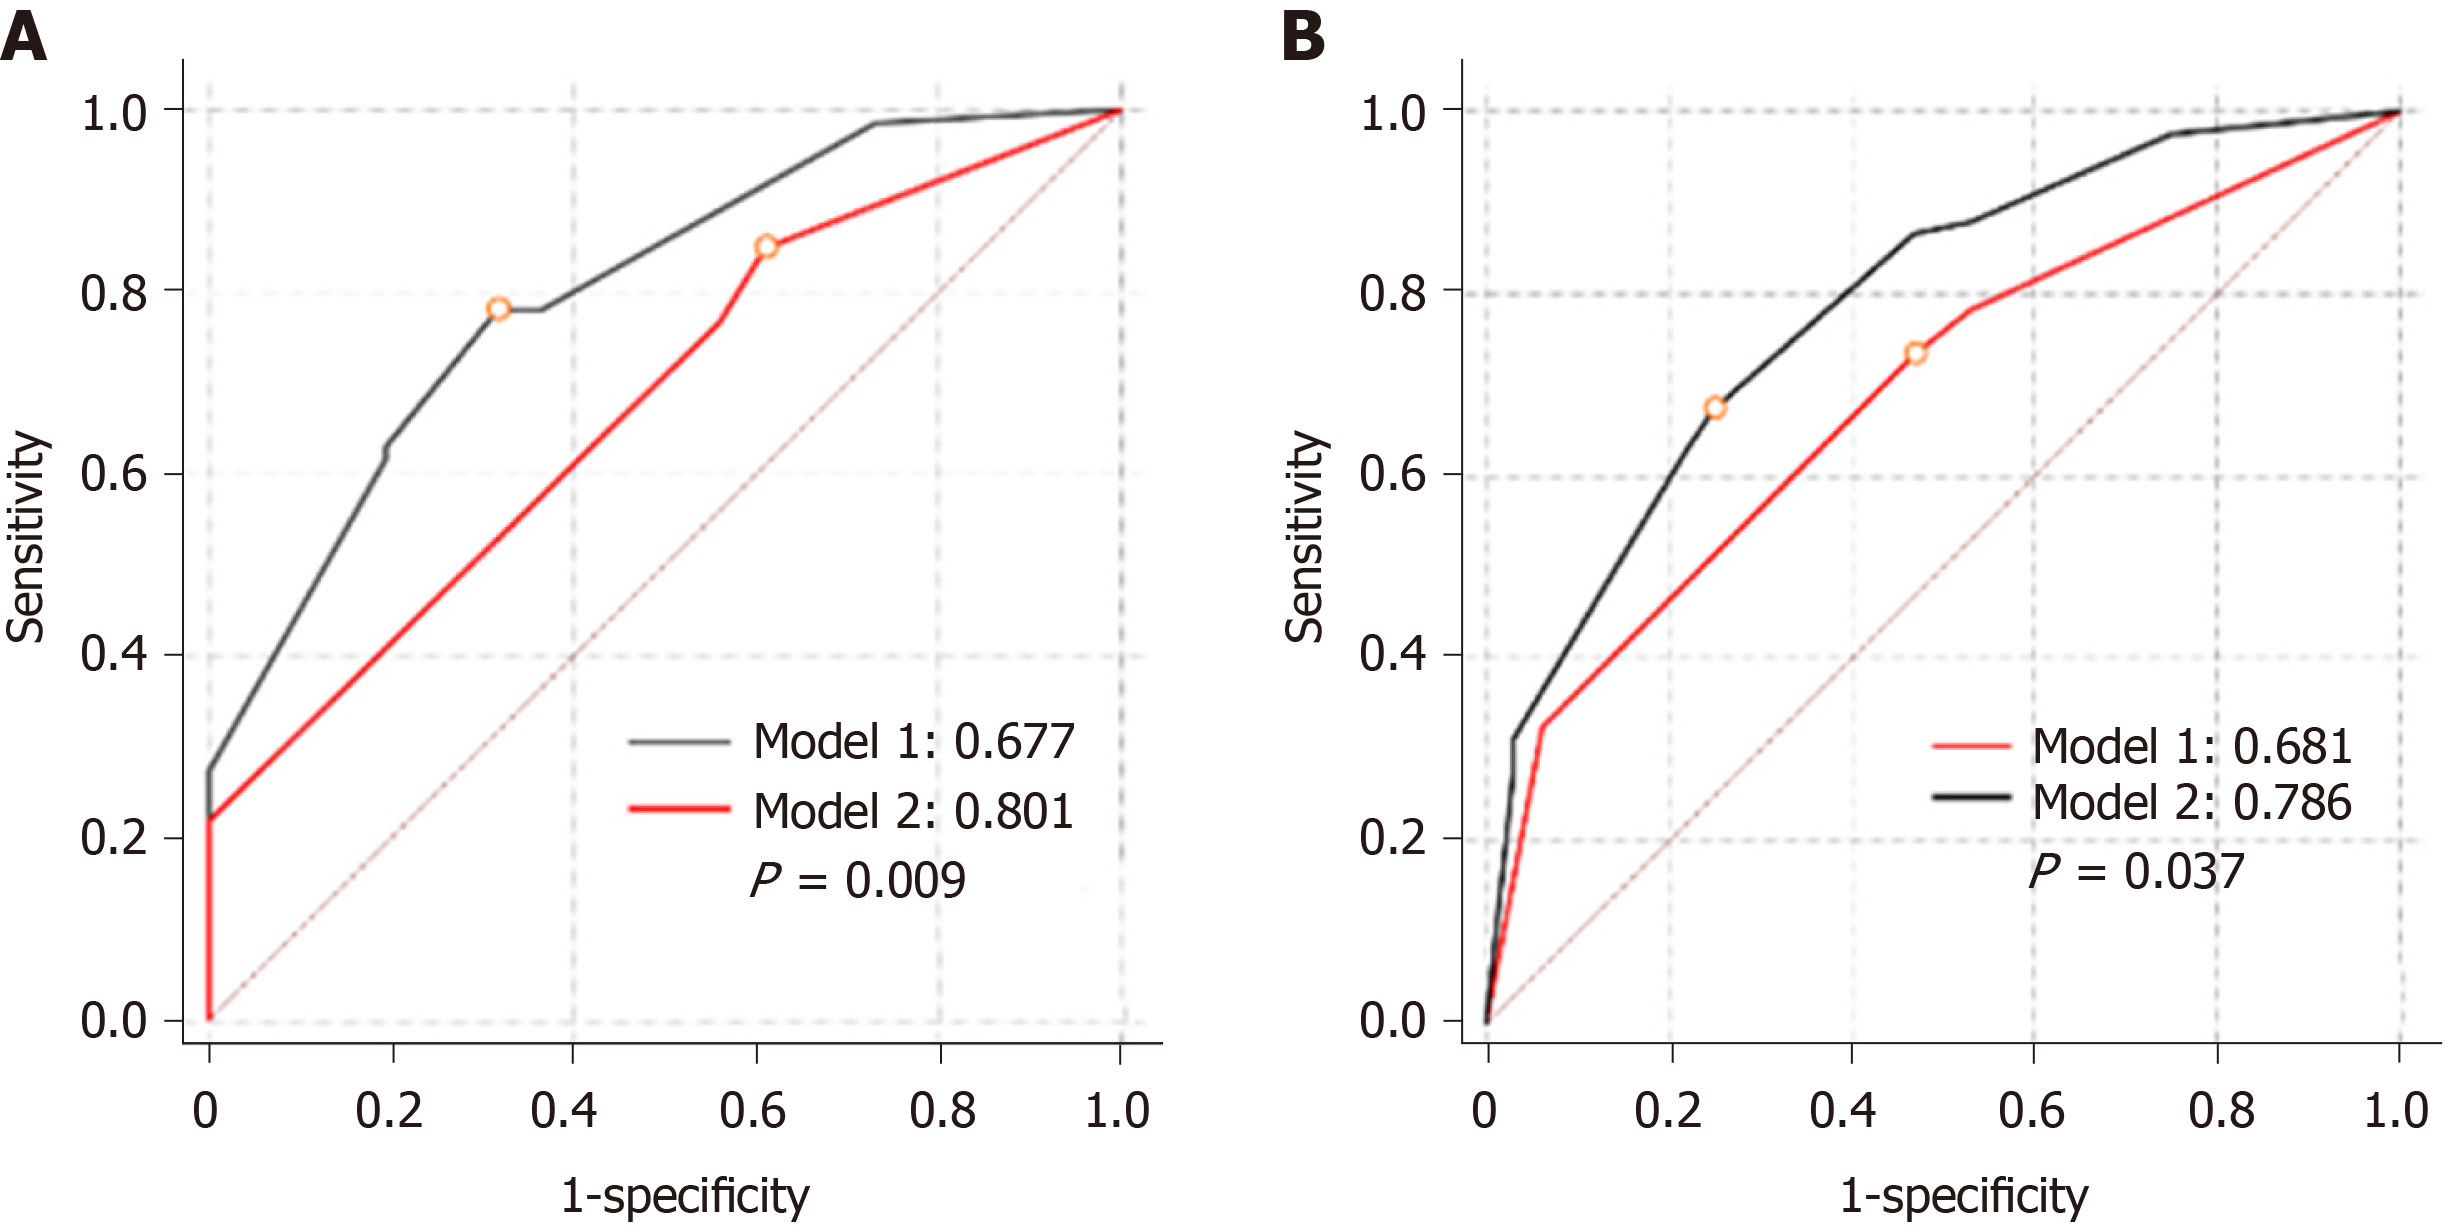
Figure 5 Comparison of predictive ability between clinical model (model 1) and integrated model (model 2).
A: Areas under the receiver operating characteristic curves of model 1 and model 2 in training set (n = 72); B: Areas under the receiver operating characteristic curves of model 1 and model 2 in validation set (n = 144).
- Citation: Huang HT, Zhang XY, Zhang C, Ling Q, Zheng SS. Predicting dyslipidemia after liver transplantation: A significant role of recipient metabolic inflammation profile. World J Gastroenterol 2020; 26(19): 2374-2387
- URL: https://www.wjgnet.com/1007-9327/full/v26/i19/2374.htm
- DOI: https://dx.doi.org/10.3748/wjg.v26.i19.2374


