Copyright
©The Author(s) 2020.
World J Gastroenterol. Mar 21, 2020; 26(11): 1208-1220
Published online Mar 21, 2020. doi: 10.3748/wjg.v26.i11.1208
Published online Mar 21, 2020. doi: 10.3748/wjg.v26.i11.1208
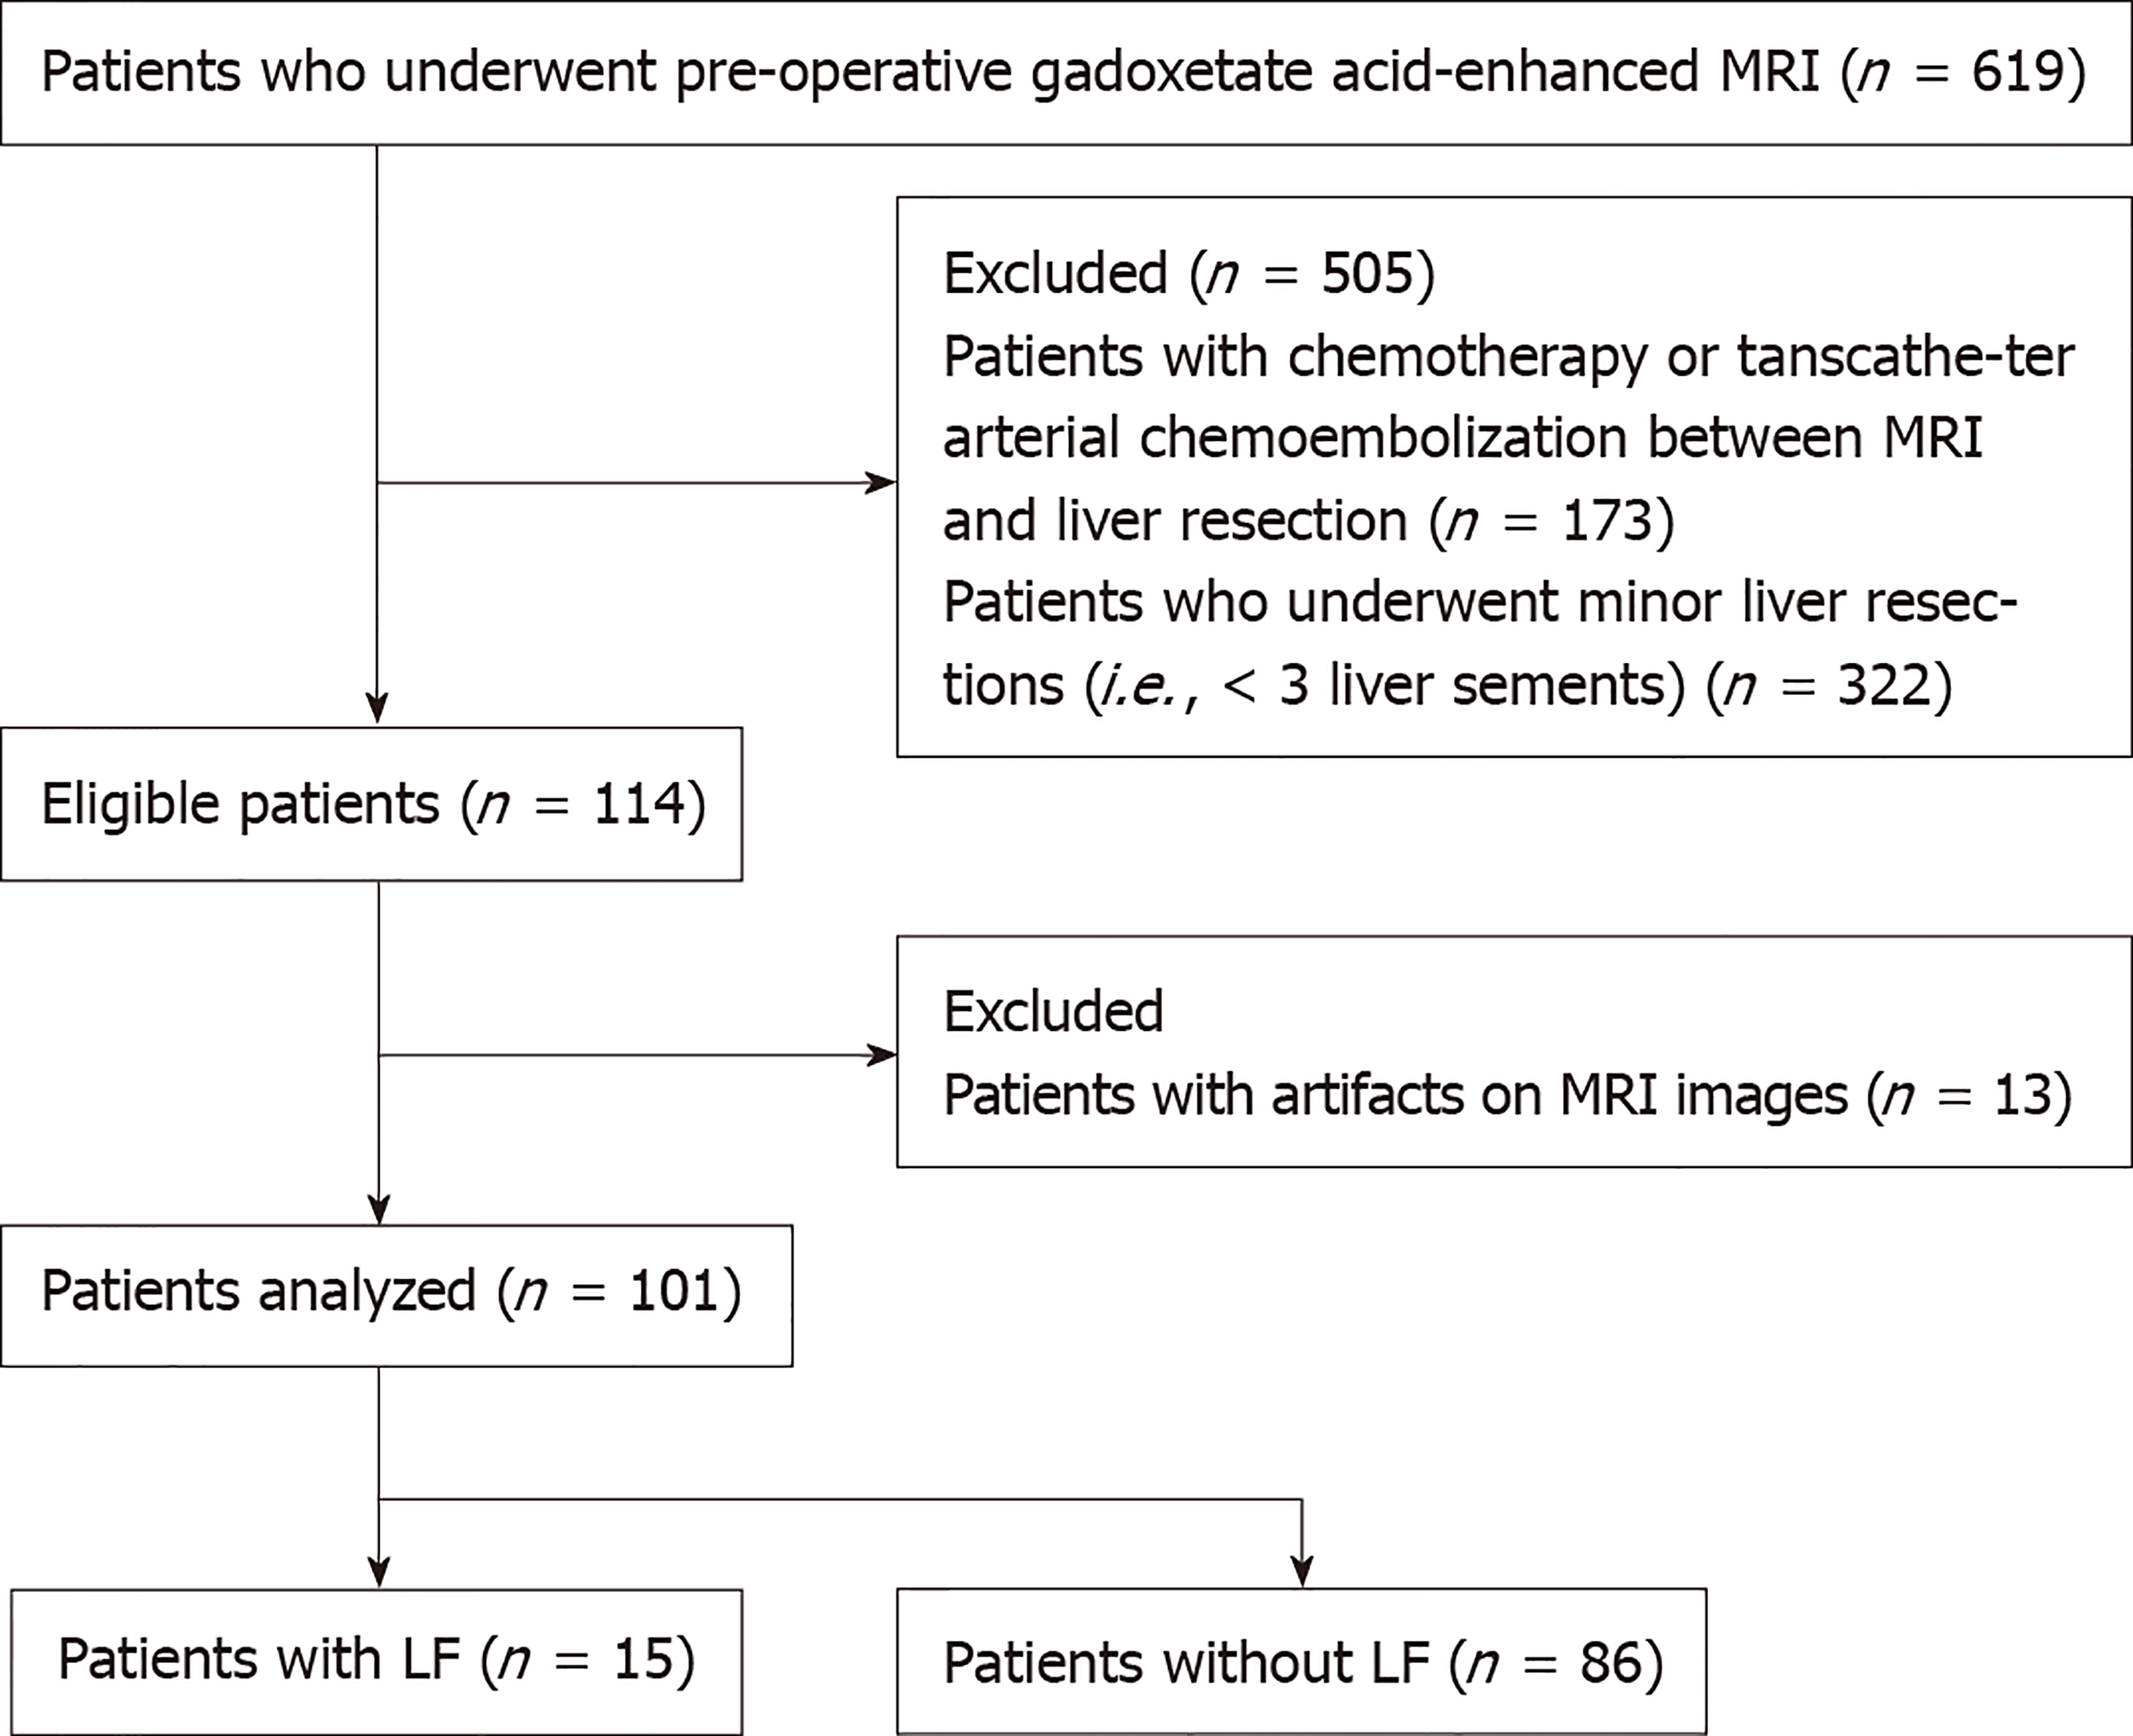
Figure 1 Flow diagram shows patient selection.
LF: Liver failure; MRI: Magnetic resonance imaging.
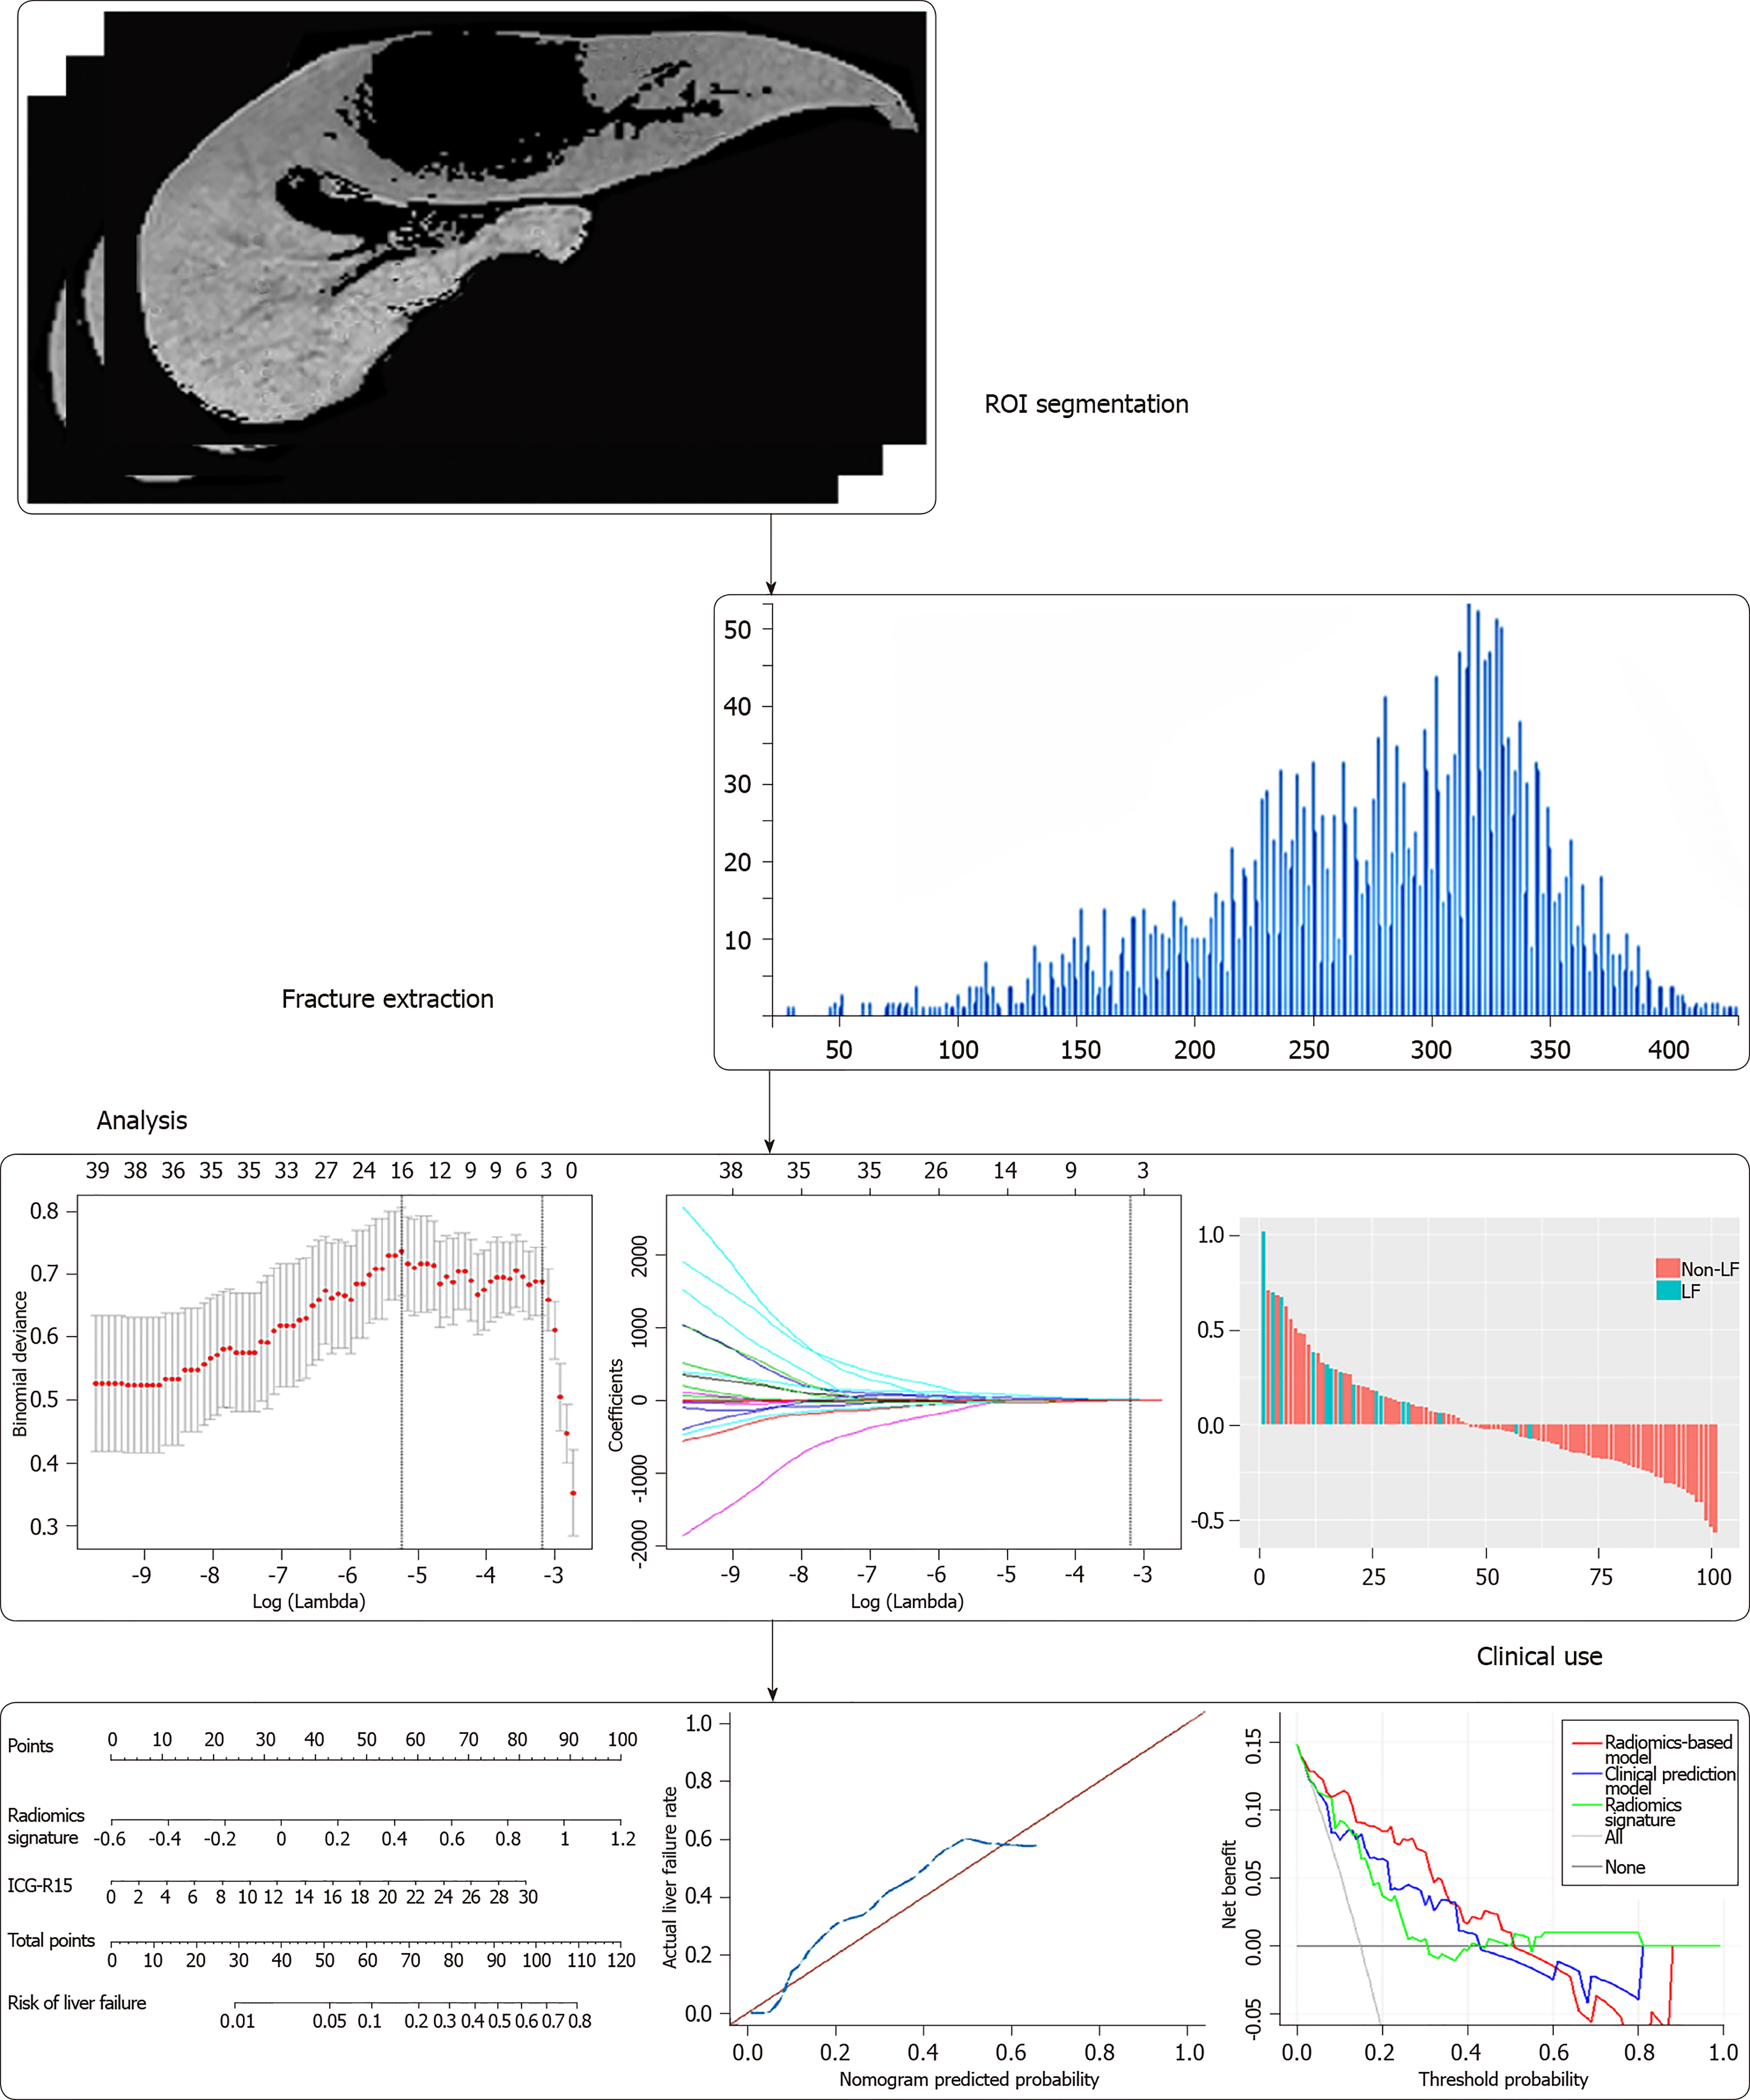
Figure 2 Workflow of necessary steps in current study.
Region of interests were drawn on hepatobiliary phase gadoxetic acid-enhanced magnetic resonance images. For feature selection, the least absolute shrink-age and selection operator method was applied to select significant features. The radiomics signature was constructed by a linear combination of selected features. The performance of the prediction model was assessed by the area under a receiver operating characteristic curve and the calibration curve. To provide a more understandable outcome measure, a nomogram was built for individualized evaluation, followed by decision curve analysis. ROIs: Region of interests.
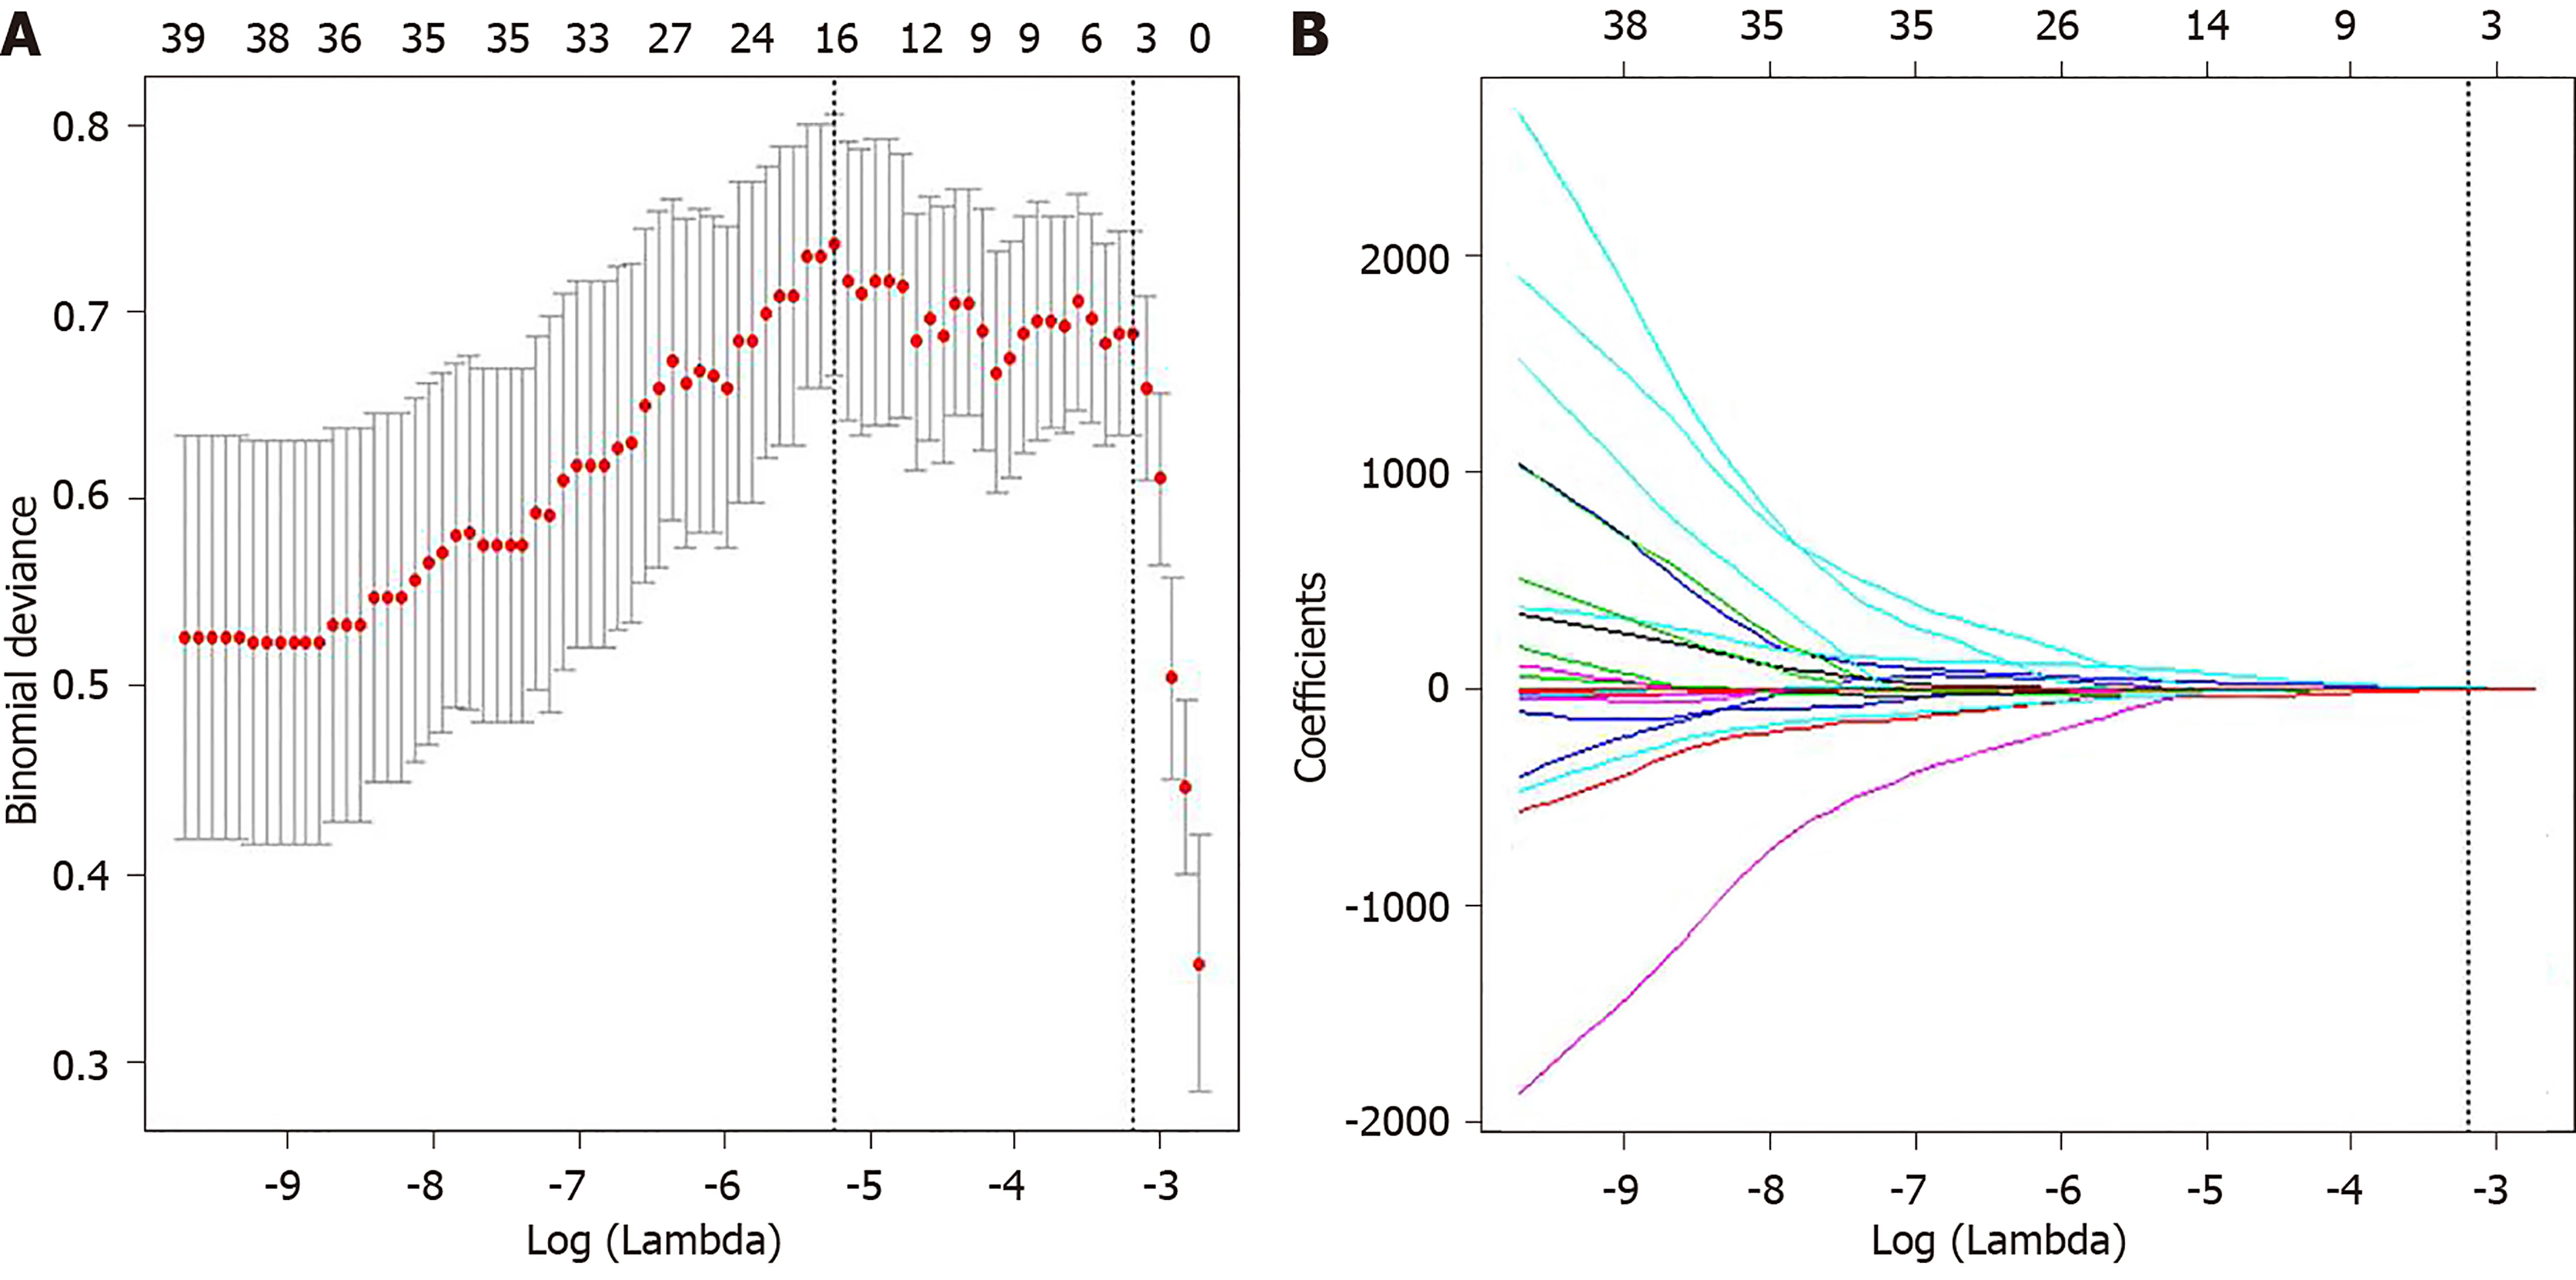
Figure 3 Radiomic feature selection using least absolute shrink-age and selection operator logistic regression.
A: Selection of tuning parameters (l) in the least absolute shrink-age and selection operator model used 10-fold cross-validation via minimum criteria. The area under the curve was plotted vs log (λ). Dotted vertical lines were drawn at the optimal values using the minimum criteria and the 1 standard error of the minimum criteria (the 1 - standard error criteria); B: Least absolute shrink-age and selection operator coefficient profiles of the radiomic features. A vertical line was plotted at the optimal λ value, which resulted in five features with nonzero coefficients.
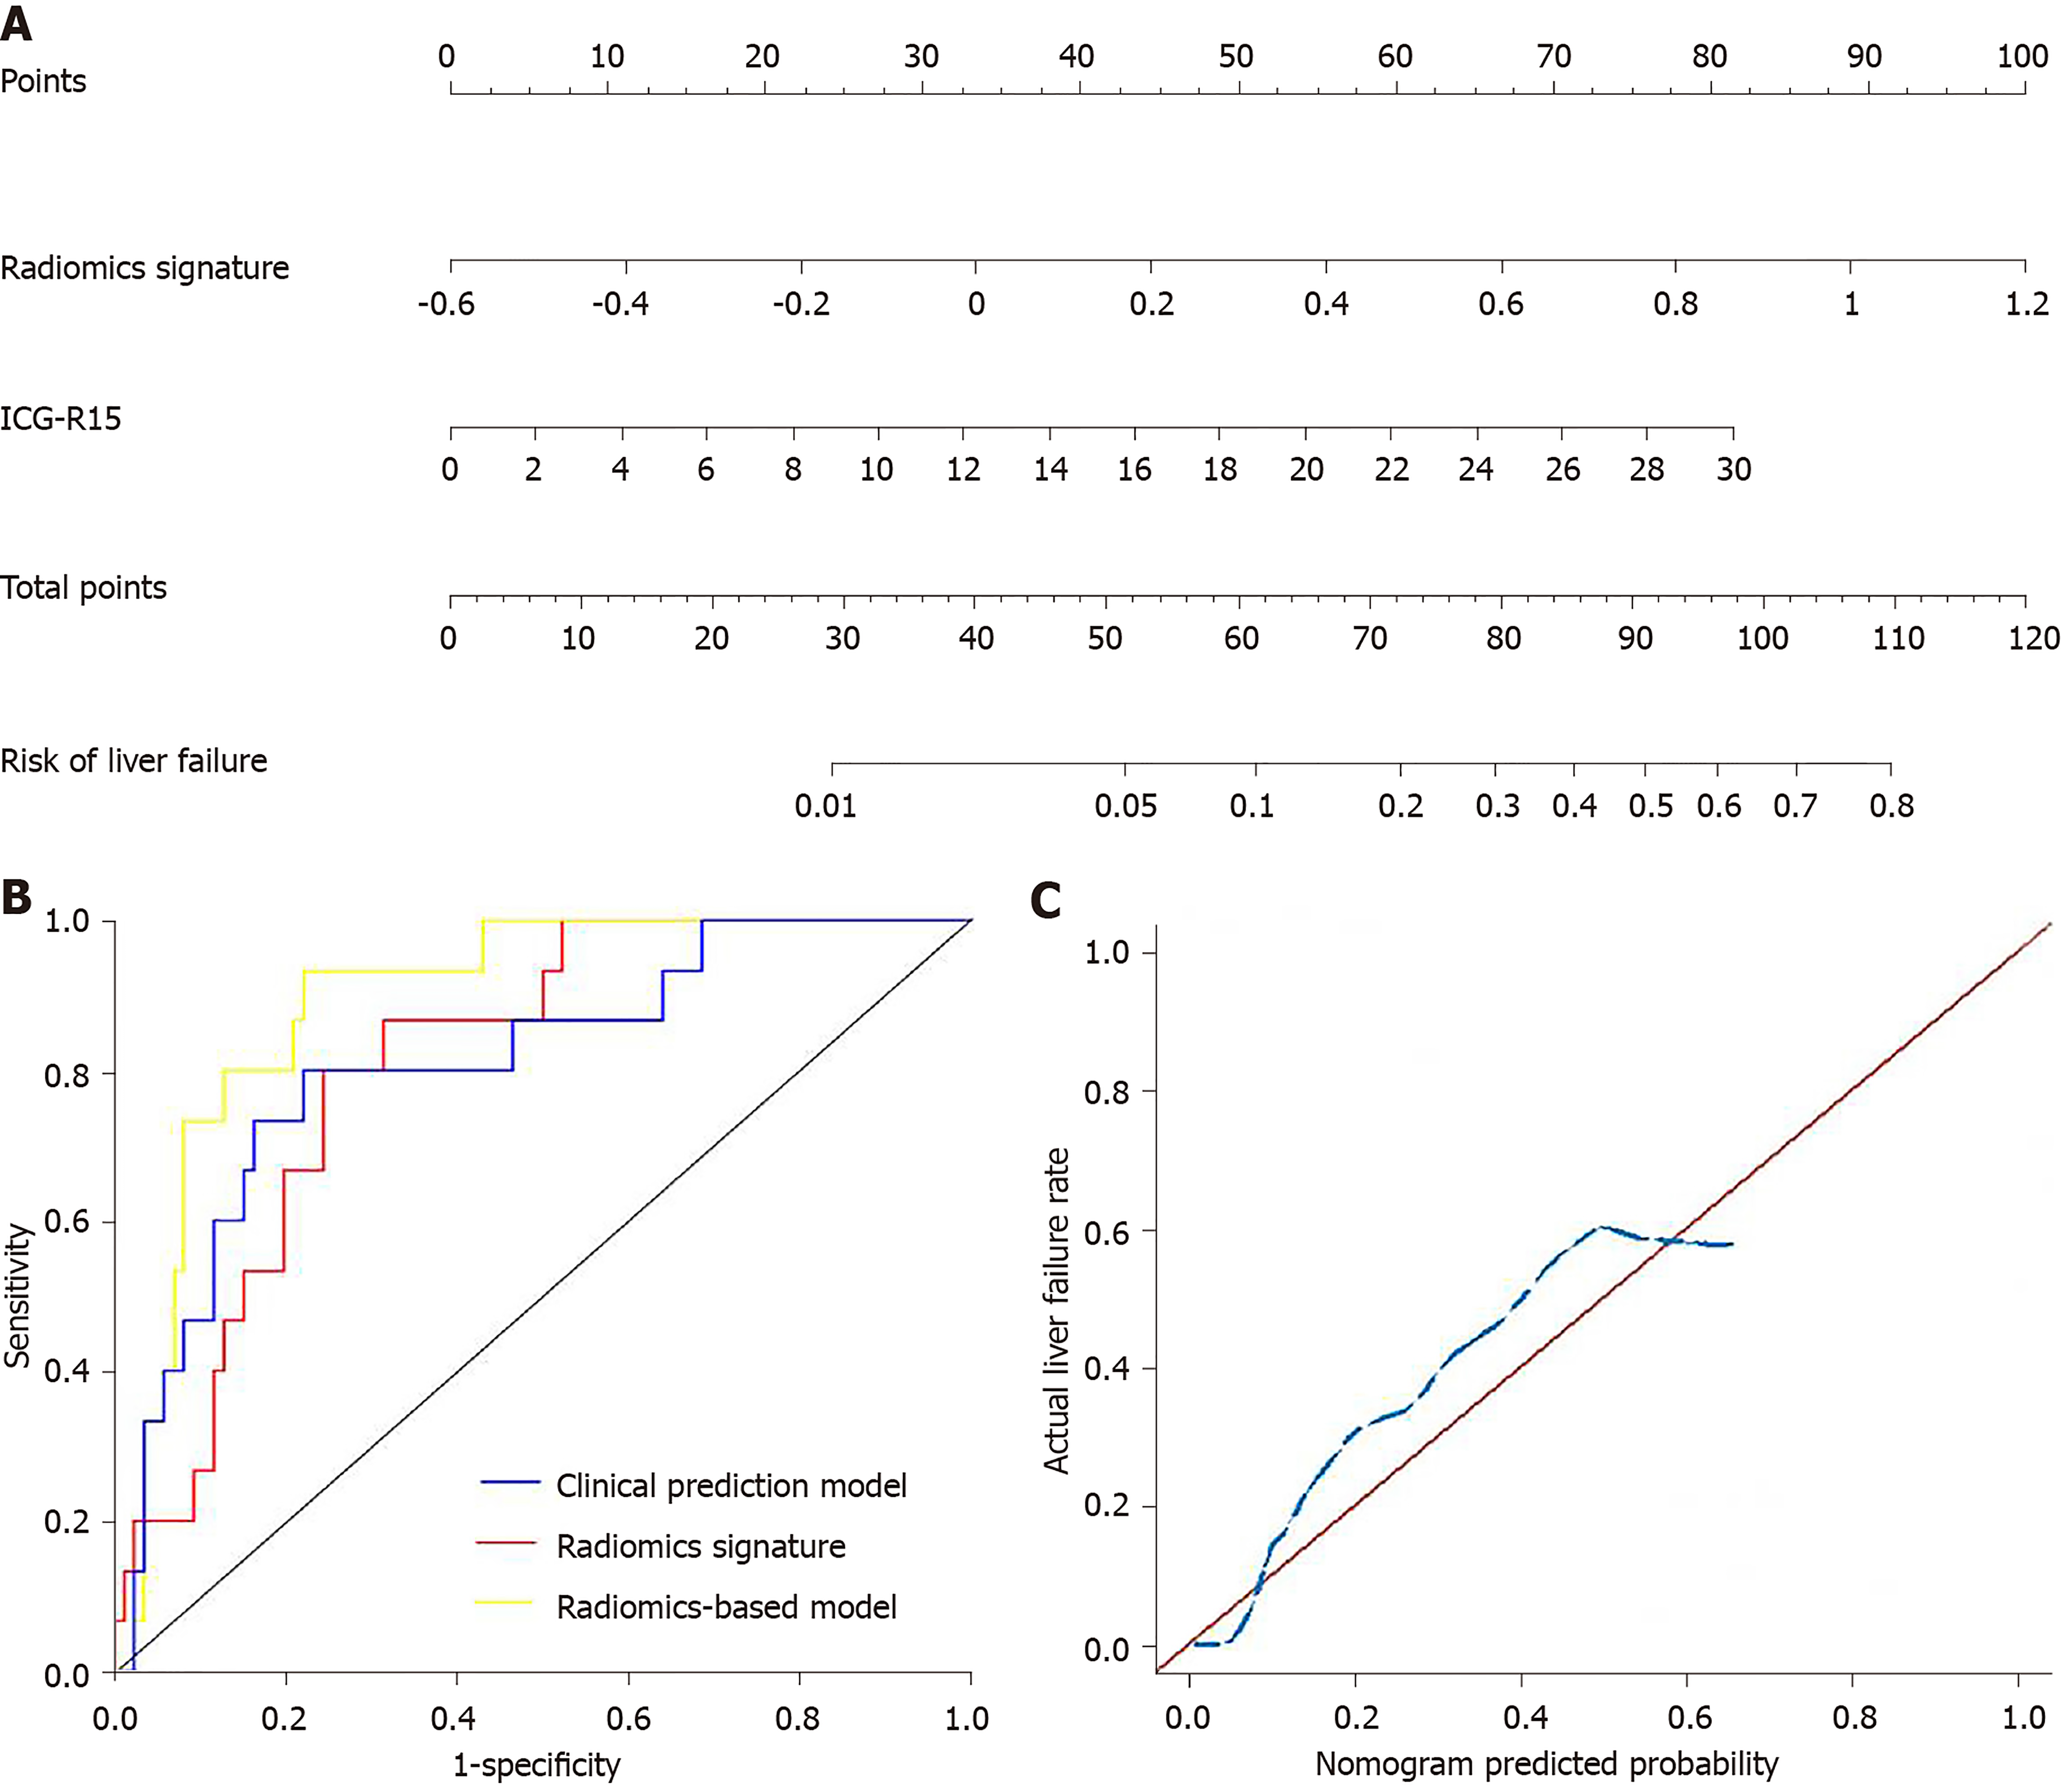
Figure 4 Radiomics nomogram and receiver operating characteristic curves and calibration curves of three predictive models.
A: A nomogram was developed with incorporation of radiomics signature and indocyanine green retention rate at 15 min; B: Comparison of receiver operating characteristic curves of clinical prediction model, radiomics signature and radiomics-based model for the prediction of liver failure; C: Calibration curves of the nomogram.
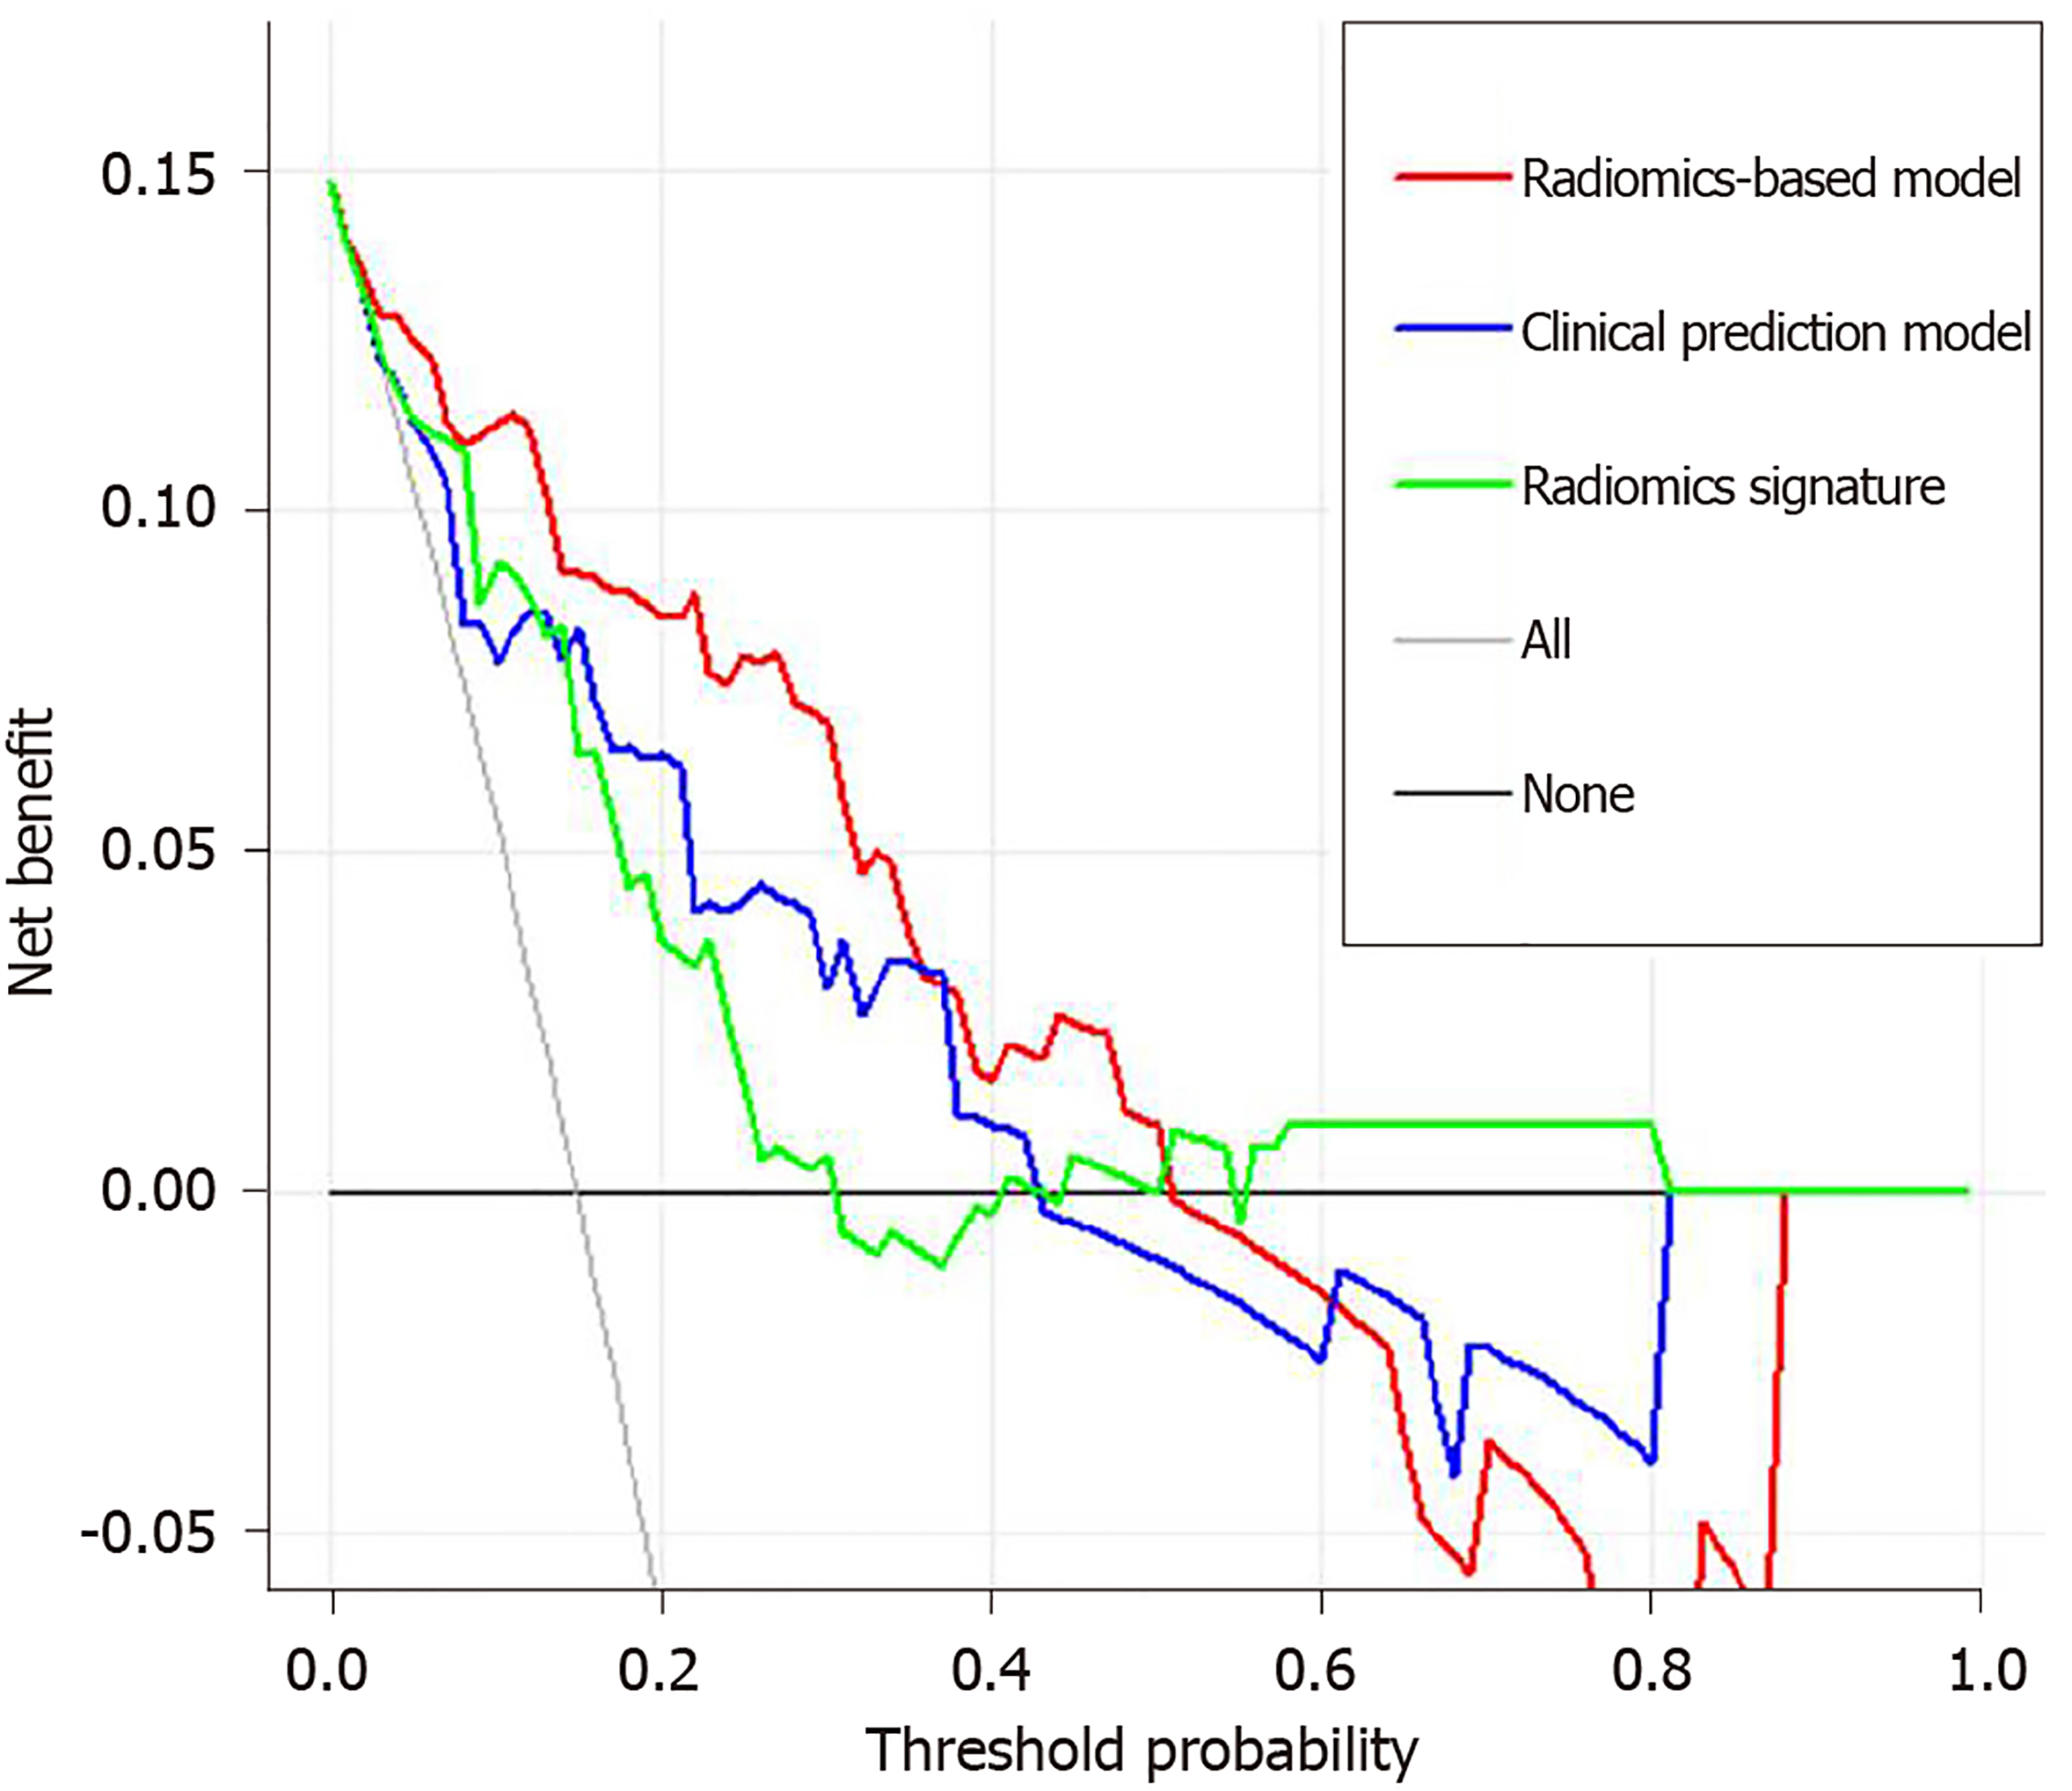
Figure 5 Decision curve analysis for each model.
The y-axis measures the net benefit, which is calculated by summing the benefits (true-positive findings) and subtracting the harms (false-positive findings), weighting the latter by a factor related to the relative harm of undetected liver failure compared with the harm of unnecessary treatment. The decision curve showed the application of radiomics-based model to predict liver failure adds more benefit than treating all or none of the patients, clinical prediction model, and radiomics signature.
- Citation: Zhu WS, Shi SY, Yang ZH, Song C, Shen J. Radiomics model based on preoperative gadoxetic acid-enhanced MRI for predicting liver failure. World J Gastroenterol 2020; 26(11): 1208-1220
- URL: https://www.wjgnet.com/1007-9327/full/v26/i11/1208.htm
- DOI: https://dx.doi.org/10.3748/wjg.v26.i11.1208


