Copyright
©The Author(s) 2020.
World J Gastroenterol. Mar 21, 2020; 26(11): 1197-1207
Published online Mar 21, 2020. doi: 10.3748/wjg.v26.i11.1197
Published online Mar 21, 2020. doi: 10.3748/wjg.v26.i11.1197
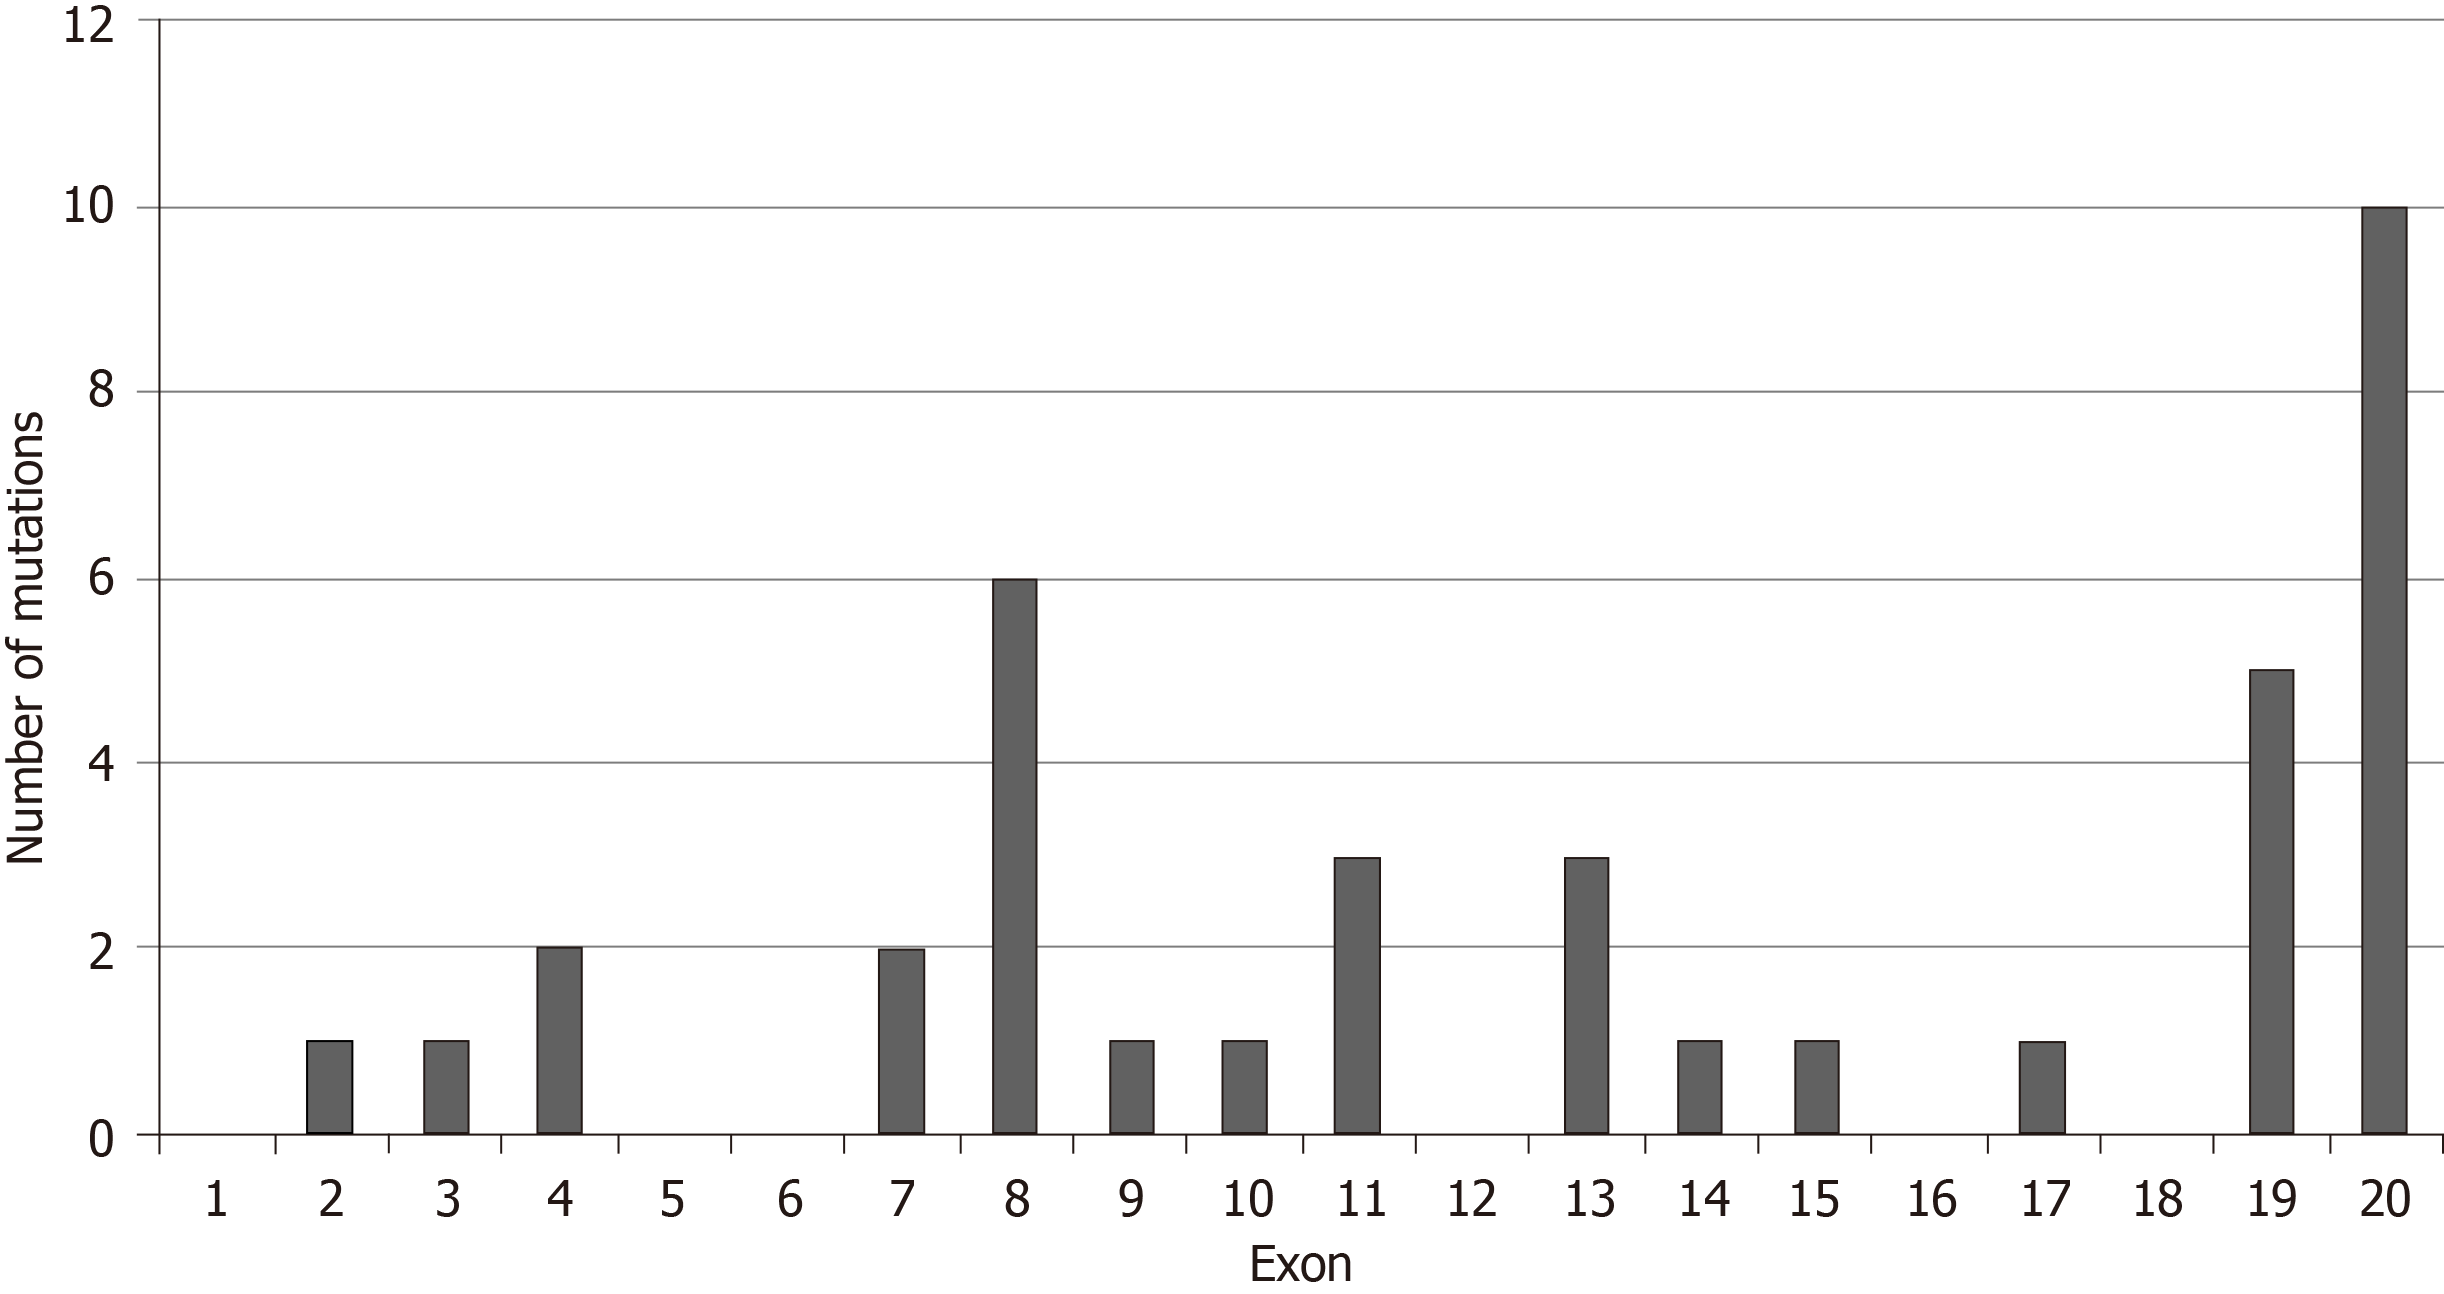
Figure 1 Number of mutations in each exon of BRIP1.
The total number of mutations in the five gastrointestinal adenocarcinomas examined were 38 in 30 samples.
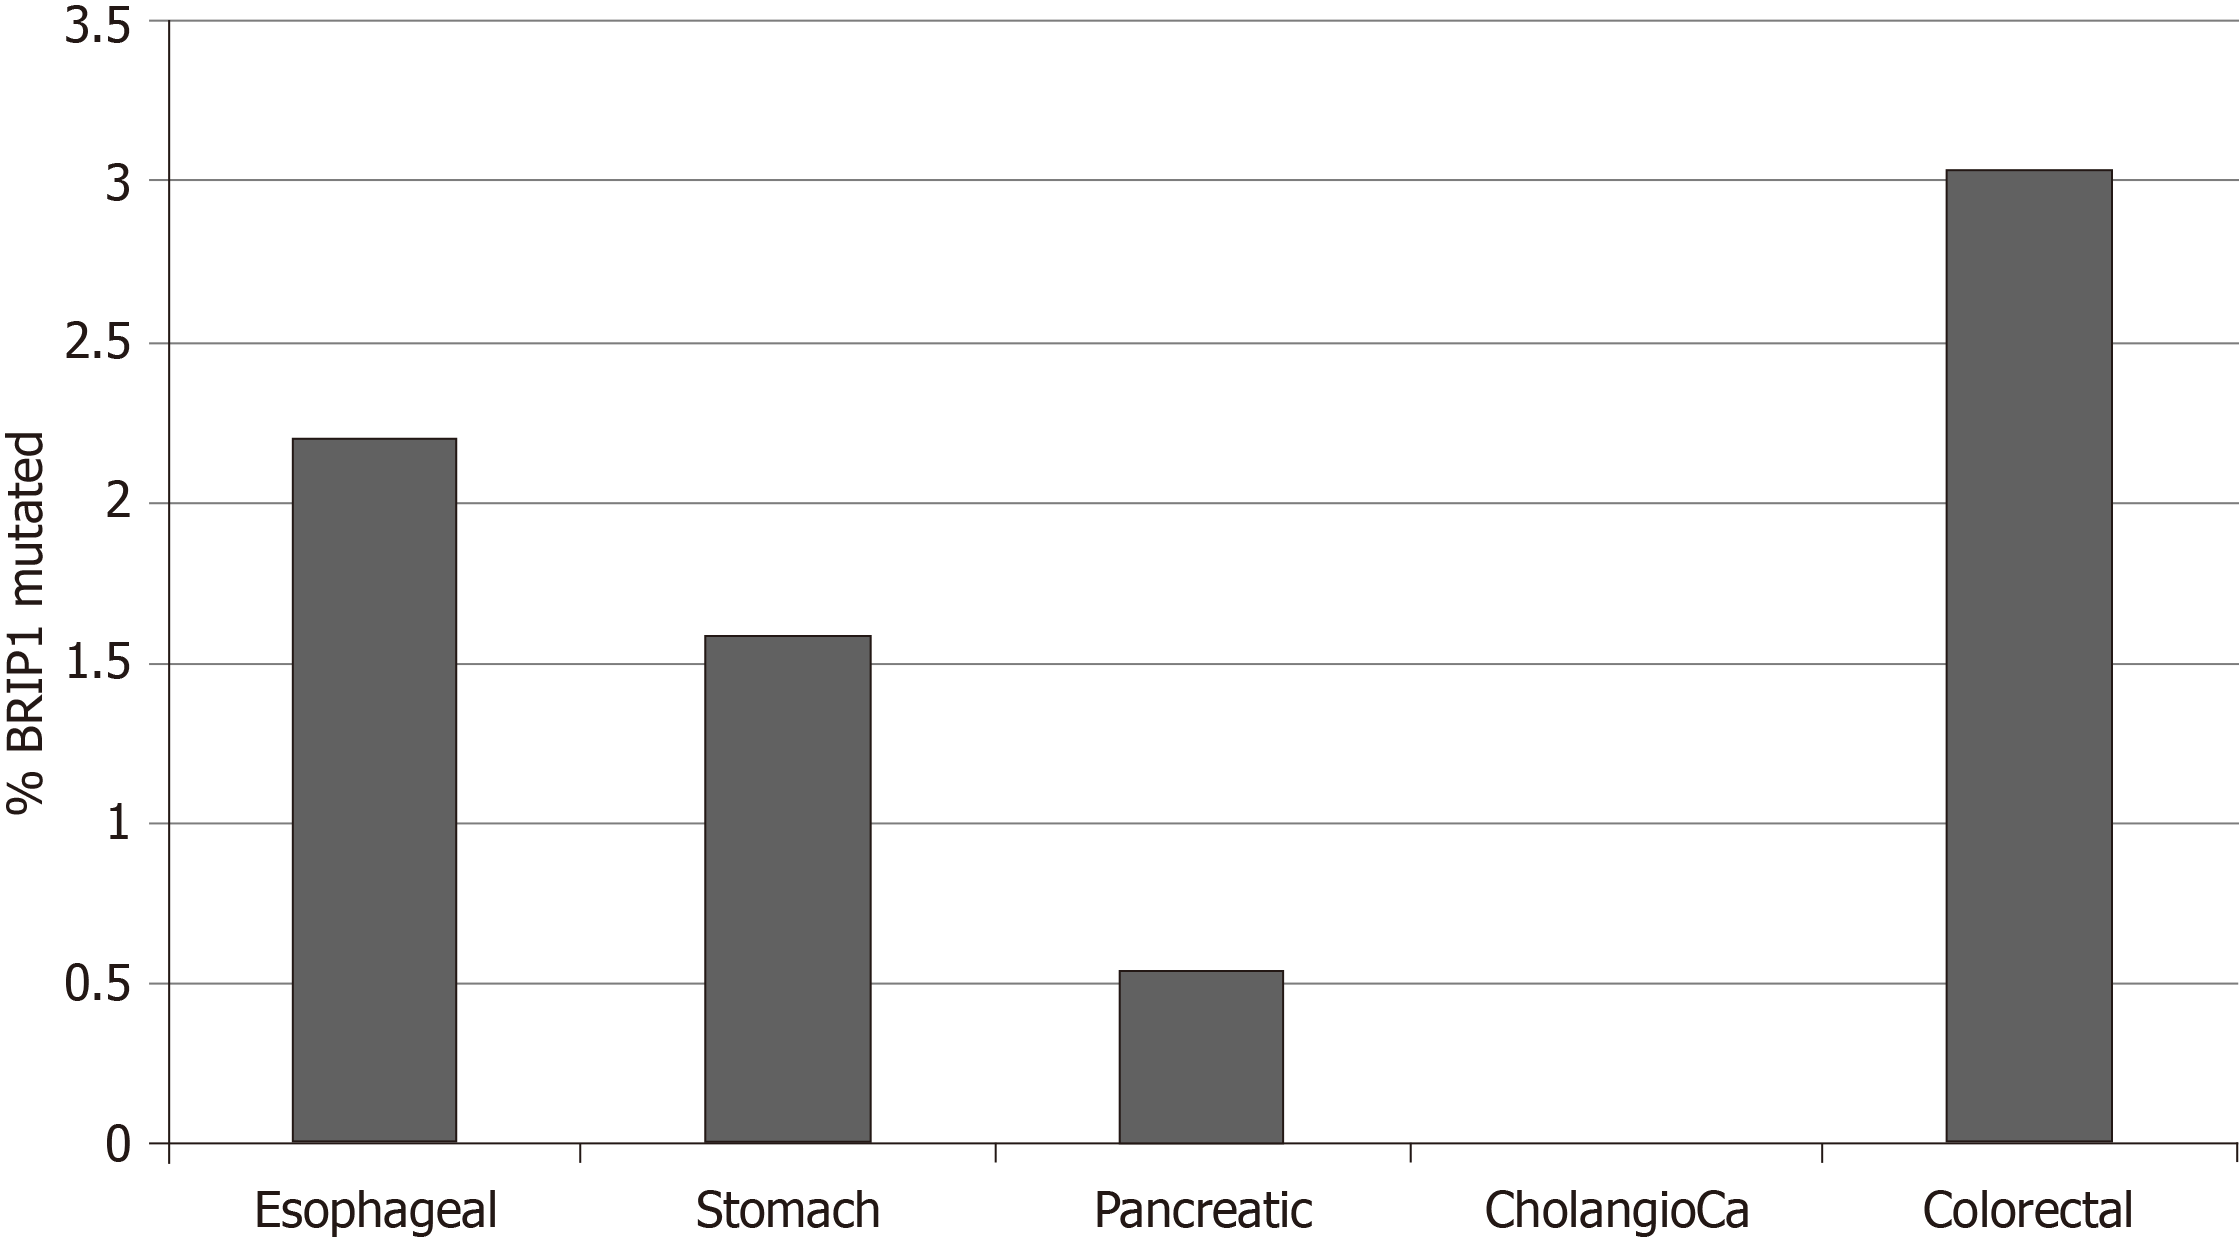
Figure 2 Percentage of BRIP1 mutations in the five gastrointestinal adenocarcinomas.
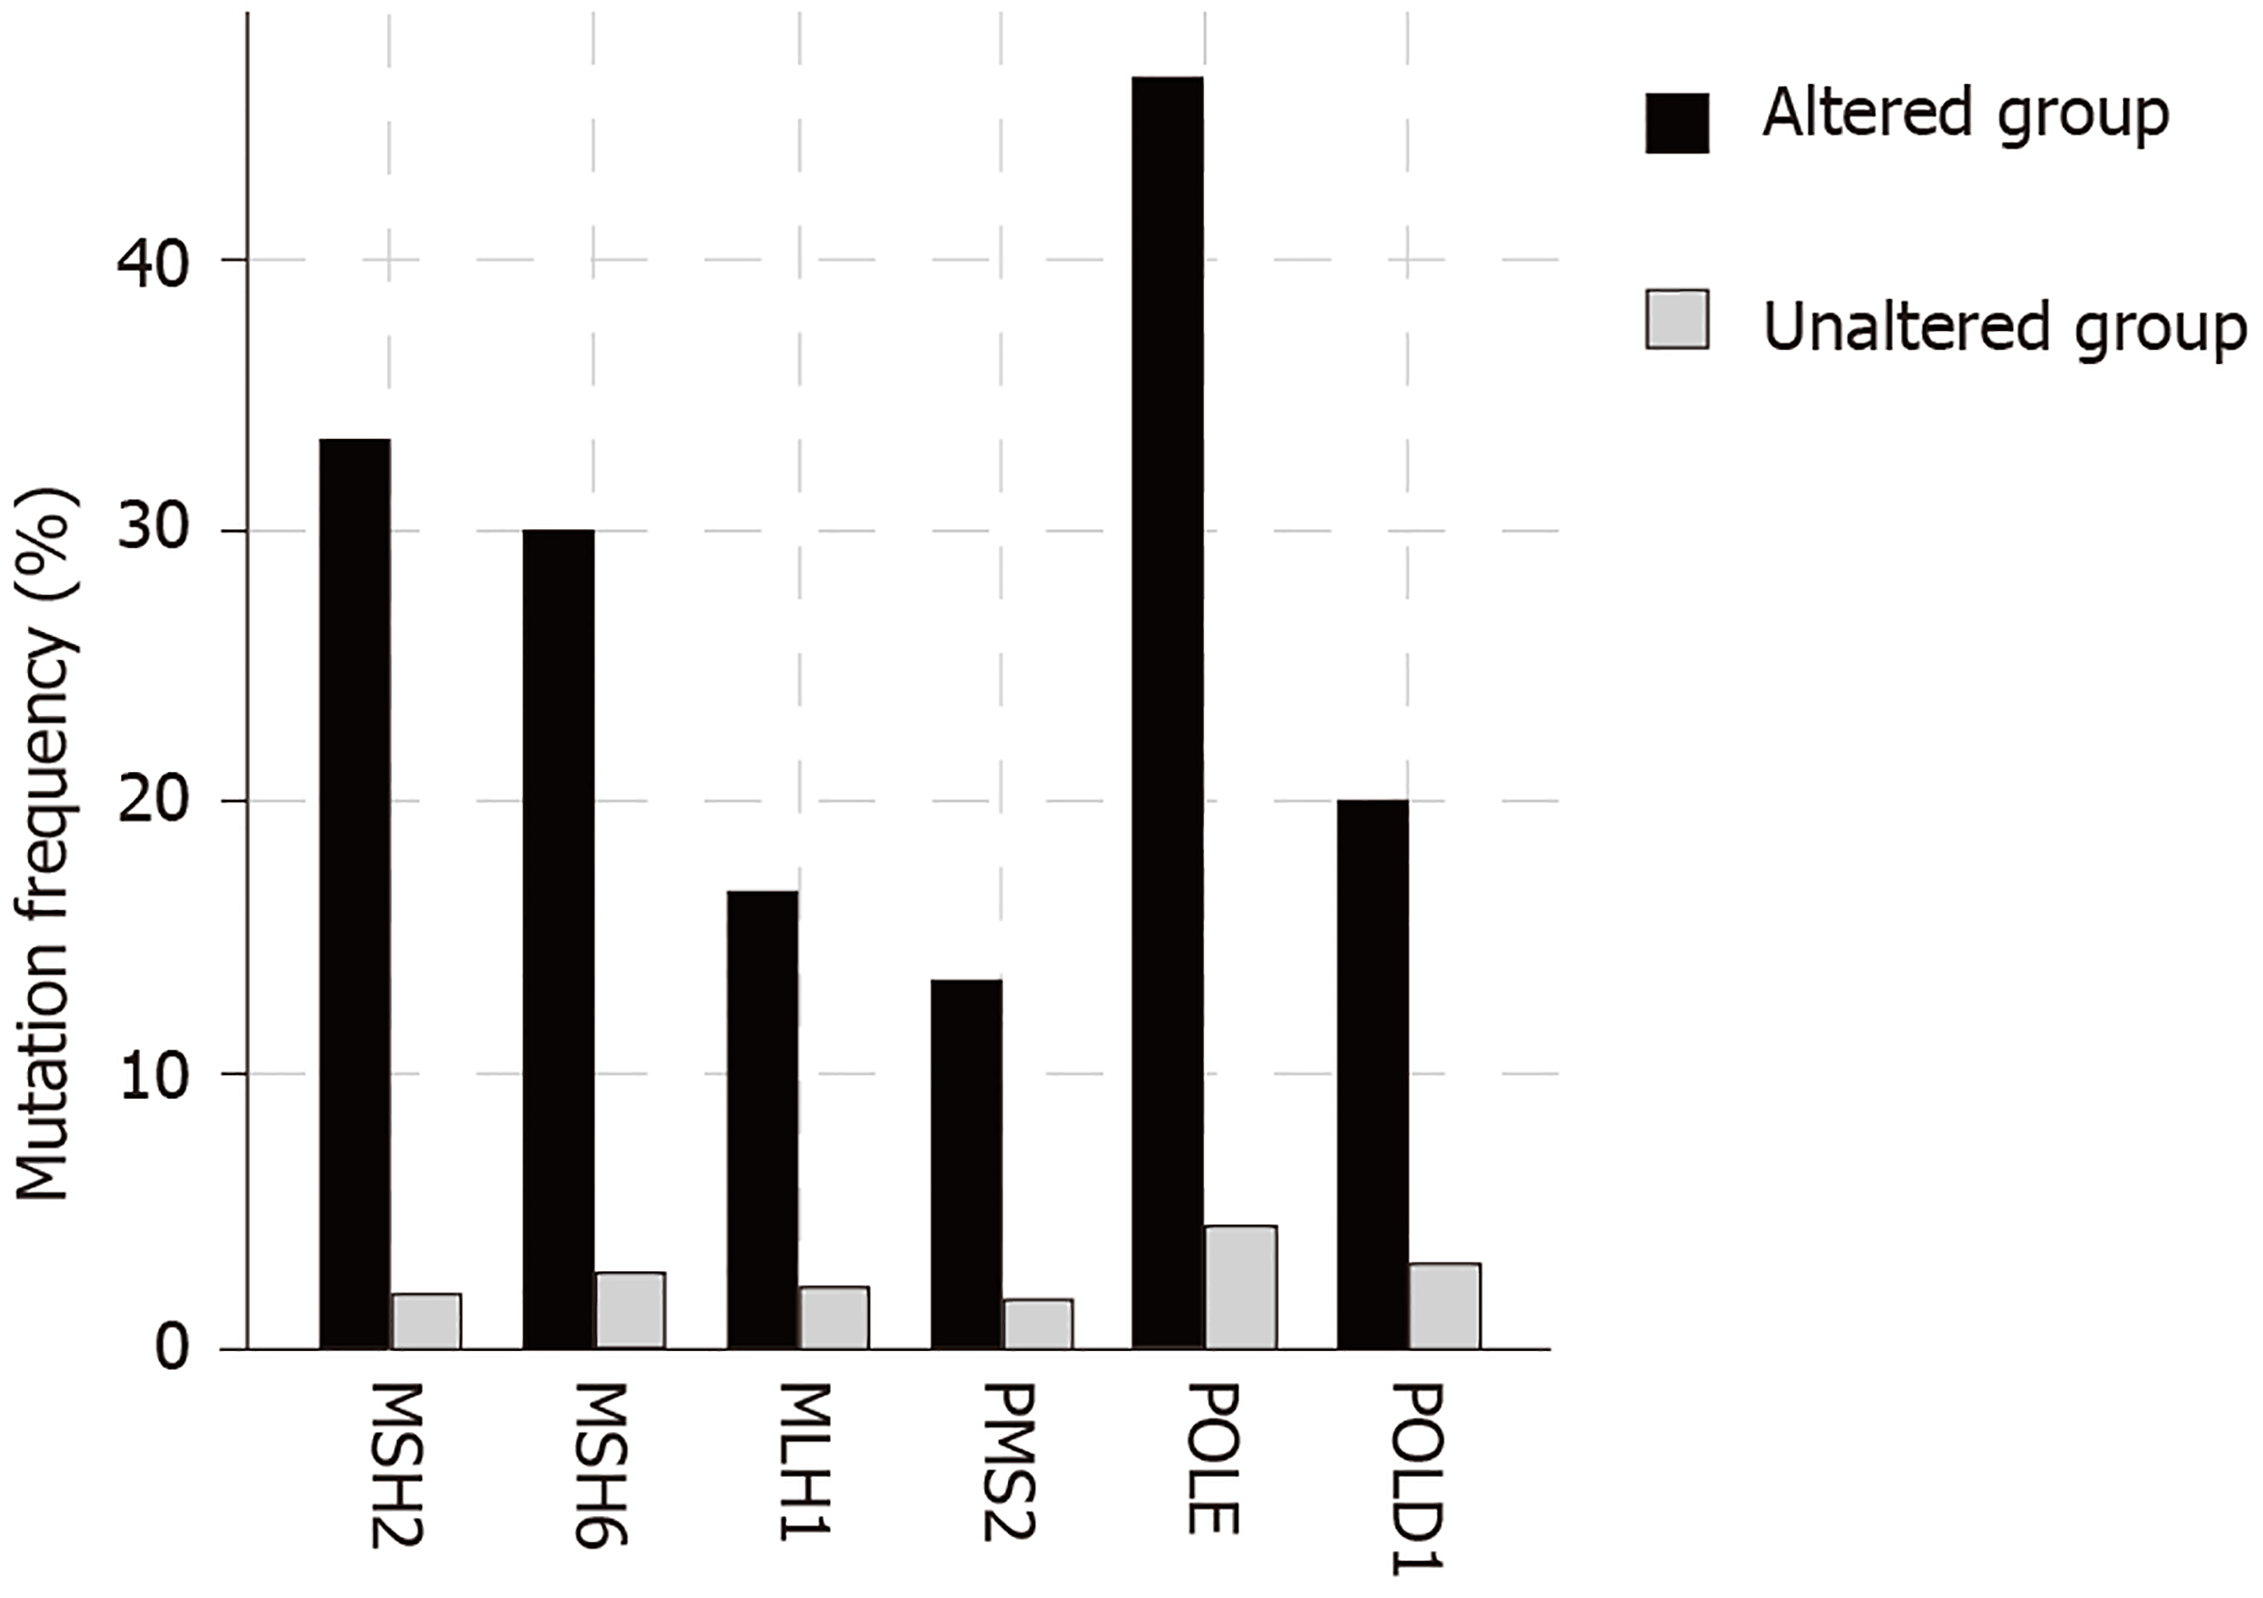
Figure 3 Mutation frequency of MSI and POLE/POLD1 genes in gastrointestinal cancers with BRIP1 abnormalities (altered group) and without BRIP1 abnormalities (unaltered group).
Comparison of the altered and unaltered group is statistically significant for all six genes.
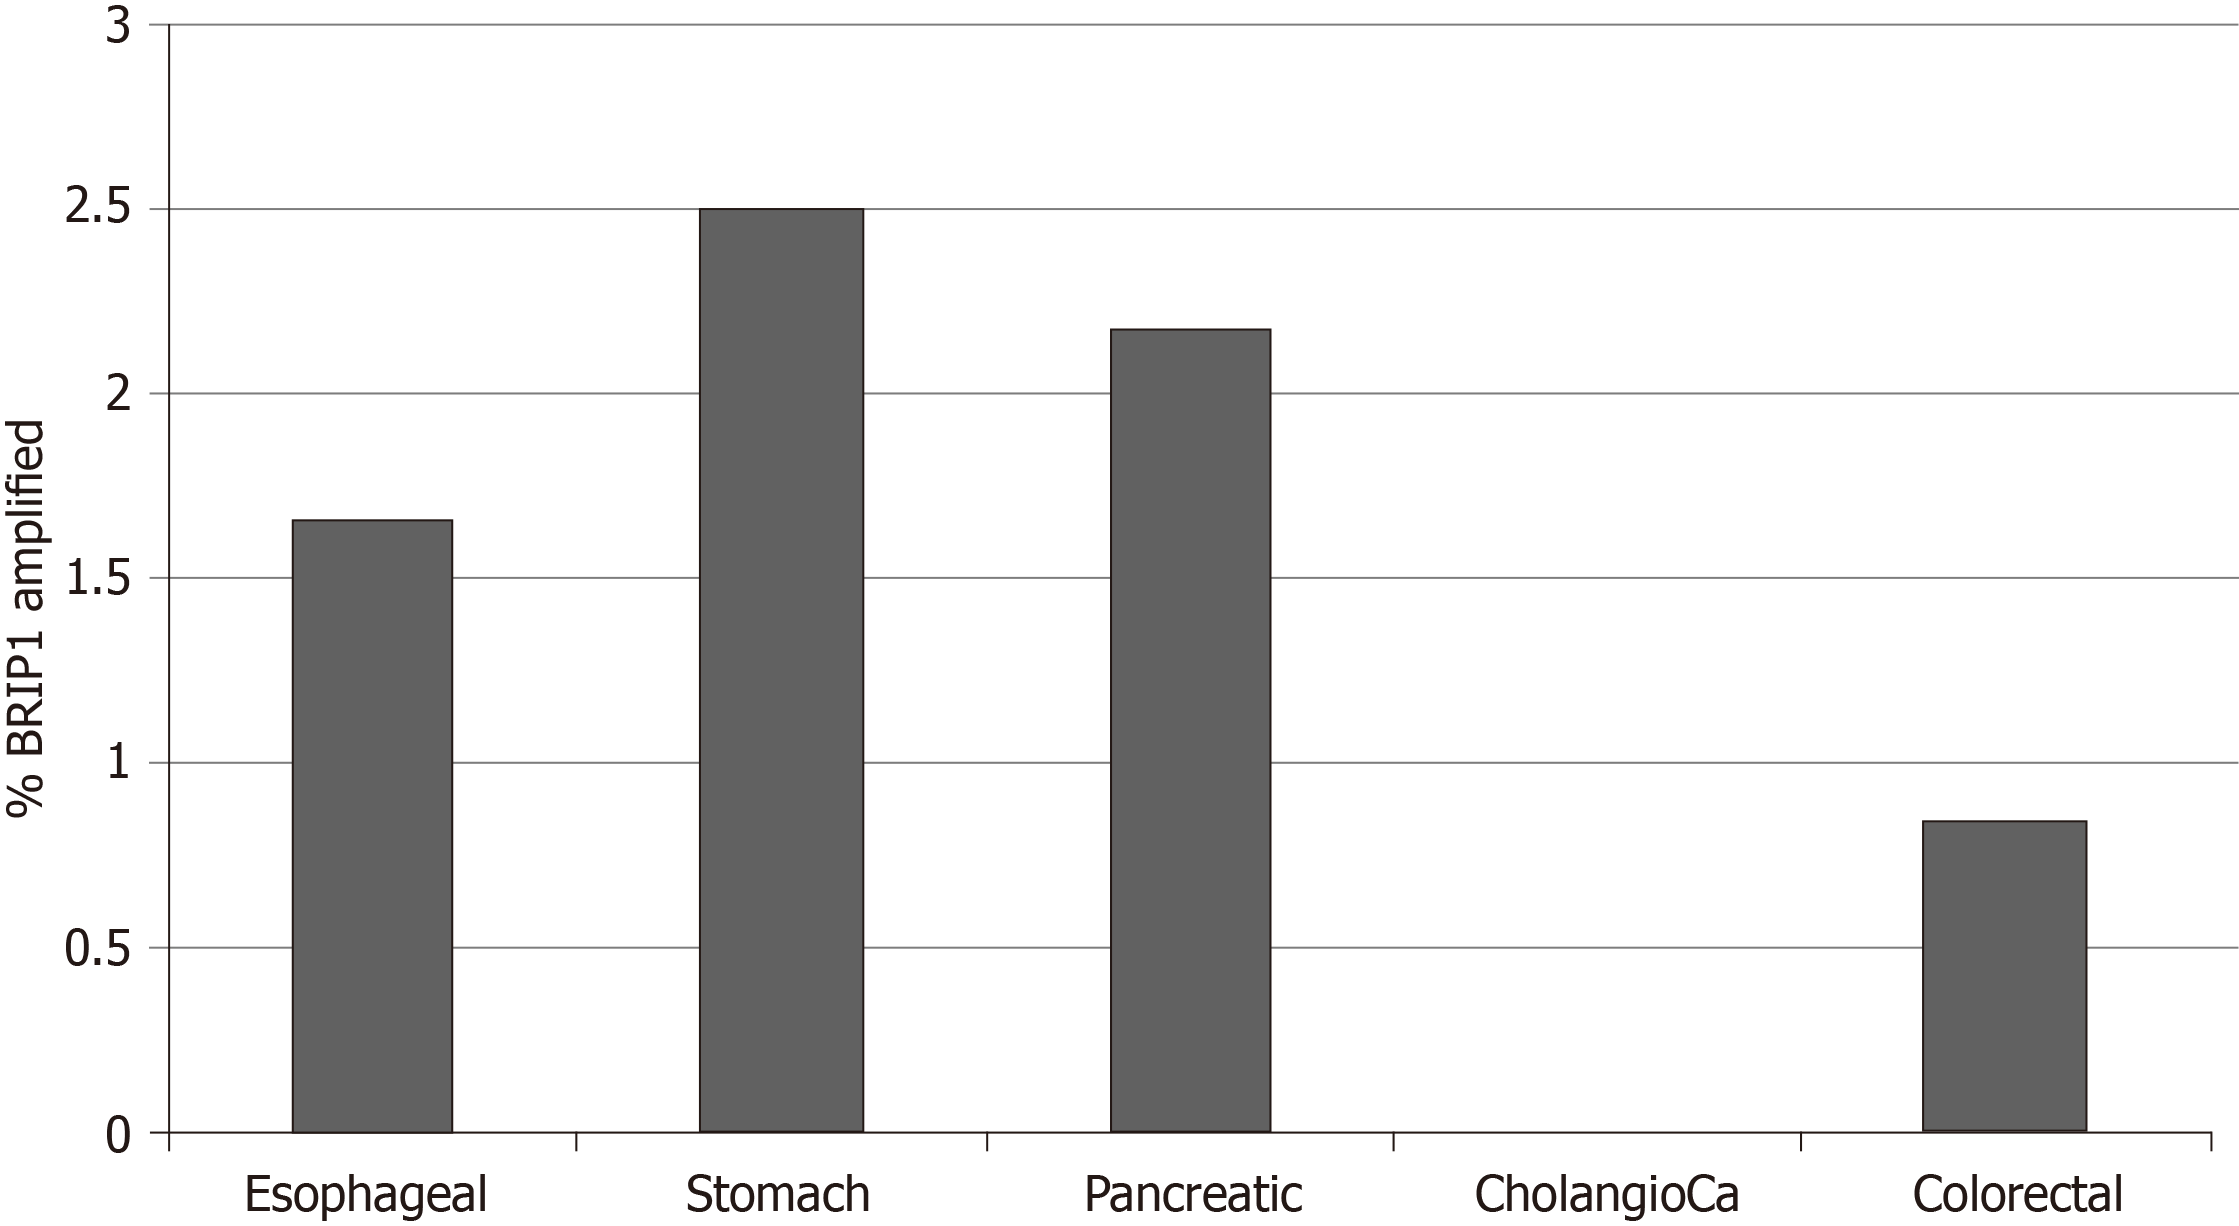
Figure 4 Percentage of BRIP1 amplifications in the five gastrointestinal adenocarcinomas.
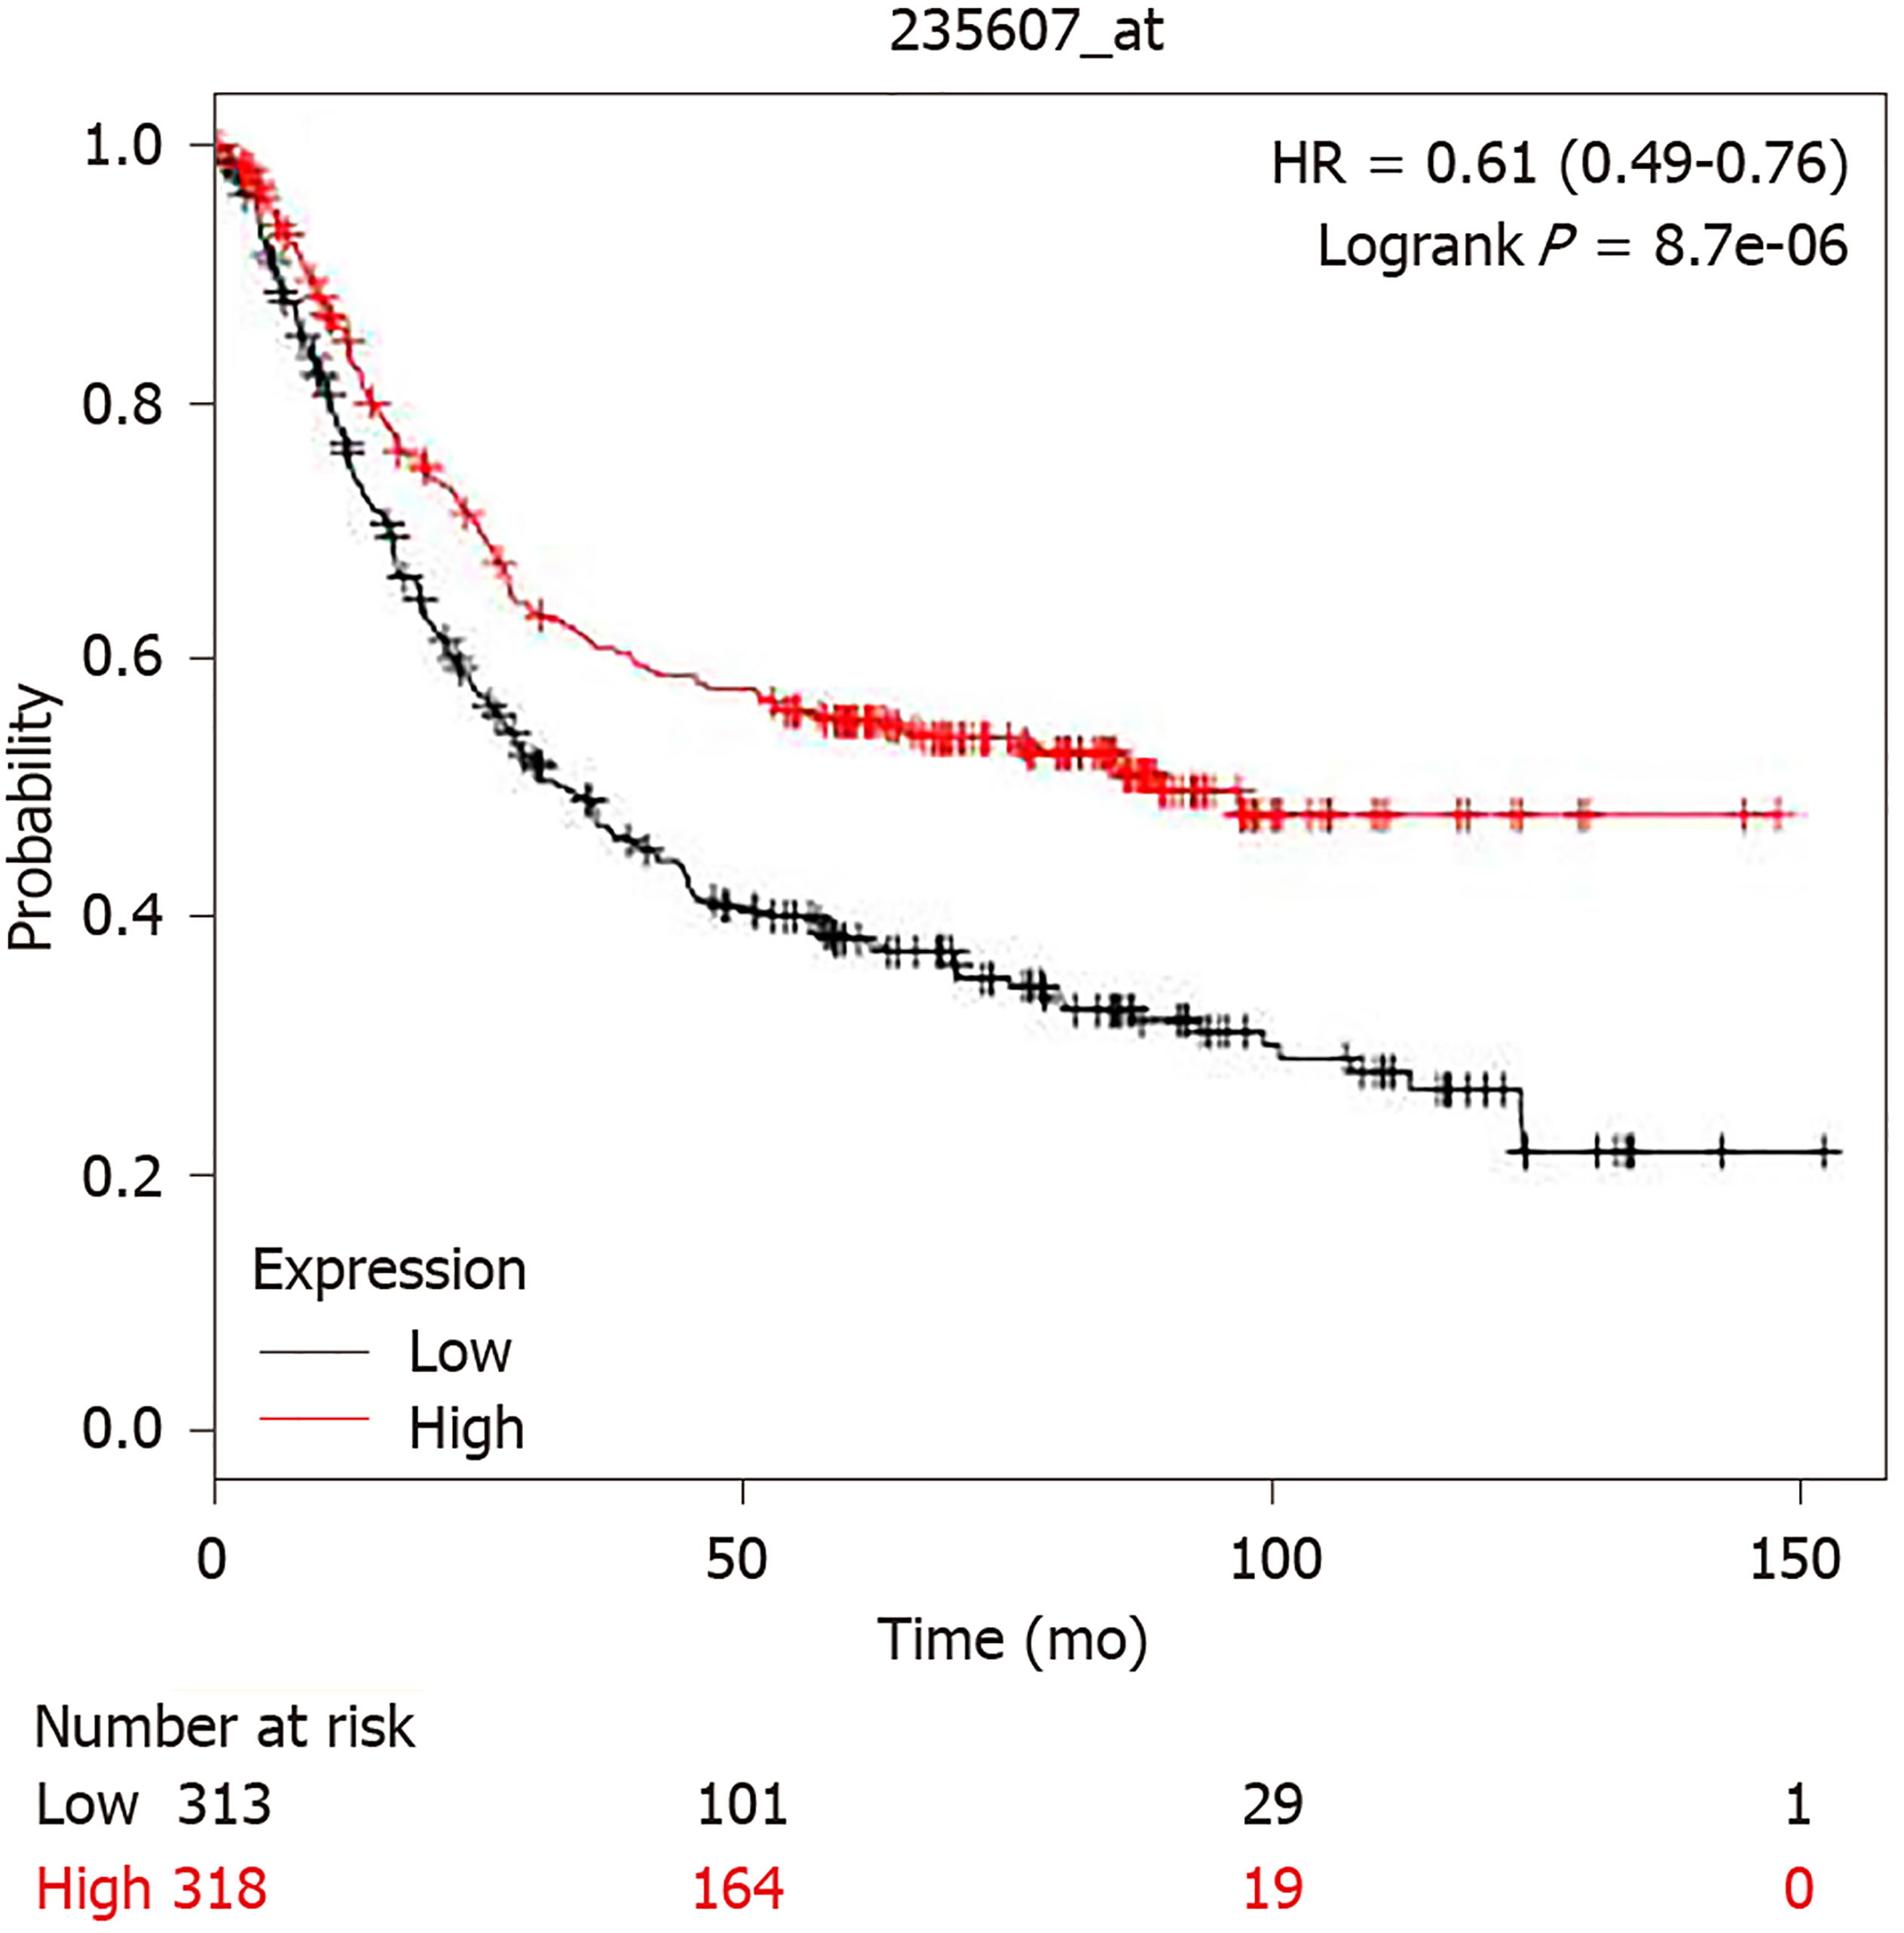
Figure 5 Comparison of overall survival in gastric cancer patients with higher (above the median) and lower (below the median) BRIP1 mRNA expression.
Higher BRIP1 mRNA expression was associated with improved overall survival compared with lower BRIP1 mRNA expression in gastric cancer.
- Citation: Voutsadakis IA. Landscape of BRIP1 molecular lesions in gastrointestinal cancers from published genomic studies. World J Gastroenterol 2020; 26(11): 1197-1207
- URL: https://www.wjgnet.com/1007-9327/full/v26/i11/1197.htm
- DOI: https://dx.doi.org/10.3748/wjg.v26.i11.1197


