Copyright
©The Author(s) 2020.
World J Gastroenterol. Mar 14, 2020; 26(10): 1067-1079
Published online Mar 14, 2020. doi: 10.3748/wjg.v26.i10.1067
Published online Mar 14, 2020. doi: 10.3748/wjg.v26.i10.1067
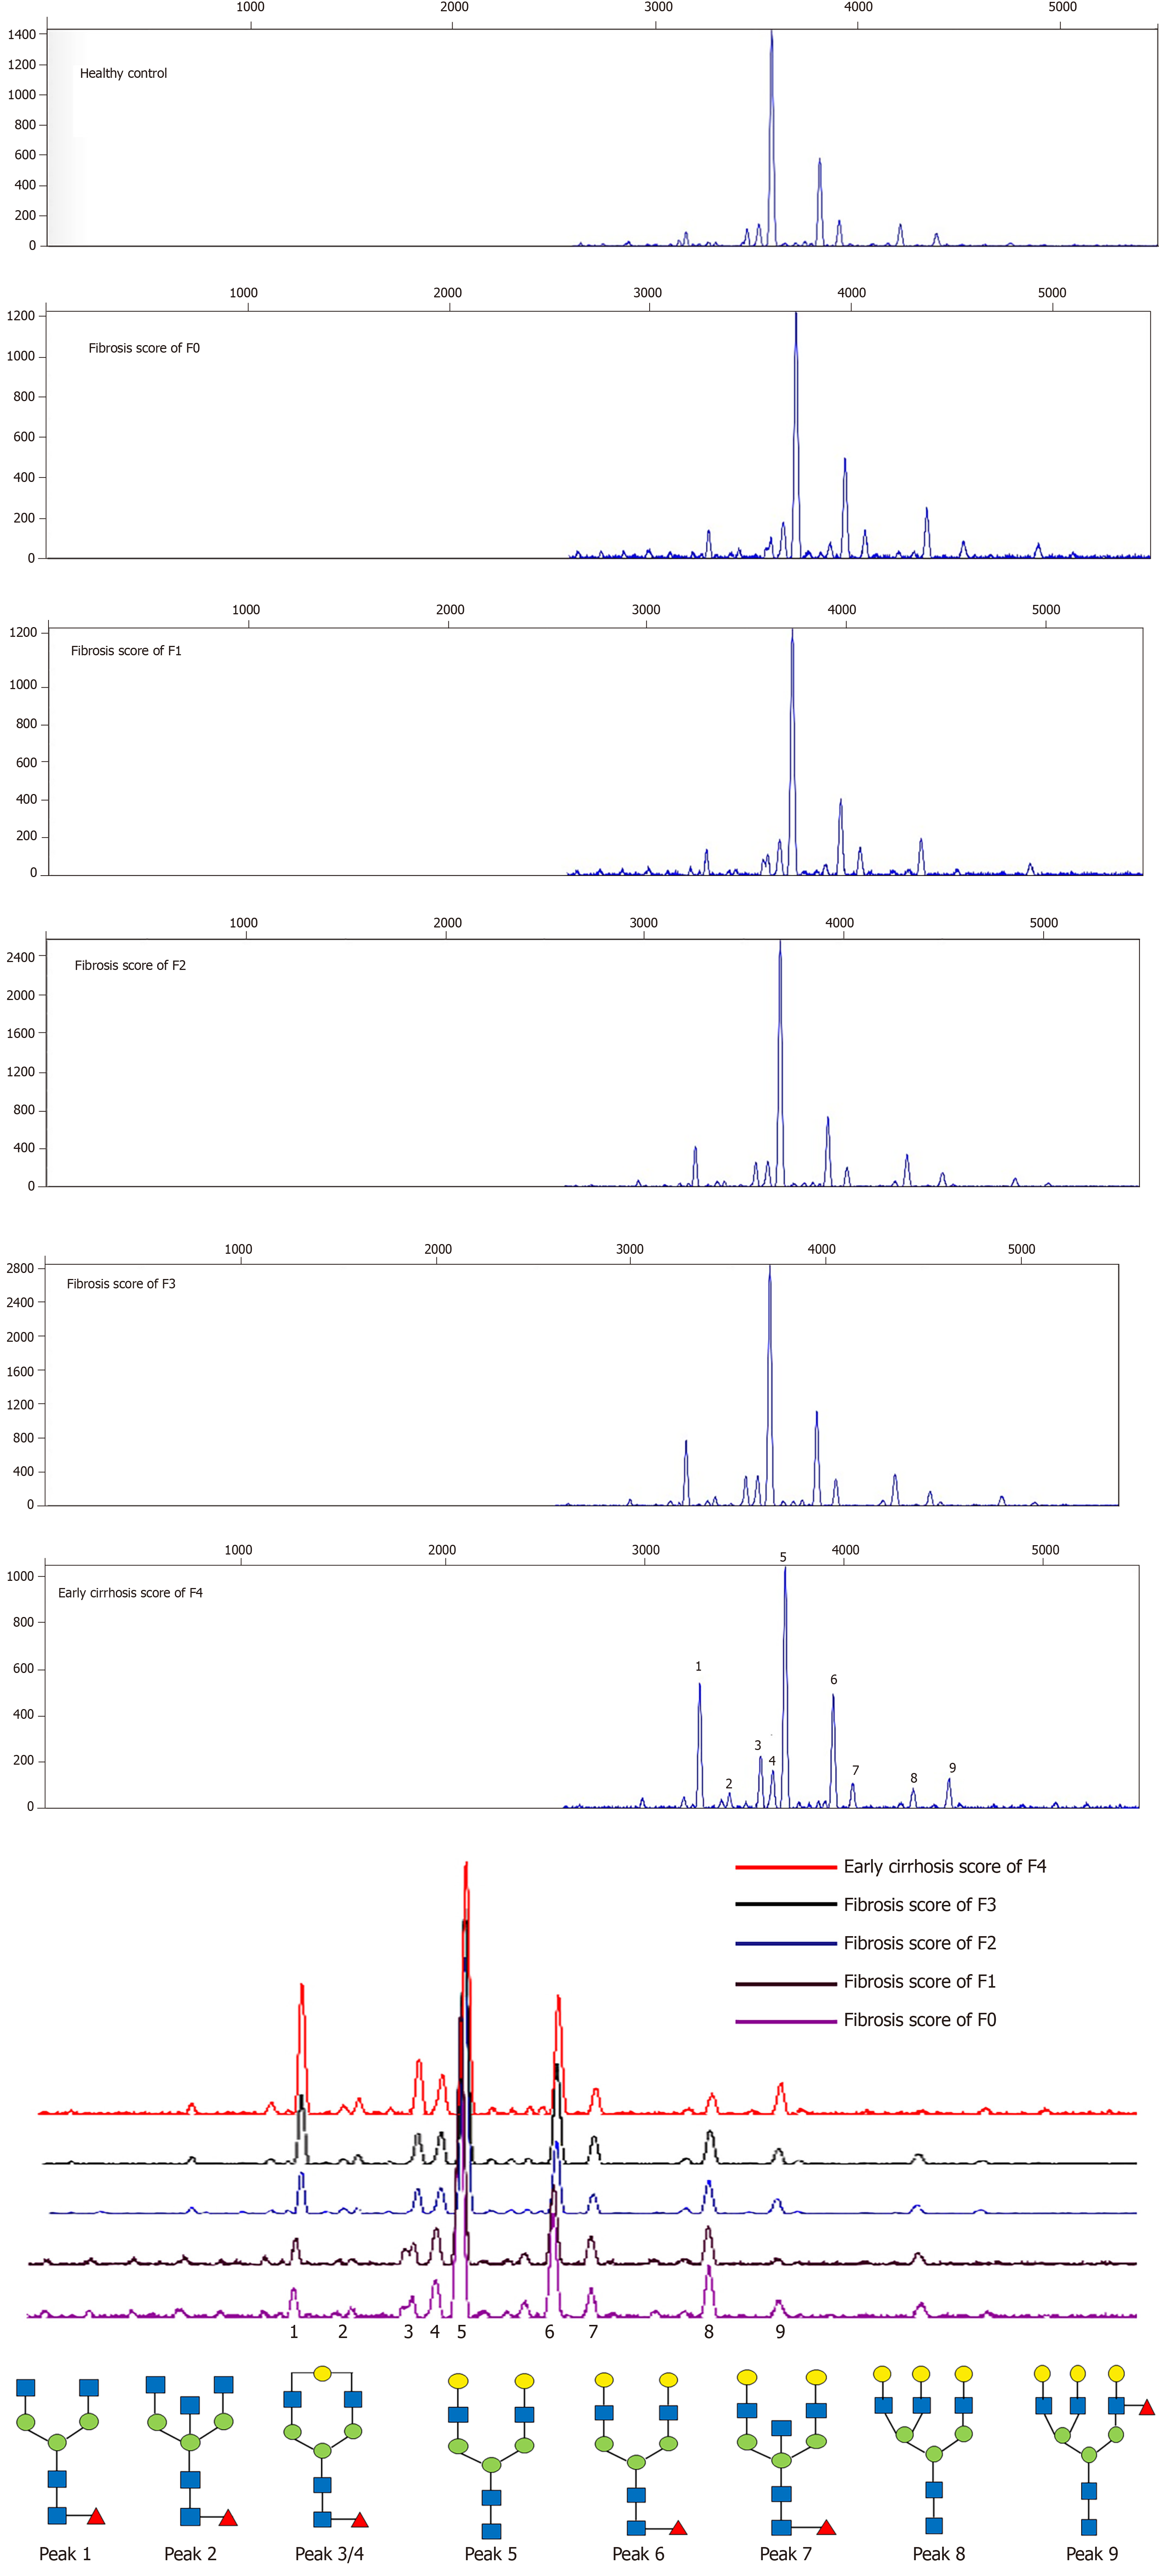
Figure 1 A typical desialylated N-glycan profile from the total serum protein is shown in panels.
The structures of the N-glycan peaks are shown below the panels. Peak 1 indicates an agalacto core-α-1,6-fucosylated biantennary glycan (NGA2F), peak 2 indicates an agalacto core-α-1,6-fucosylated bisecting biantennary glycan (NGA2FB), peaks 3 and 4 indicate a single agalacto core-α-1,6-fucosylated biantennary glycan (NG1A2F), peak 5 indicates a bigalacto biantennary glycan (NA2), peak 6 indicates a bigalacto core-α-1,6-fucosylated biantennary glycan (NA2F), peak 7 indicates a bigalacto core-α-1,6-fucosylated bisecting biantennary glycan (NA2FB), peak 8 indicates a triantennary glycan (NA3), peak 9 indicates a branching α-1,3-fucosylated triantennary glycan (NA3Fb).
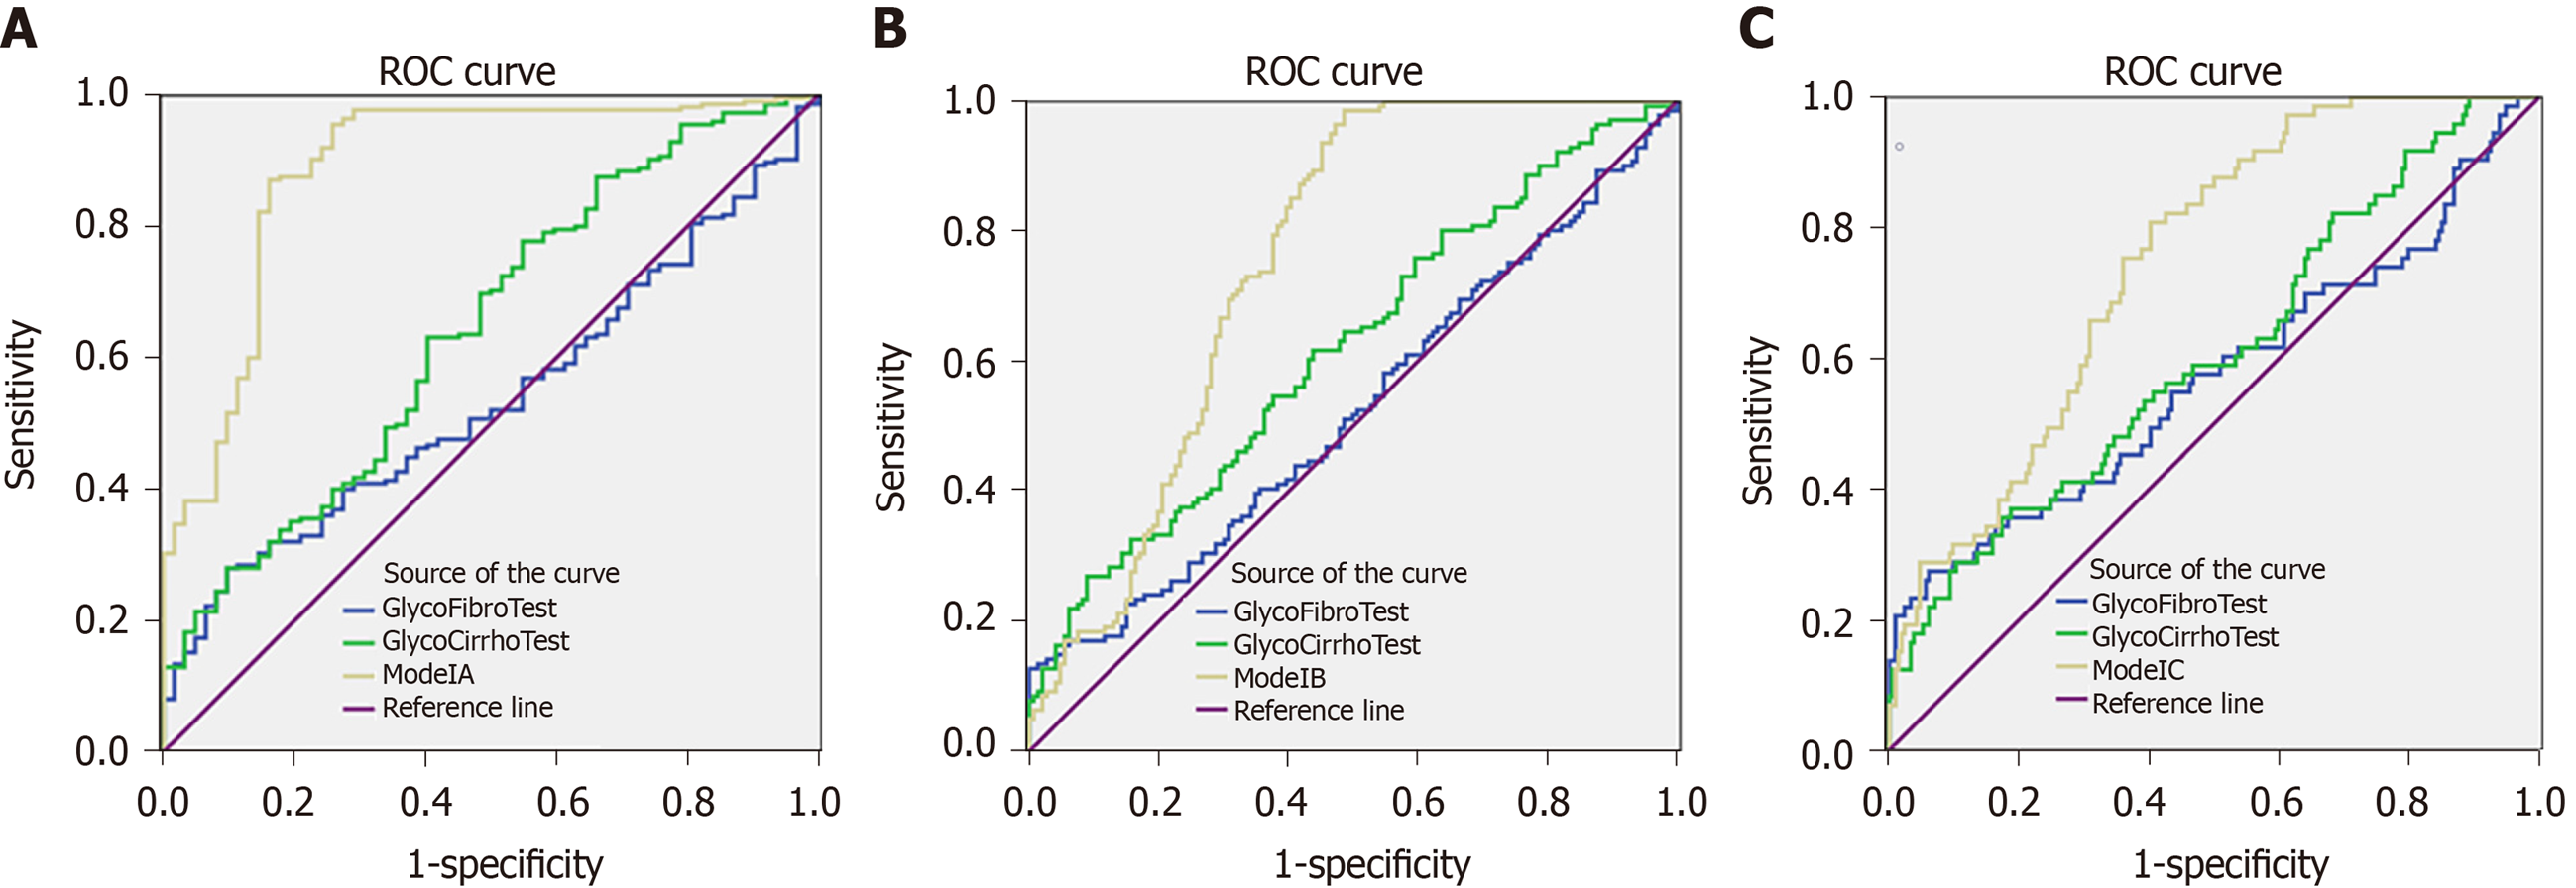
Figure 2 Receiver operating characteristic curve.
A: Receiver operating characteristic (ROC) curve for the prediction of fibrosis F0-F1 from fibrosis F2-F4 in the modeling group. [area under ROC curves (AUROCs): Model A (0.890) > GlycoCirrhoTest (0.644) > GlycoFibroTest (0.538)]; B: ROC curve for the prediction of fibrosis F0-F2 from fibrosis F3-F4. [AUROCs: Model B (0.752) > GlycoCirrhoTest (0.618) > GlycoFibroTest (0.524)]; C: ROC curve for the prediction of fibrosis F0-F3 from fibrosis F4. [AUROCs: Model C (0.747) > GlycoCirrhoTest (0.607) > GlycoFibroTest (0.571)].
- Citation: Cao X, Shang QH, Chi XL, Zhang W, Xiao HM, Sun MM, Chen G, An Y, Lv CL, Wang L, Nan YM, Chen CY, Tan ZN, Liu XE, Zhuang H. Serum N-glycan markers for diagnosing liver fibrosis induced by hepatitis B virus. World J Gastroenterol 2020; 26(10): 1067-1079
- URL: https://www.wjgnet.com/1007-9327/full/v26/i10/1067.htm
- DOI: https://dx.doi.org/10.3748/wjg.v26.i10.1067


