Copyright
©The Author(s) 2019.
World J Gastroenterol. Dec 14, 2019; 25(46): 6713-6727
Published online Dec 14, 2019. doi: 10.3748/wjg.v25.i46.6713
Published online Dec 14, 2019. doi: 10.3748/wjg.v25.i46.6713
Figure 1 Expression of secreted protein acidic and rich in cysteine in gastric cancer cell lines and eight pairs of samples.
A: Specific reverse transcriptase quantitative real-time PCR analyzed for secreted protein acidic and rich in cysteine (SPARC). Glyceraldehyde-3-phosphate dehydrogenase (GAPDH) was used as loading control. Relative SPARC mRNA expression levels were analyzed by densitometry followed by quantitation relative to GAPDH; B: Western blot analysis used a rabbit monoclonal SPARC antibody (43 kDa), GAPDH was used as control (34 kDa); C: Western blot analyzed SPARC gene expression in eight cases of gastric cancer samples, and GAPDH was used as internal reference. Expression level data are presented as mean ± SE. aP < 0.05 was considered statistically significant. SPARC: Secreted protein acidic and rich in cysteine; GAPDH: Glyceraldehyde-3-phosphate dehydrogenase; N: Non-tumor tissue; T: Tumor tissue.
Figure 2 Online prediction software, Methprimer, confirmed the existence of cytosines preceding guanosines island in the promoter region of SPARC gene.
The green part represents the area where the cytosines preceding guanosine island is located. CpG: Cytosines preceding guanosine.
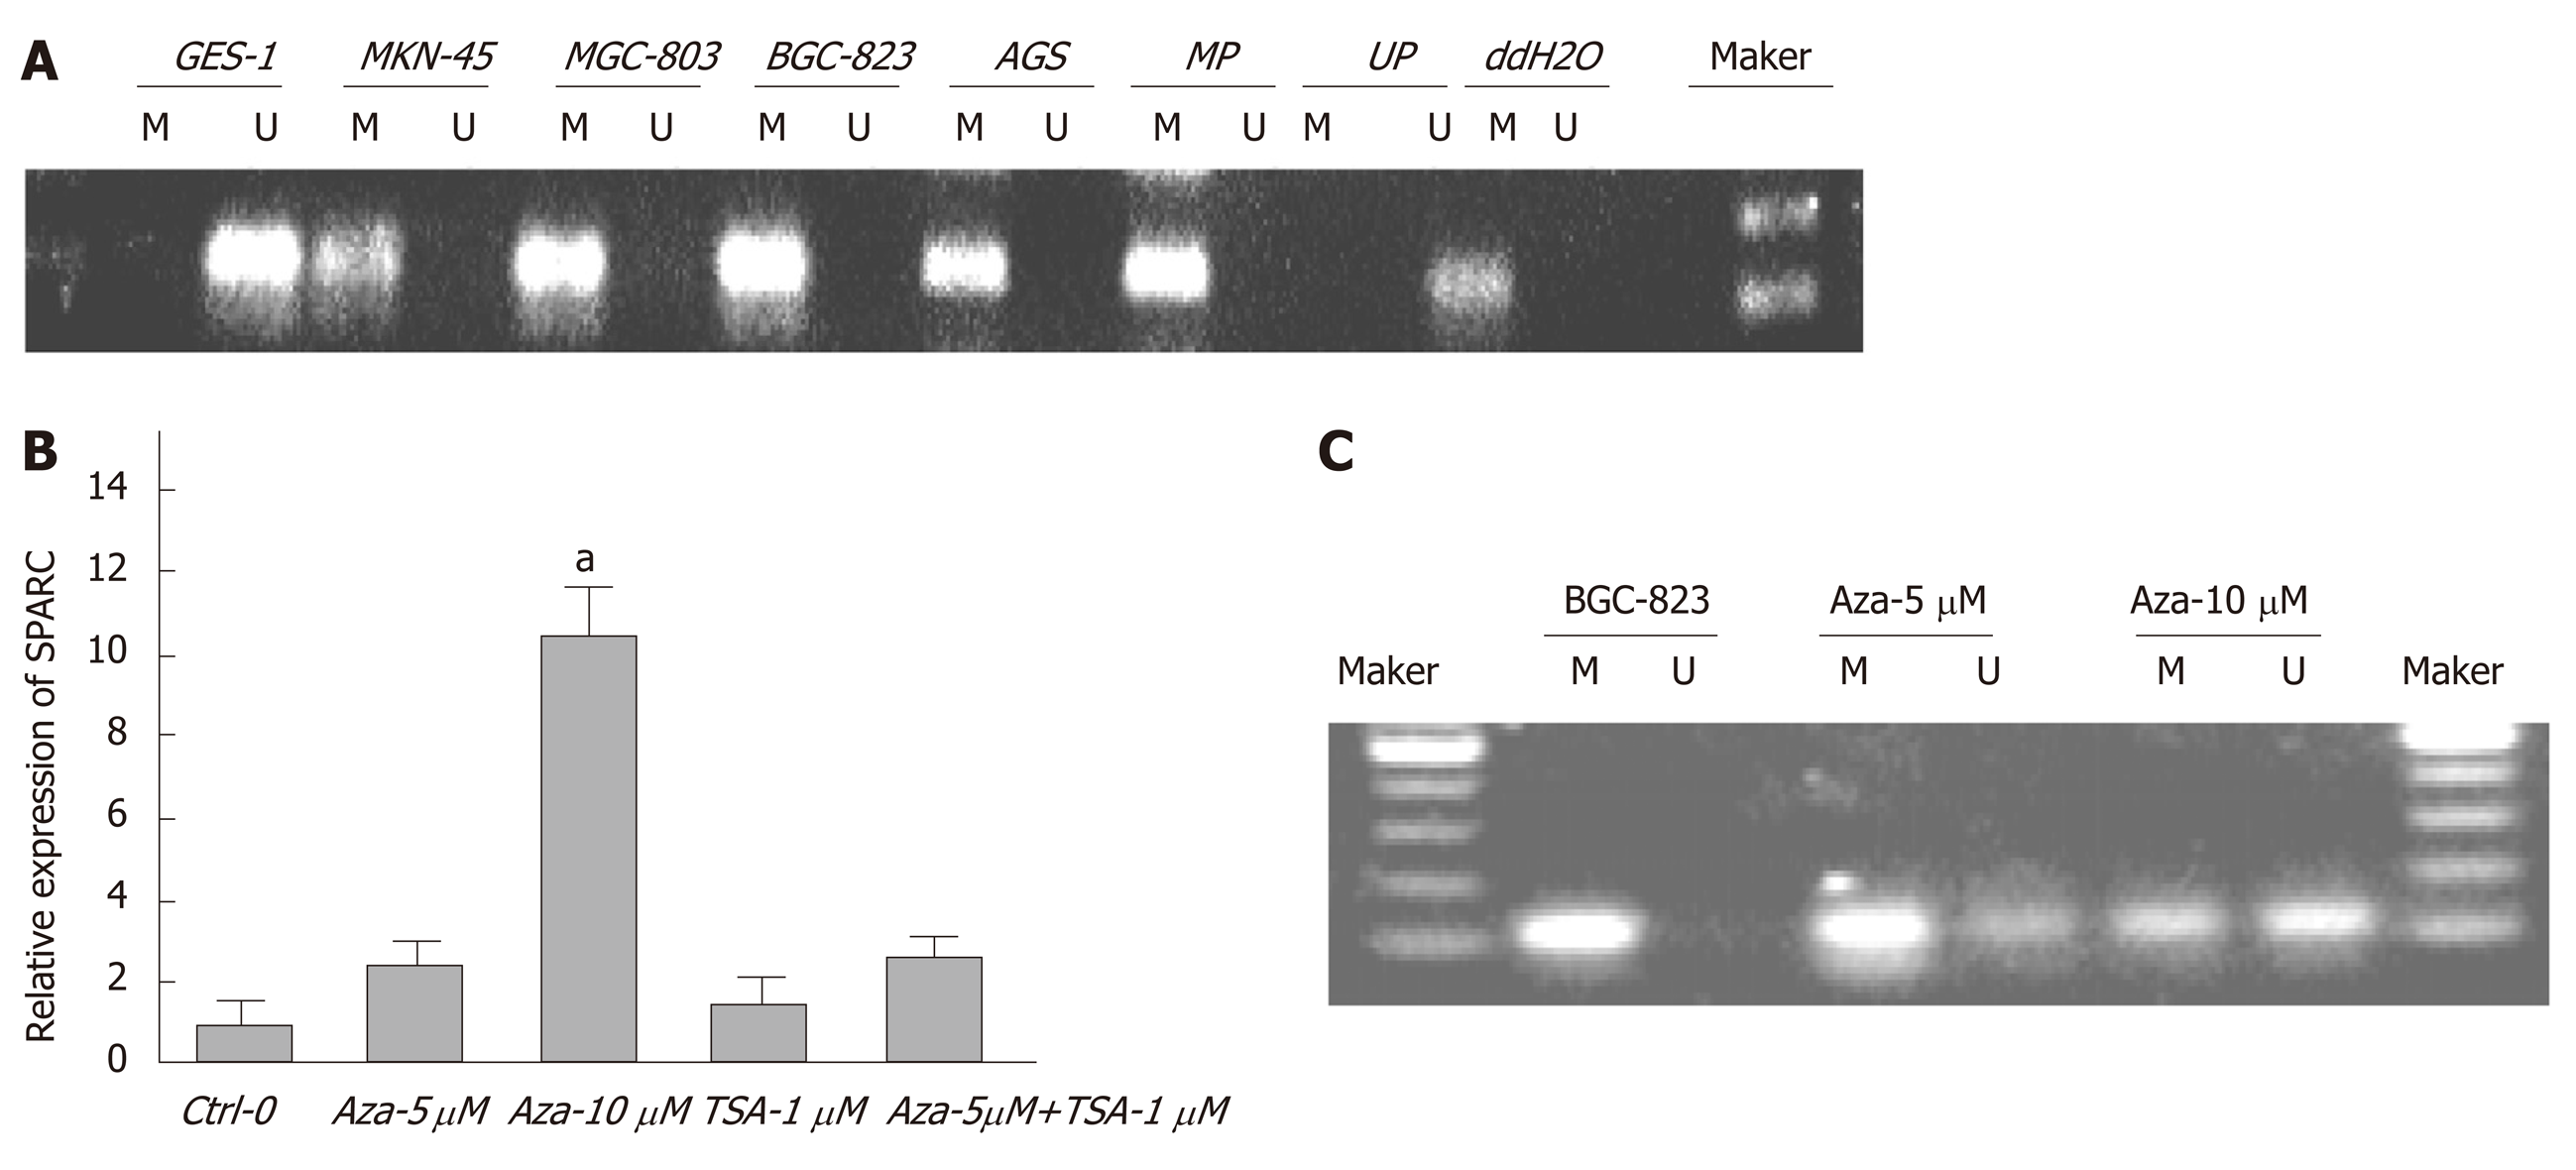
Figure 3 Hypermethylation status of secreted protein acidic and rich in cysteine promoter in gastric cancer cells and the effects of drug intervention.
A: Representative statistics of methylation-specific polymerase chain reaction (PCR) in five cell lines. PCR visualized in 2% agarose gels; B: Relative SPARC mRNA expression levels of BGC-823 cells after drug intervention were analyzed by quantitative real-time PCR followed by quantitation relative to glyceraldehyde-3-phosphate dehydrogenase; C: Methylation status of promoter region after drug intervention. Data are expressed as mean ± standard deviation (Figure 3B). aP < 0.05 was considered statistically significant. SPARC: Secreted protein acidic and rich in cysteine; M: Methylated amplified fragment; U: Unmethylated amplified fragment; MP: Methylated positive control; UP: Unmethylated positive control; ddH2O: Blank control.
Figure 4 Methylation status of promoter region of secreted protein acidic and rich in cysteine in four matched gastric cancer tissues.
T: Tumor tissue; N: Non-tumor tissue; M: Methylated amplified fragment; U: Unmethylated amplified fragment.
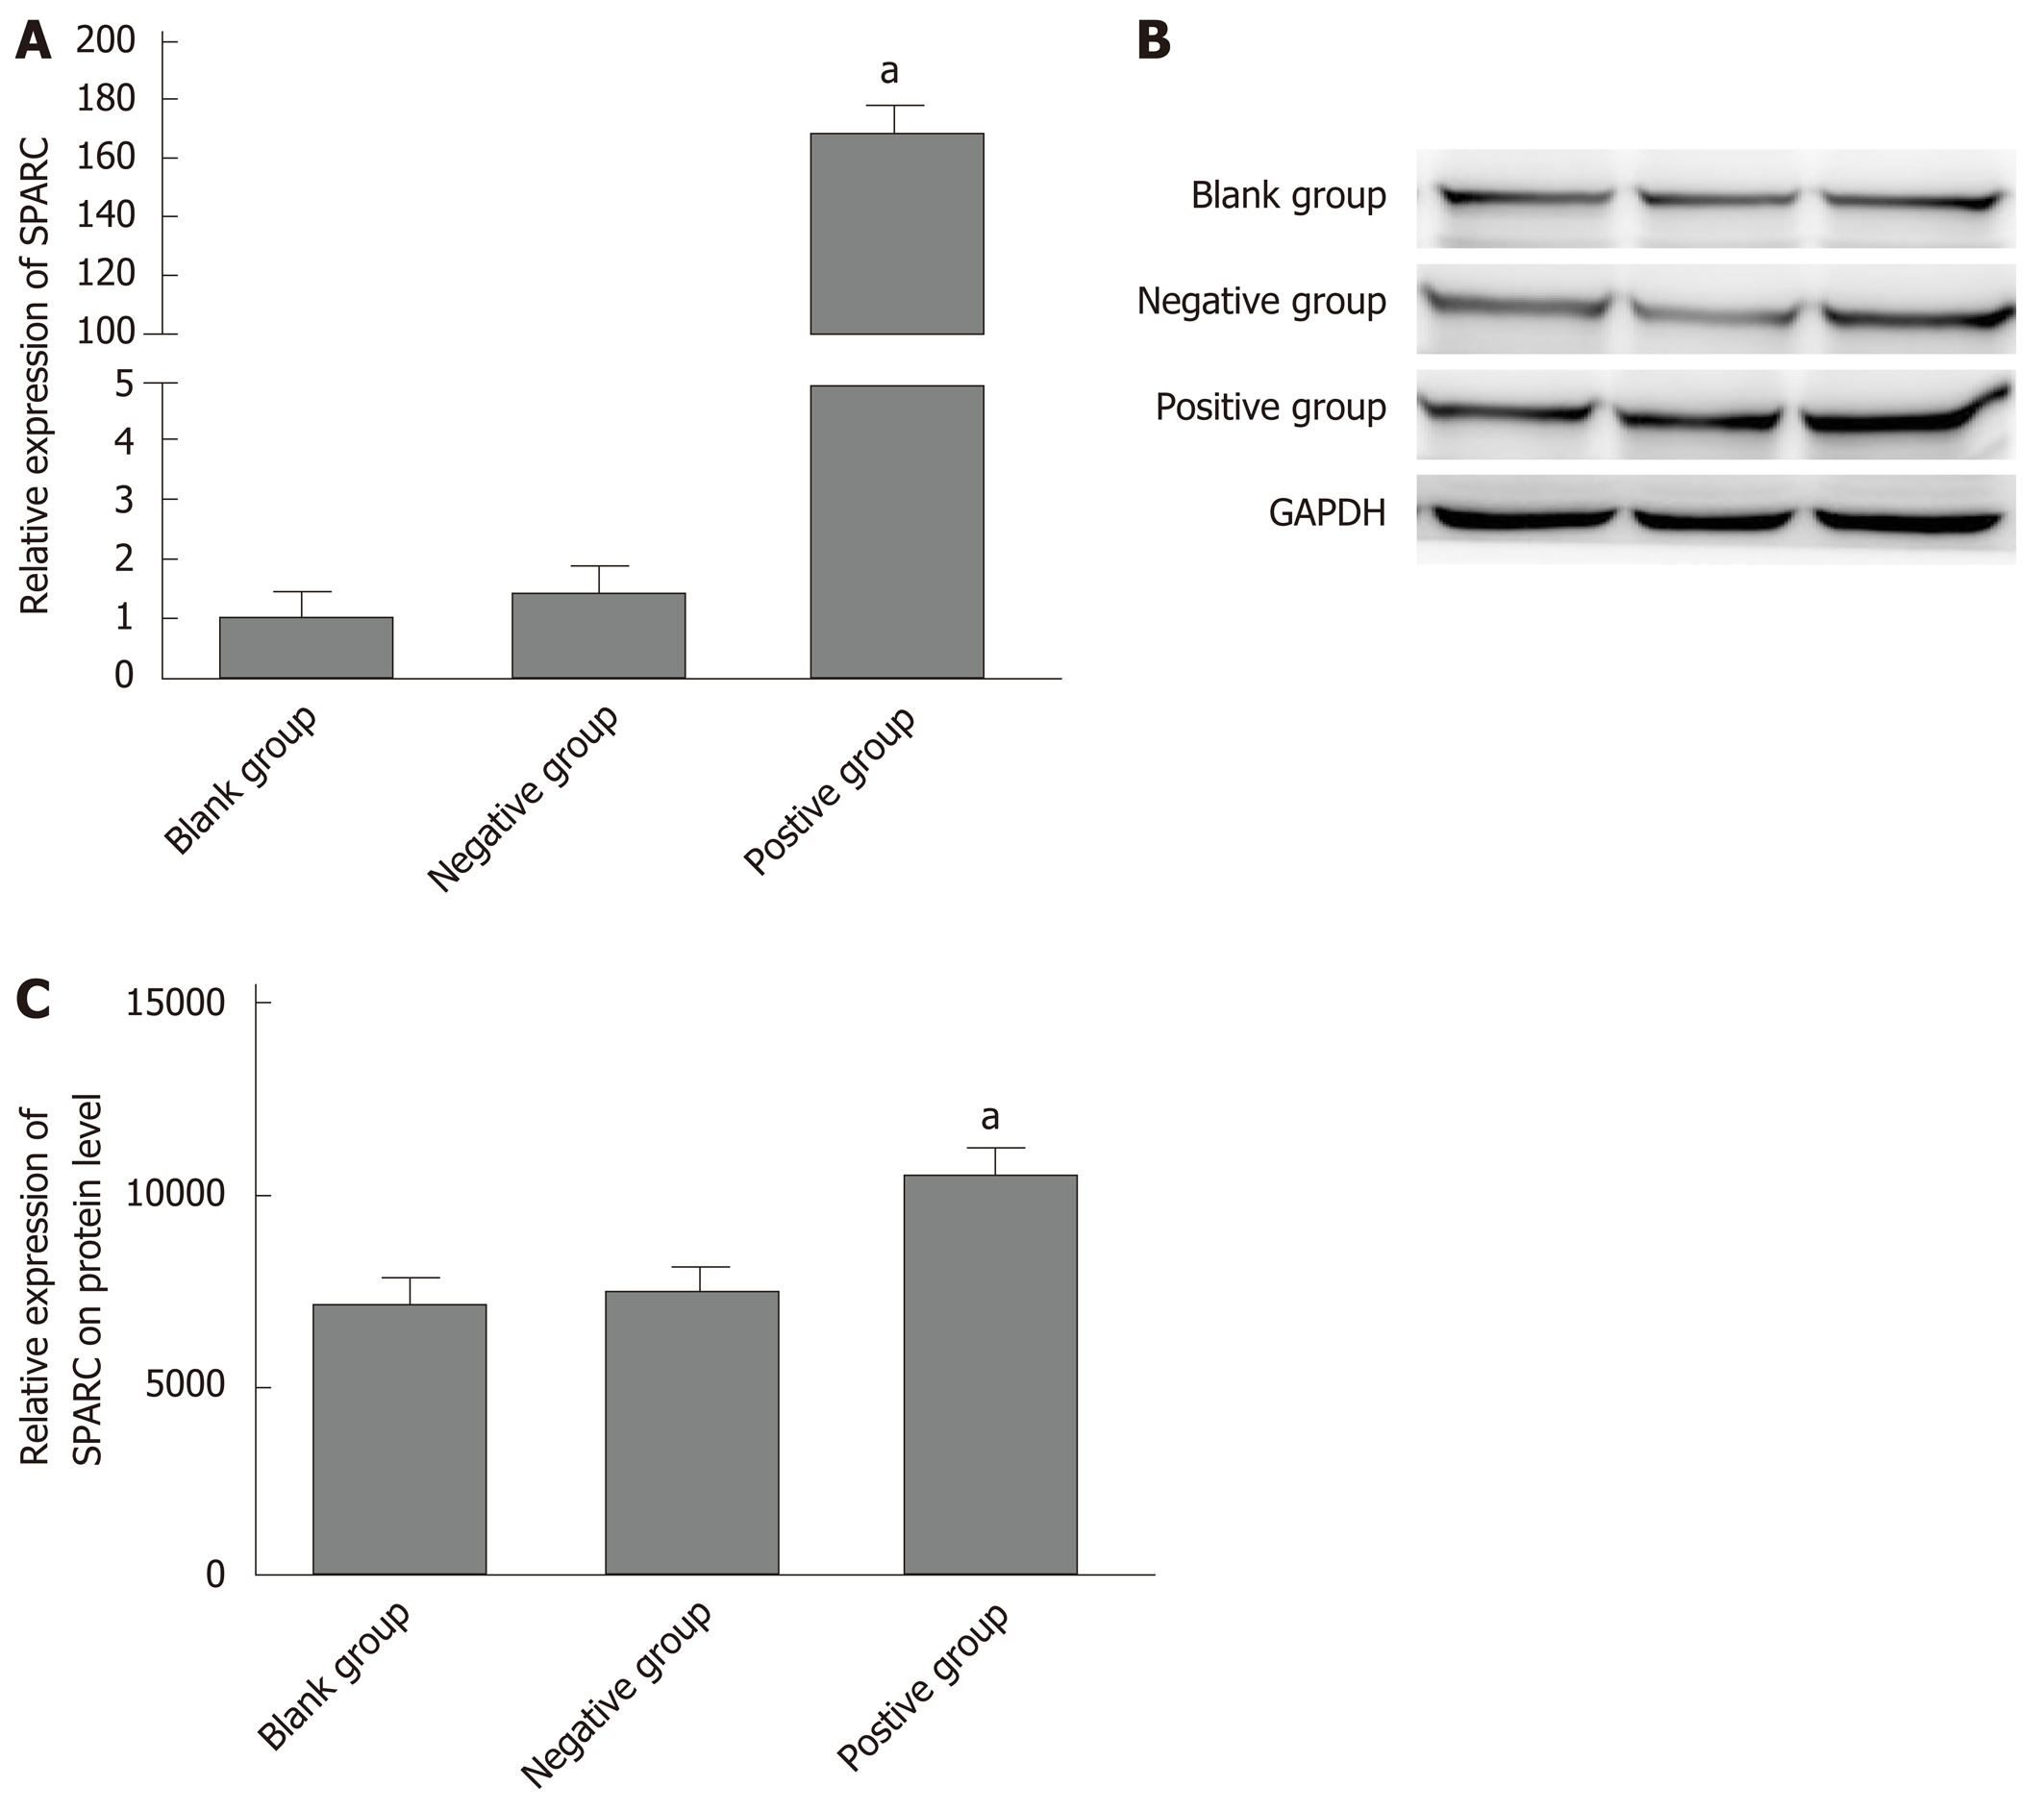
Figure 5 Transfection efficiency of secreted protein acidic and rich in cysteine in gastric cancer cell lines BGC-823.
A: Relative secreted protein acidic and rich in cysteine (SPARC) mRNA expression levels were analyzed after being transfected; B: Western blot analyzed SPARC gene protein expression after being transfected; C: Glyceraldehyde-3-phosphate dehydrogenase was used as internal reference. Data are presented as mean ± SE. aP < 0.05 was considered statistically significant. SPARC: Secreted protein acidic and rich in cysteine; GAPDH: Glyceraldehyde-3-phosphate dehydrogenase.
Figure 6 Effects of secreted protein acidic and rich in cysteine on cell proliferation, migration, and invasion.
A: Cell proliferation rates were determined after 48 hr in complete medium by the cell counting kit-8 assay; B: The left half data represent that transfection of secreted protein acidic and rich in cysteine into cells could reduce the rate of cell scratch healing; C: Transfected cells were subjected to an assay using a two-chambered invasion apparatus as described in methods, the histogram shows the number of cells penetrating the chambers. Data are presented as mean ± SE. aP < 0.05 was considered statistically significant.
Figure 7 Effects of secreted protein acidic and rich in cysteine on cell cycle in BGC-823 gastric cancer cell line.
Overexpressing of secreted protein acidic and rich in cysteine could change cell cycle distribution in BGC-823 gastric cancer cells at 72 h post-transfection. DNA content was measured using propidium iodide staining on flow cytometry. A: Blank control group; B: Negative control group; C: Positive control group. Data are presented as mean ± SE. aP < 0.05 was considered statistically significant.
Figure 8 Secreted protein acidic and rich in cysteine induces apoptosis in BGC-823.
For flow cytometric analysis, cells were stained with annexin V fluorescein isothiocyanate and propidium iodide. Values in histogram show increasing secreted protein acidic and rich in cysteine (SPARC) expression increased apoptosis in BGC-823 compared with negative control. A: Blank control group; B: Negative control group; C: Positive control group. Data are presented as mean ± SE. aP < 0.05 was considered statistically significant.
- Citation: Shao S, Zhou NM, Dai DQ. Aberrant methylation of secreted protein acidic and rich in cysteine gene and its significance in gastric cancer. World J Gastroenterol 2019; 25(46): 6713-6727
- URL: https://www.wjgnet.com/1007-9327/full/v25/i46/6713.htm
- DOI: https://dx.doi.org/10.3748/wjg.v25.i46.6713


