Copyright
©The Author(s) 2019.
World J Gastroenterol. Nov 21, 2019; 25(43): 6404-6415
Published online Nov 21, 2019. doi: 10.3748/wjg.v25.i43.6404
Published online Nov 21, 2019. doi: 10.3748/wjg.v25.i43.6404
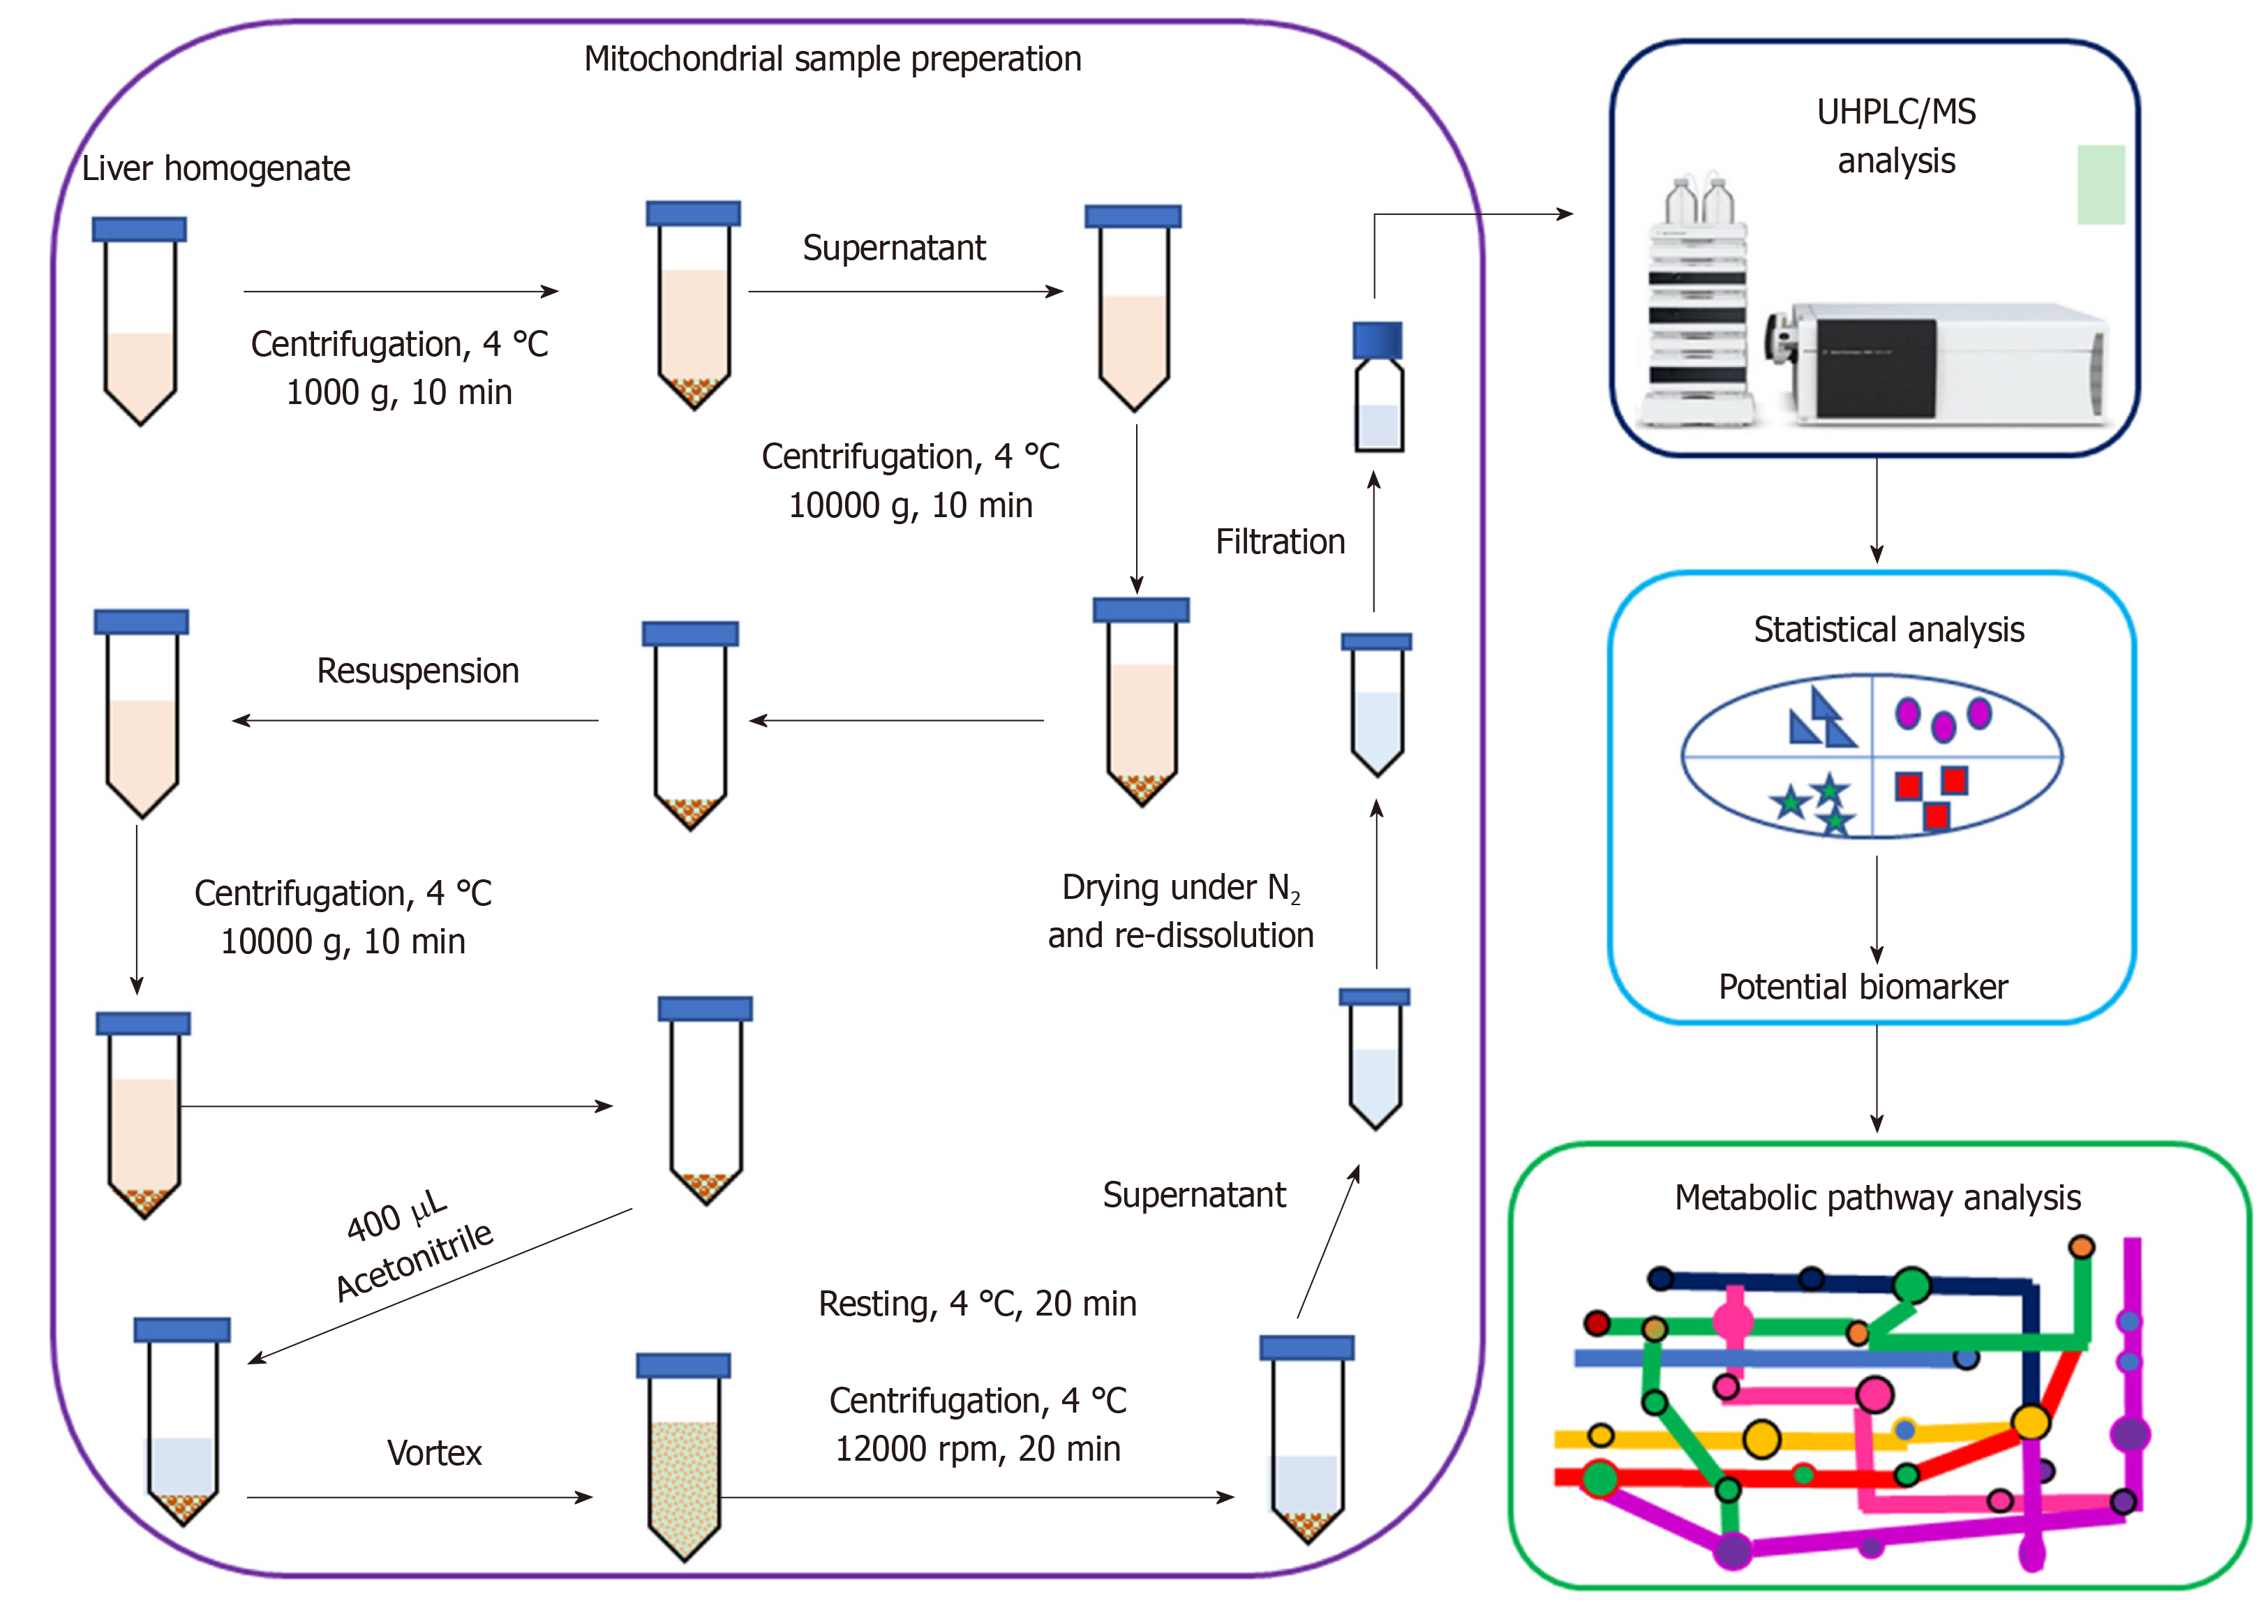
Figure 1 The workflow of the integrated mitochondrial metabolomic method based on ultra-high performance liquid chromatography/mass spectrometry analysis of liver mitochondria.
UHPLC/MS: Ultra-high performance liquid chromatography/mass spectrometry.
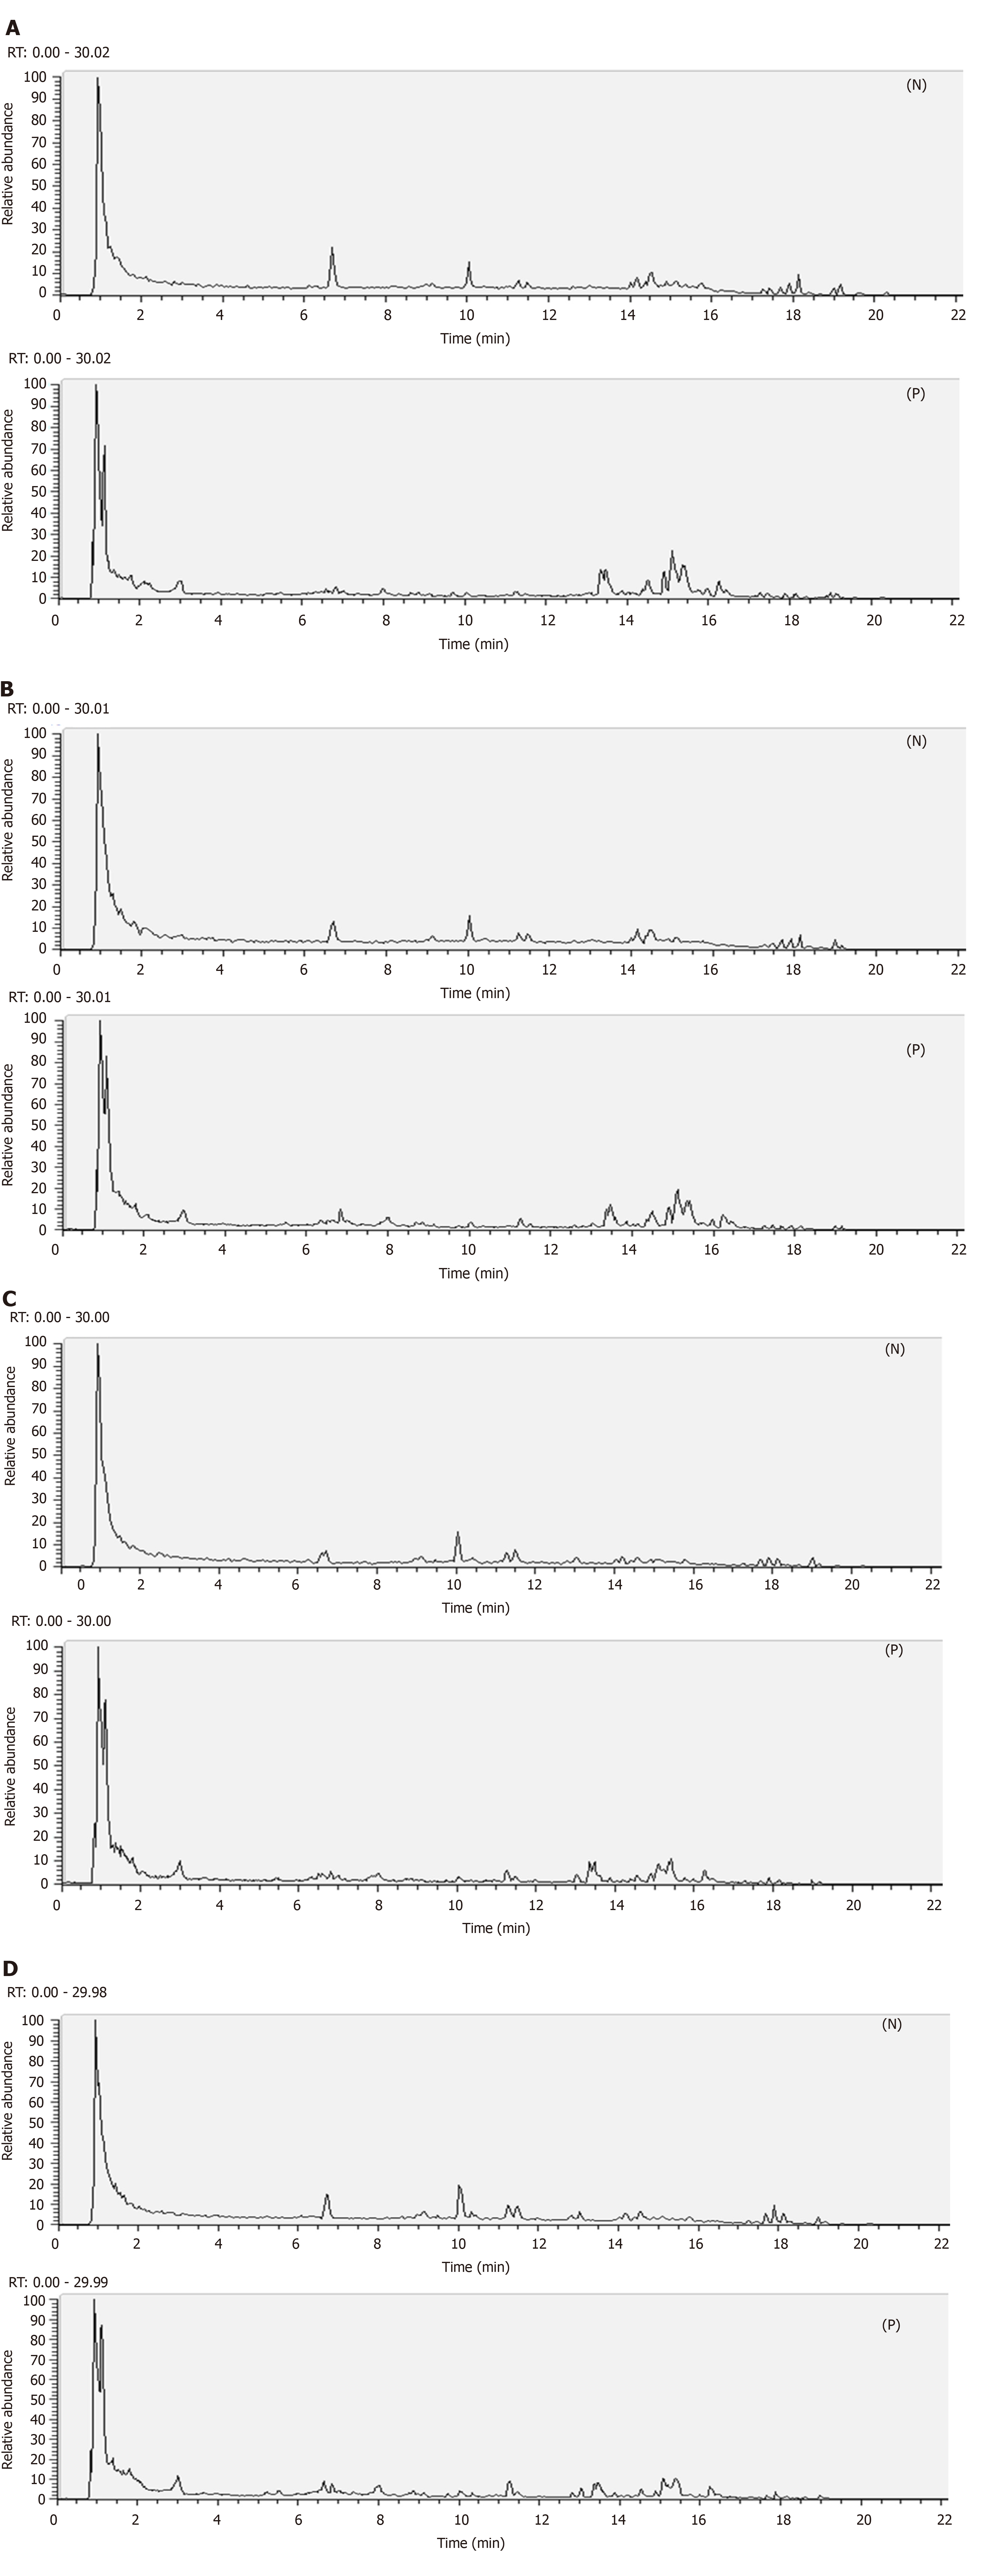
Figure 2 Representative total ion current profiles of the mitochondrial samples in the negative and positive ion mode.
Significant differences were observed in peak number and intensity between the four groups, indicating different metabolomic states in the different groups. A: Control group; B: Model group; C: Polygonatum kingianum group; D: Simvastatin group; N: Negative; P: Positive.
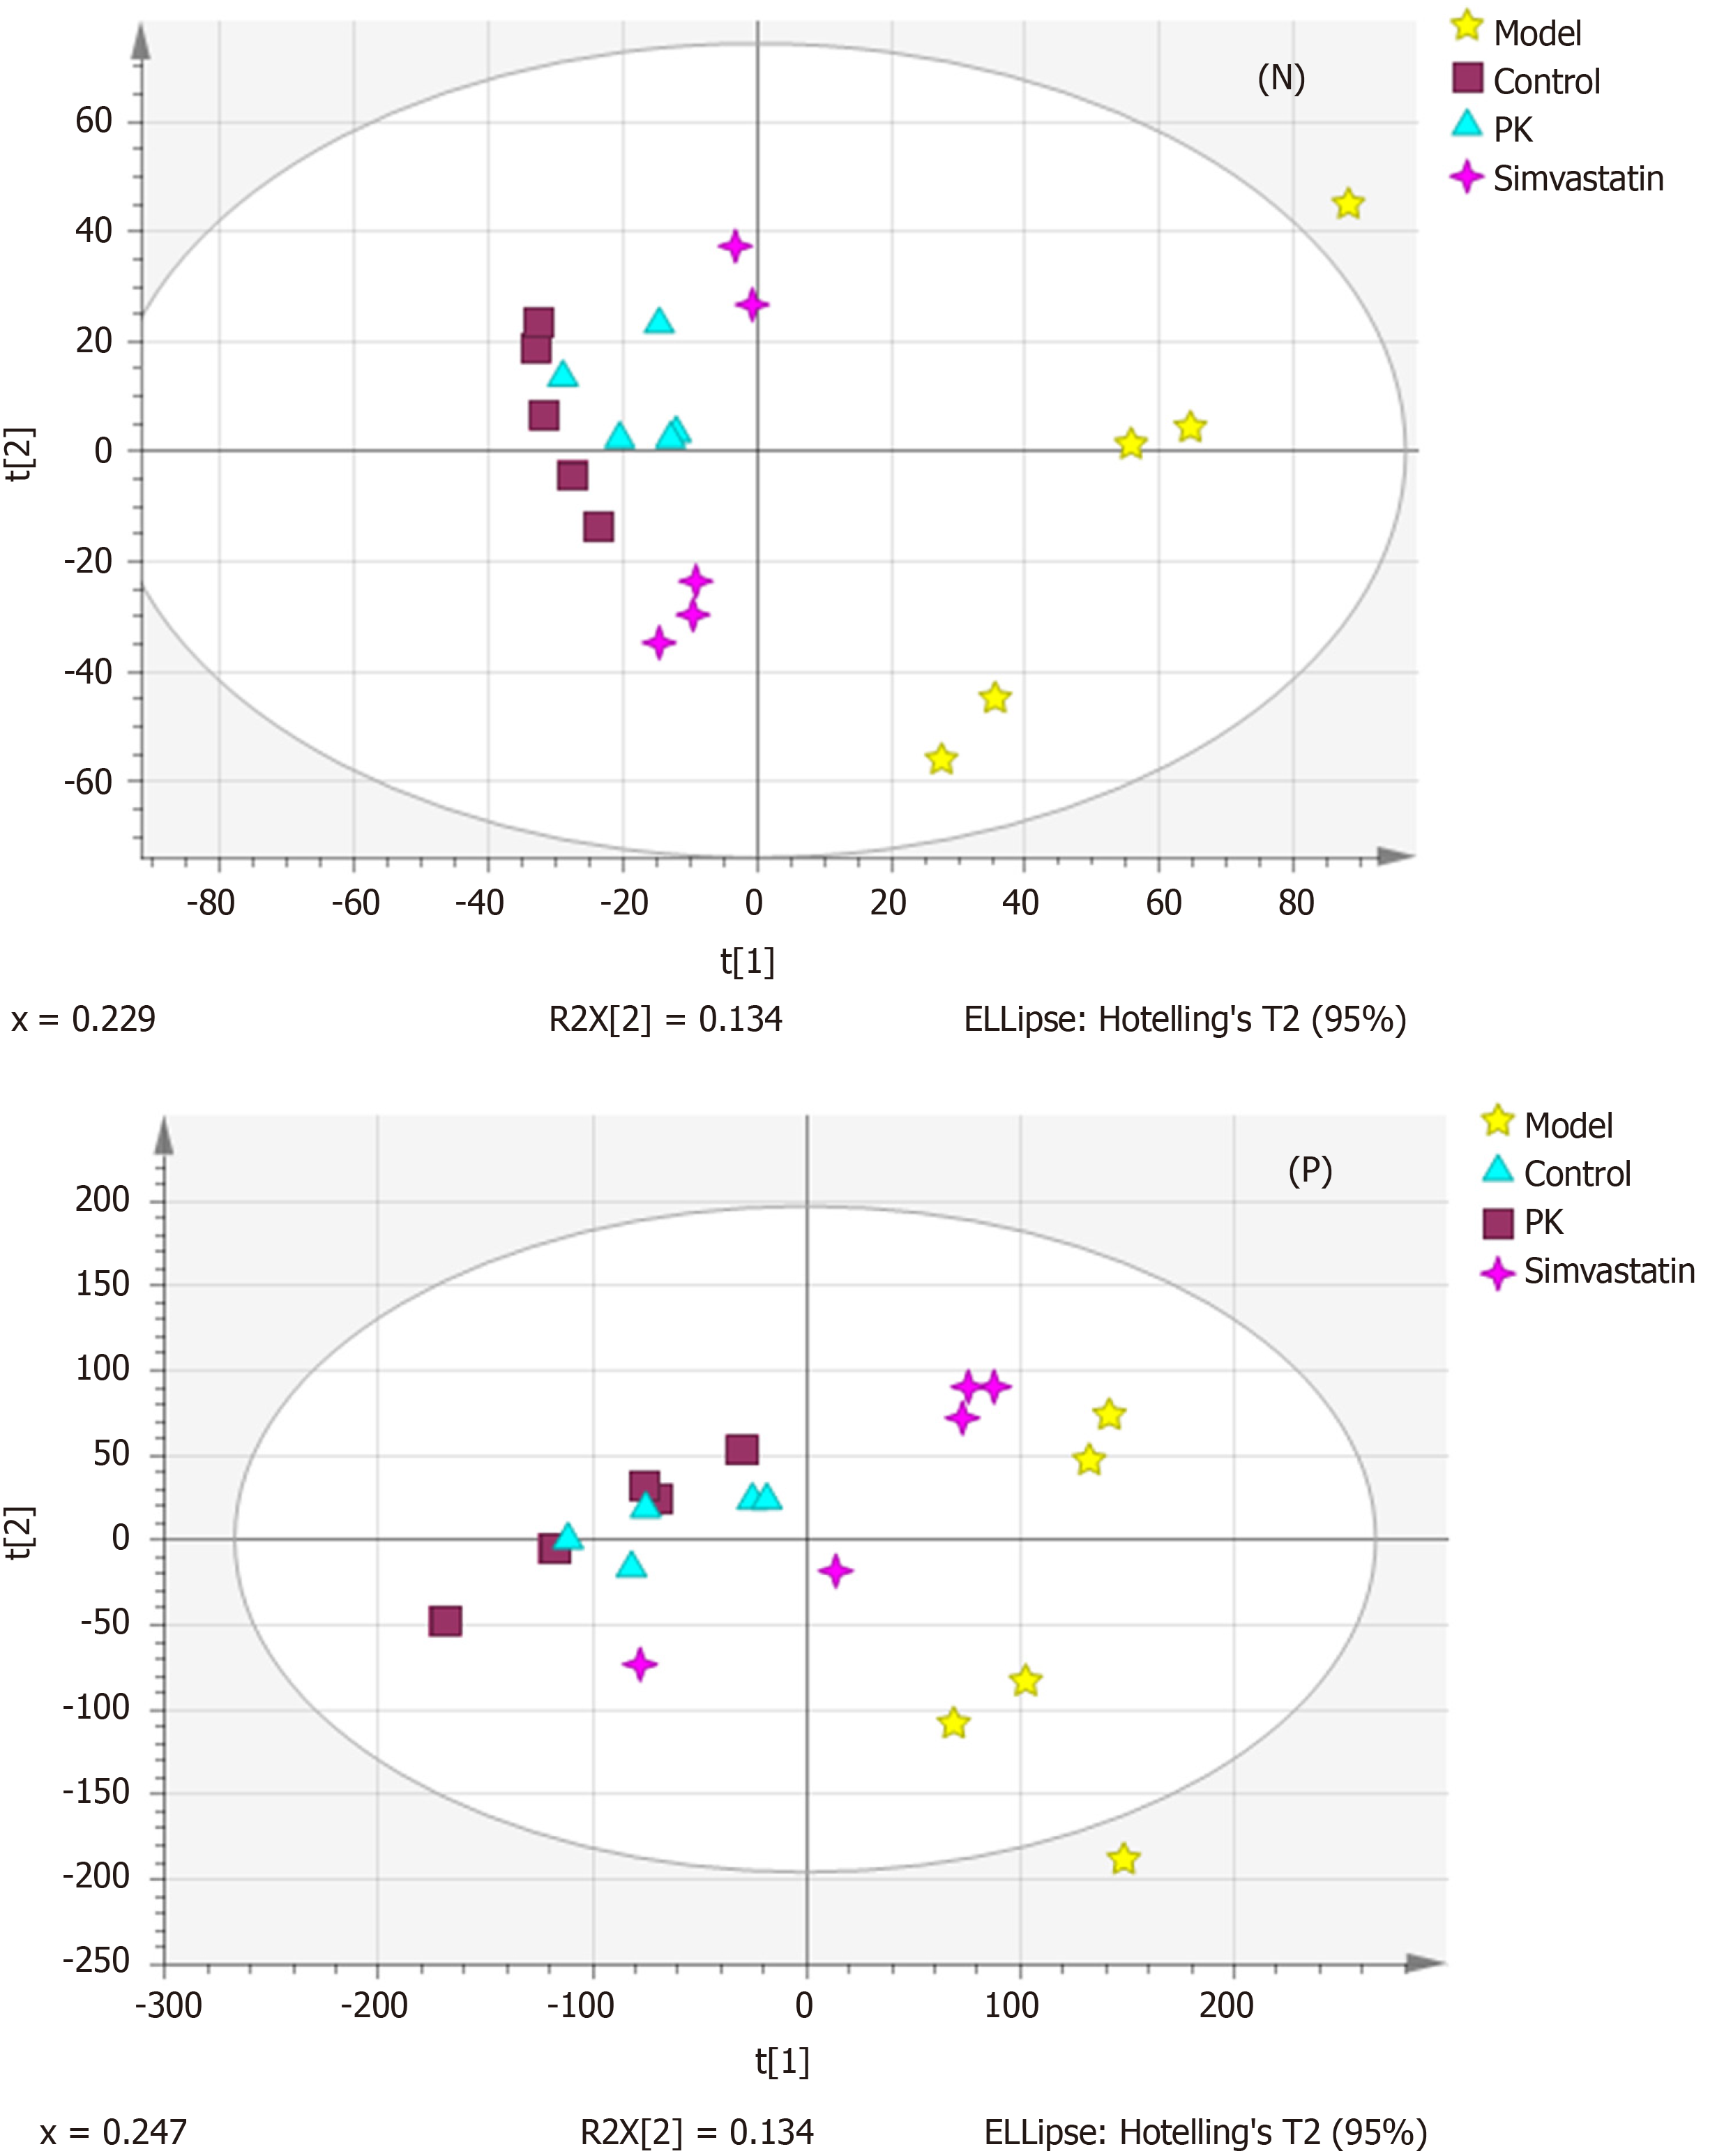
Figure 3 Principal components analysis score plots of the mitochondrial samples in the negative and positive ion mode.
Although the significant differences were noticed among the sample sets within the same group, the four groups were almost separated, indicating significant differences in the metabolic state between them. PK: Polygonatum kingianum; N: Negative; P: Positive.
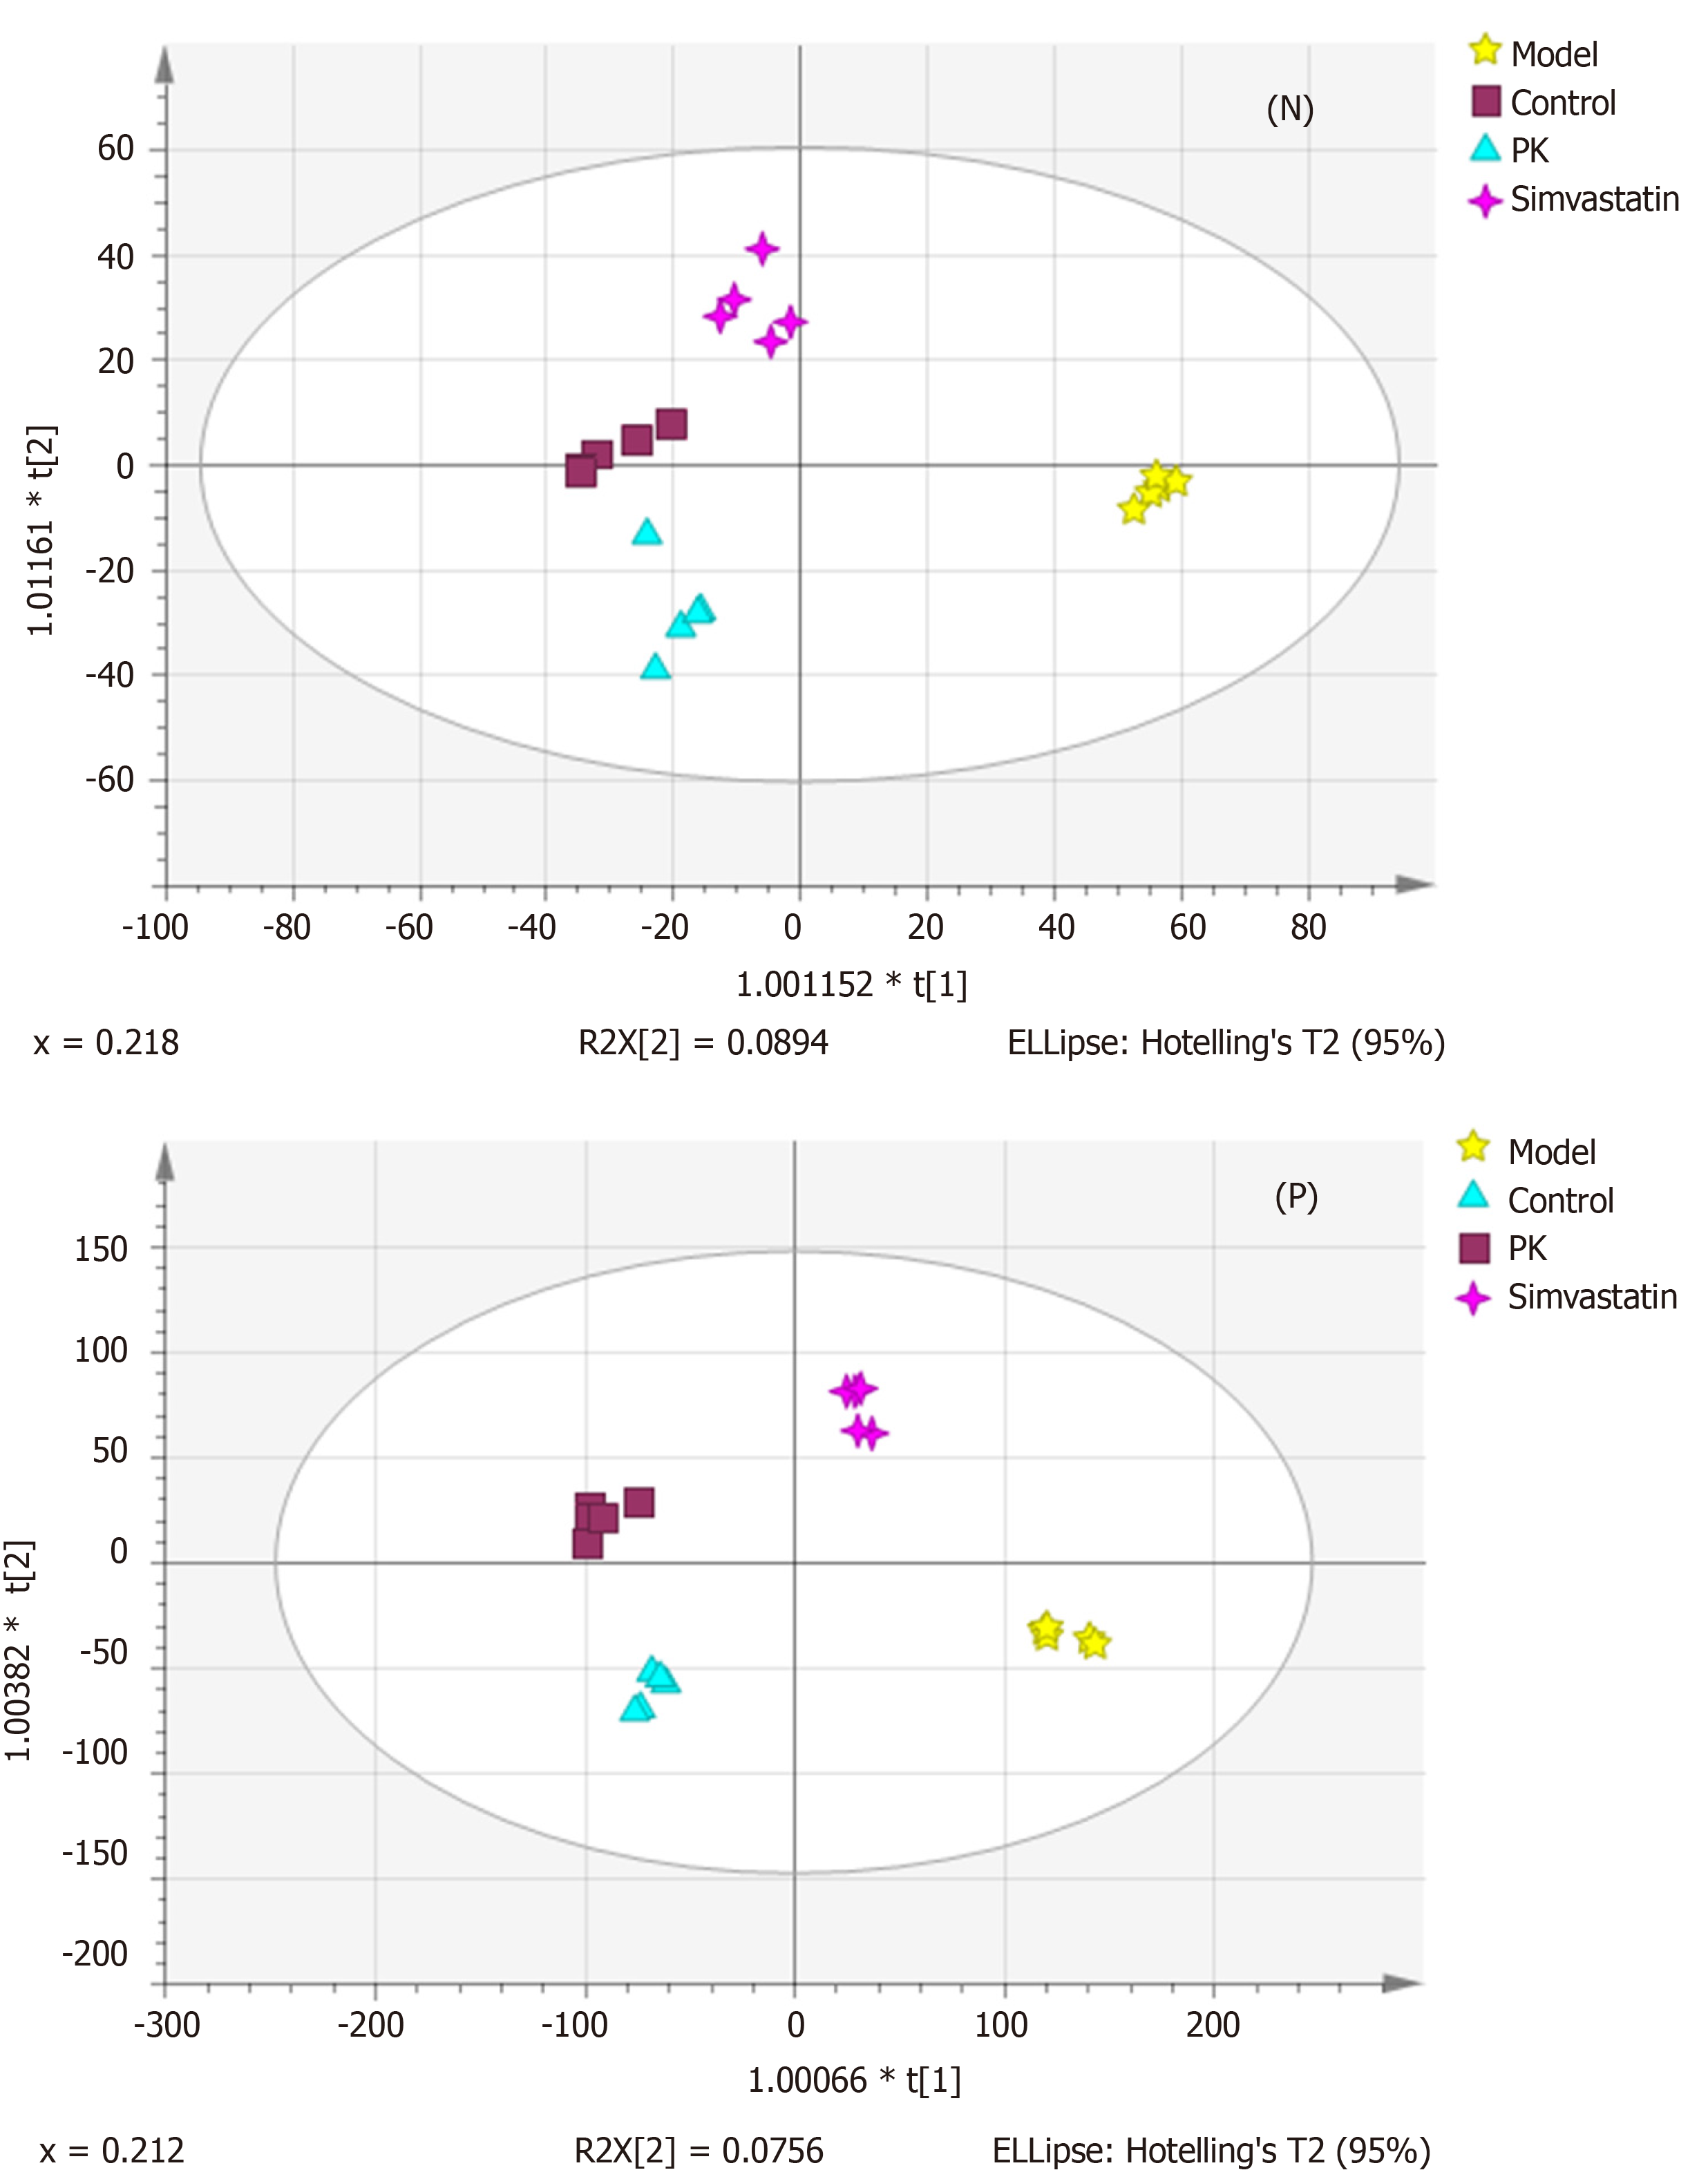
Figure 4 Orthogonal partial least squares discriminant analysis score plots of the mitochondrial samples in the negative and positive ion mode.
The four groups were significantly separated, suggesting remarkable differences in the metabolic state between them. PK: Polygonatum kingianum; N: Negative; P: Positive.
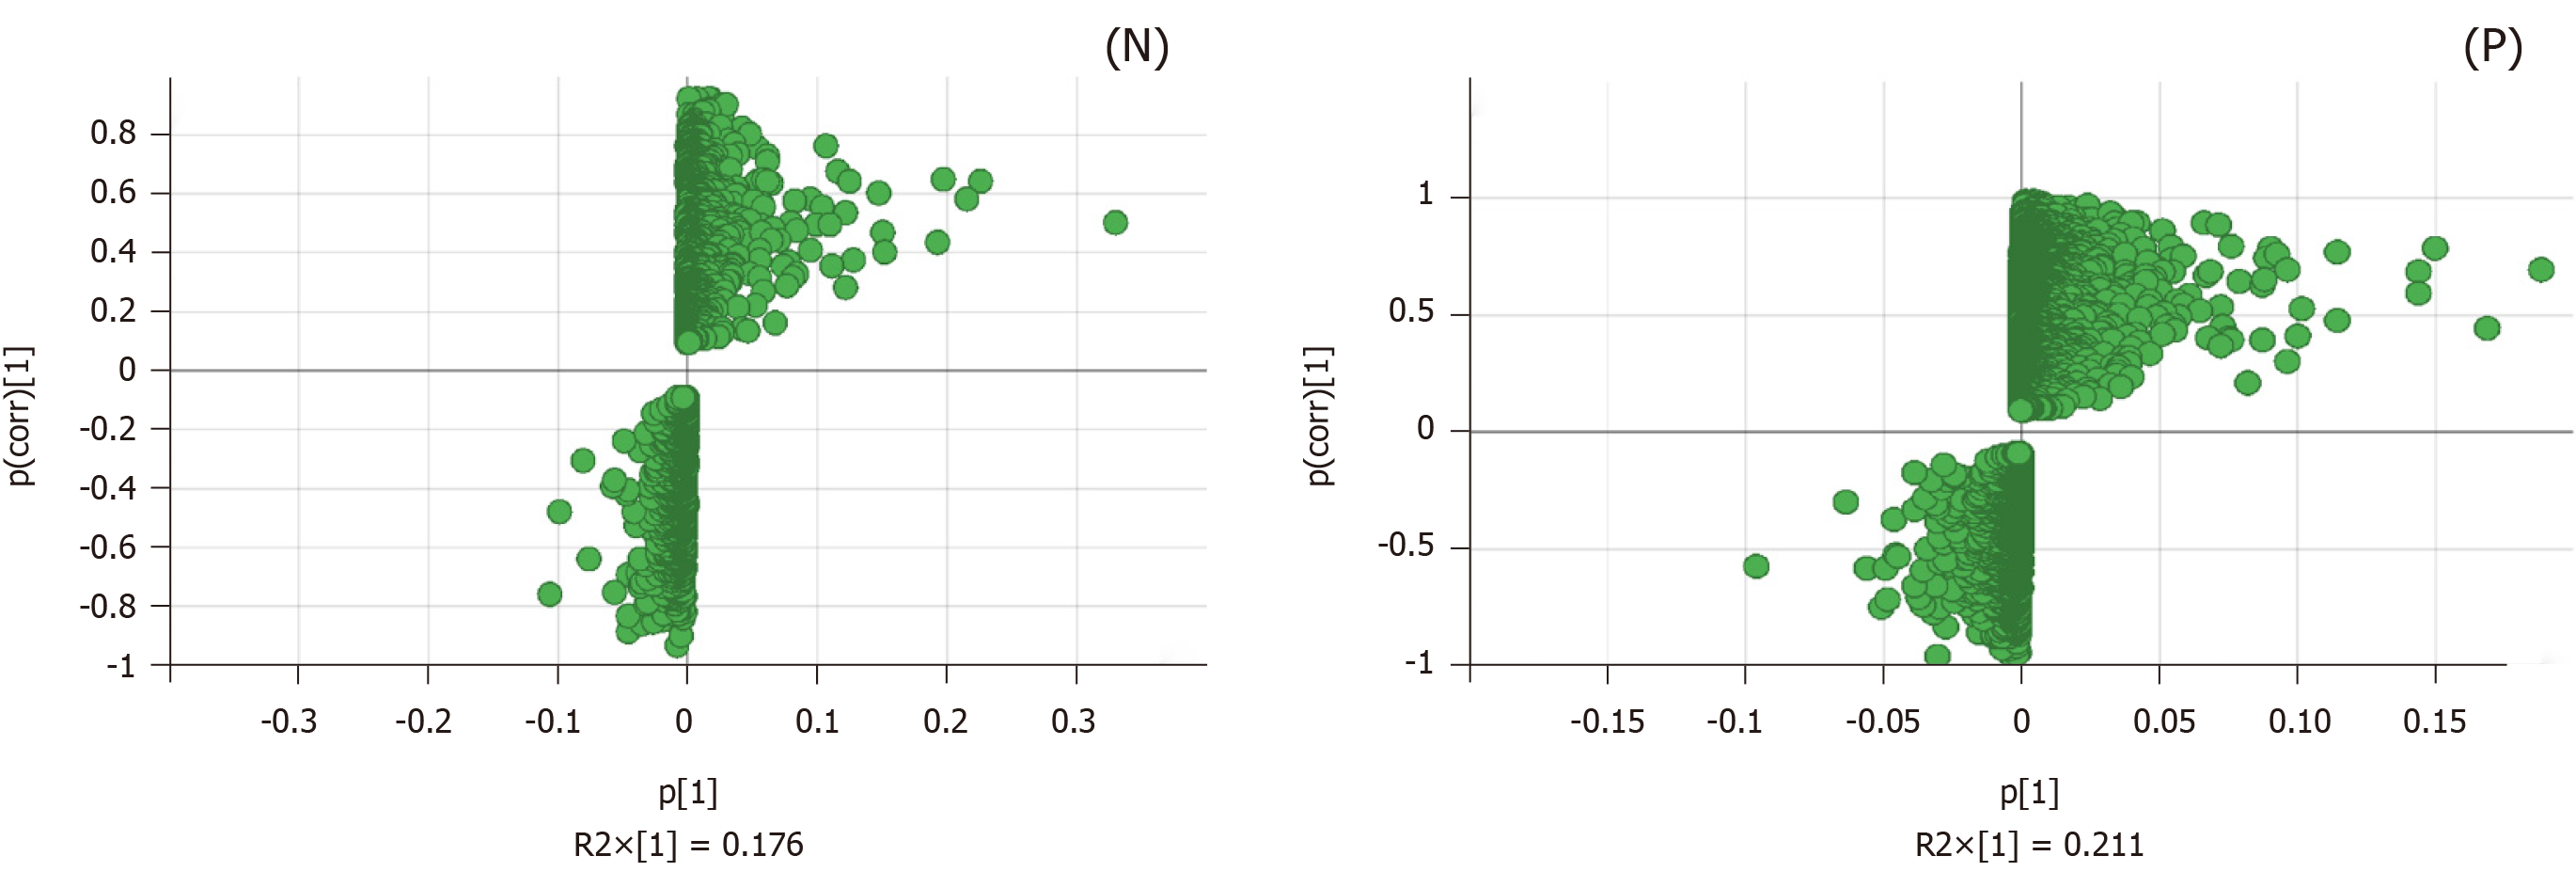
Figure 5 S-plot loading diagram of the model and Polygonatum kingianum groups’ mitochondrial samples in the negative and positive ion mode.
Each point represents a variable that shows the biomarker that caused the difference between the model and Polygonatum kingianum groups. N: Negative; P: Positive.
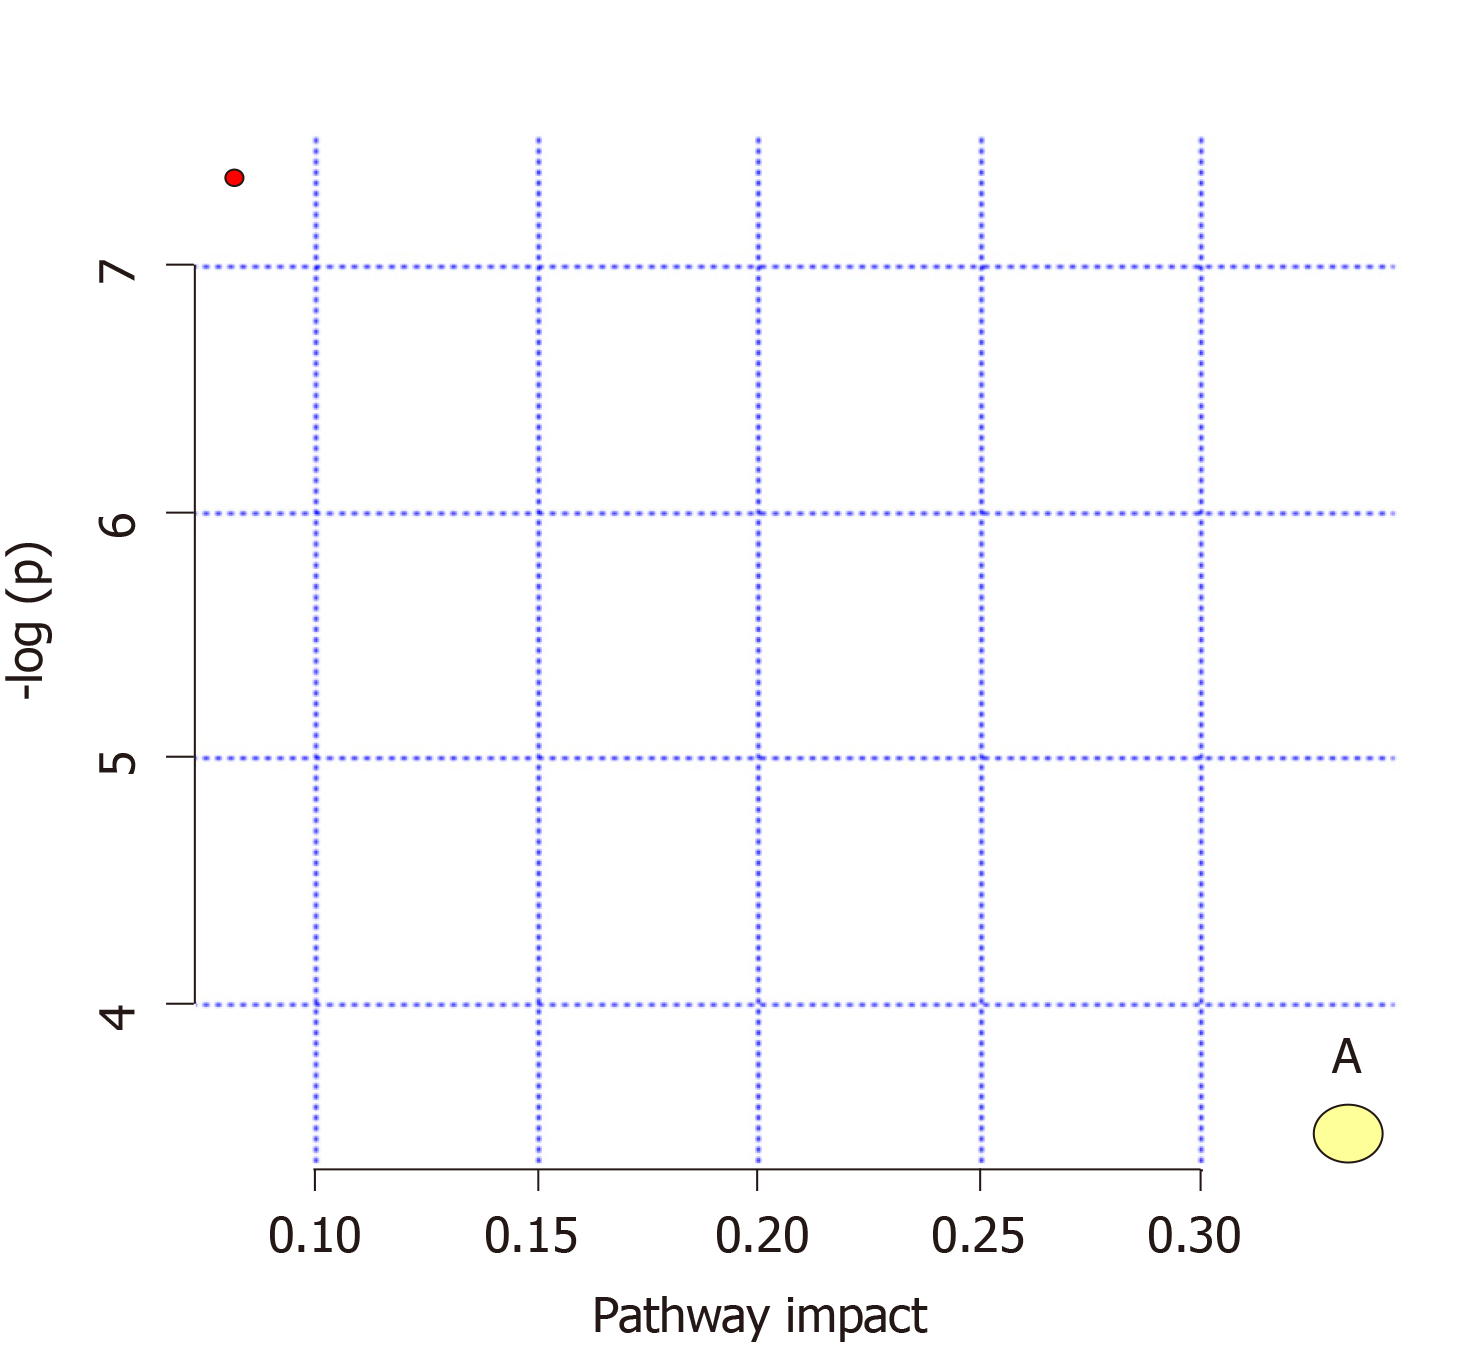
Figure 6 Analysis of metabolic pathways of the mitochondrial samples.
A: Riboflavin metabolism.
- Citation: Yang XX, Wei JD, Mu JK, Liu X, Li FJ, Li YQ, Gu W, Li JP, Yu J. Mitochondrial metabolomic profiling for elucidating the alleviating potential of Polygonatum kingianum against high-fat diet-induced nonalcoholic fatty liver disease. World J Gastroenterol 2019; 25(43): 6404-6415
- URL: https://www.wjgnet.com/1007-9327/full/v25/i43/6404.htm
- DOI: https://dx.doi.org/10.3748/wjg.v25.i43.6404


