Copyright
©The Author(s) 2019.
World J Gastroenterol. Nov 21, 2019; 25(43): 6386-6403
Published online Nov 21, 2019. doi: 10.3748/wjg.v25.i43.6386
Published online Nov 21, 2019. doi: 10.3748/wjg.v25.i43.6386
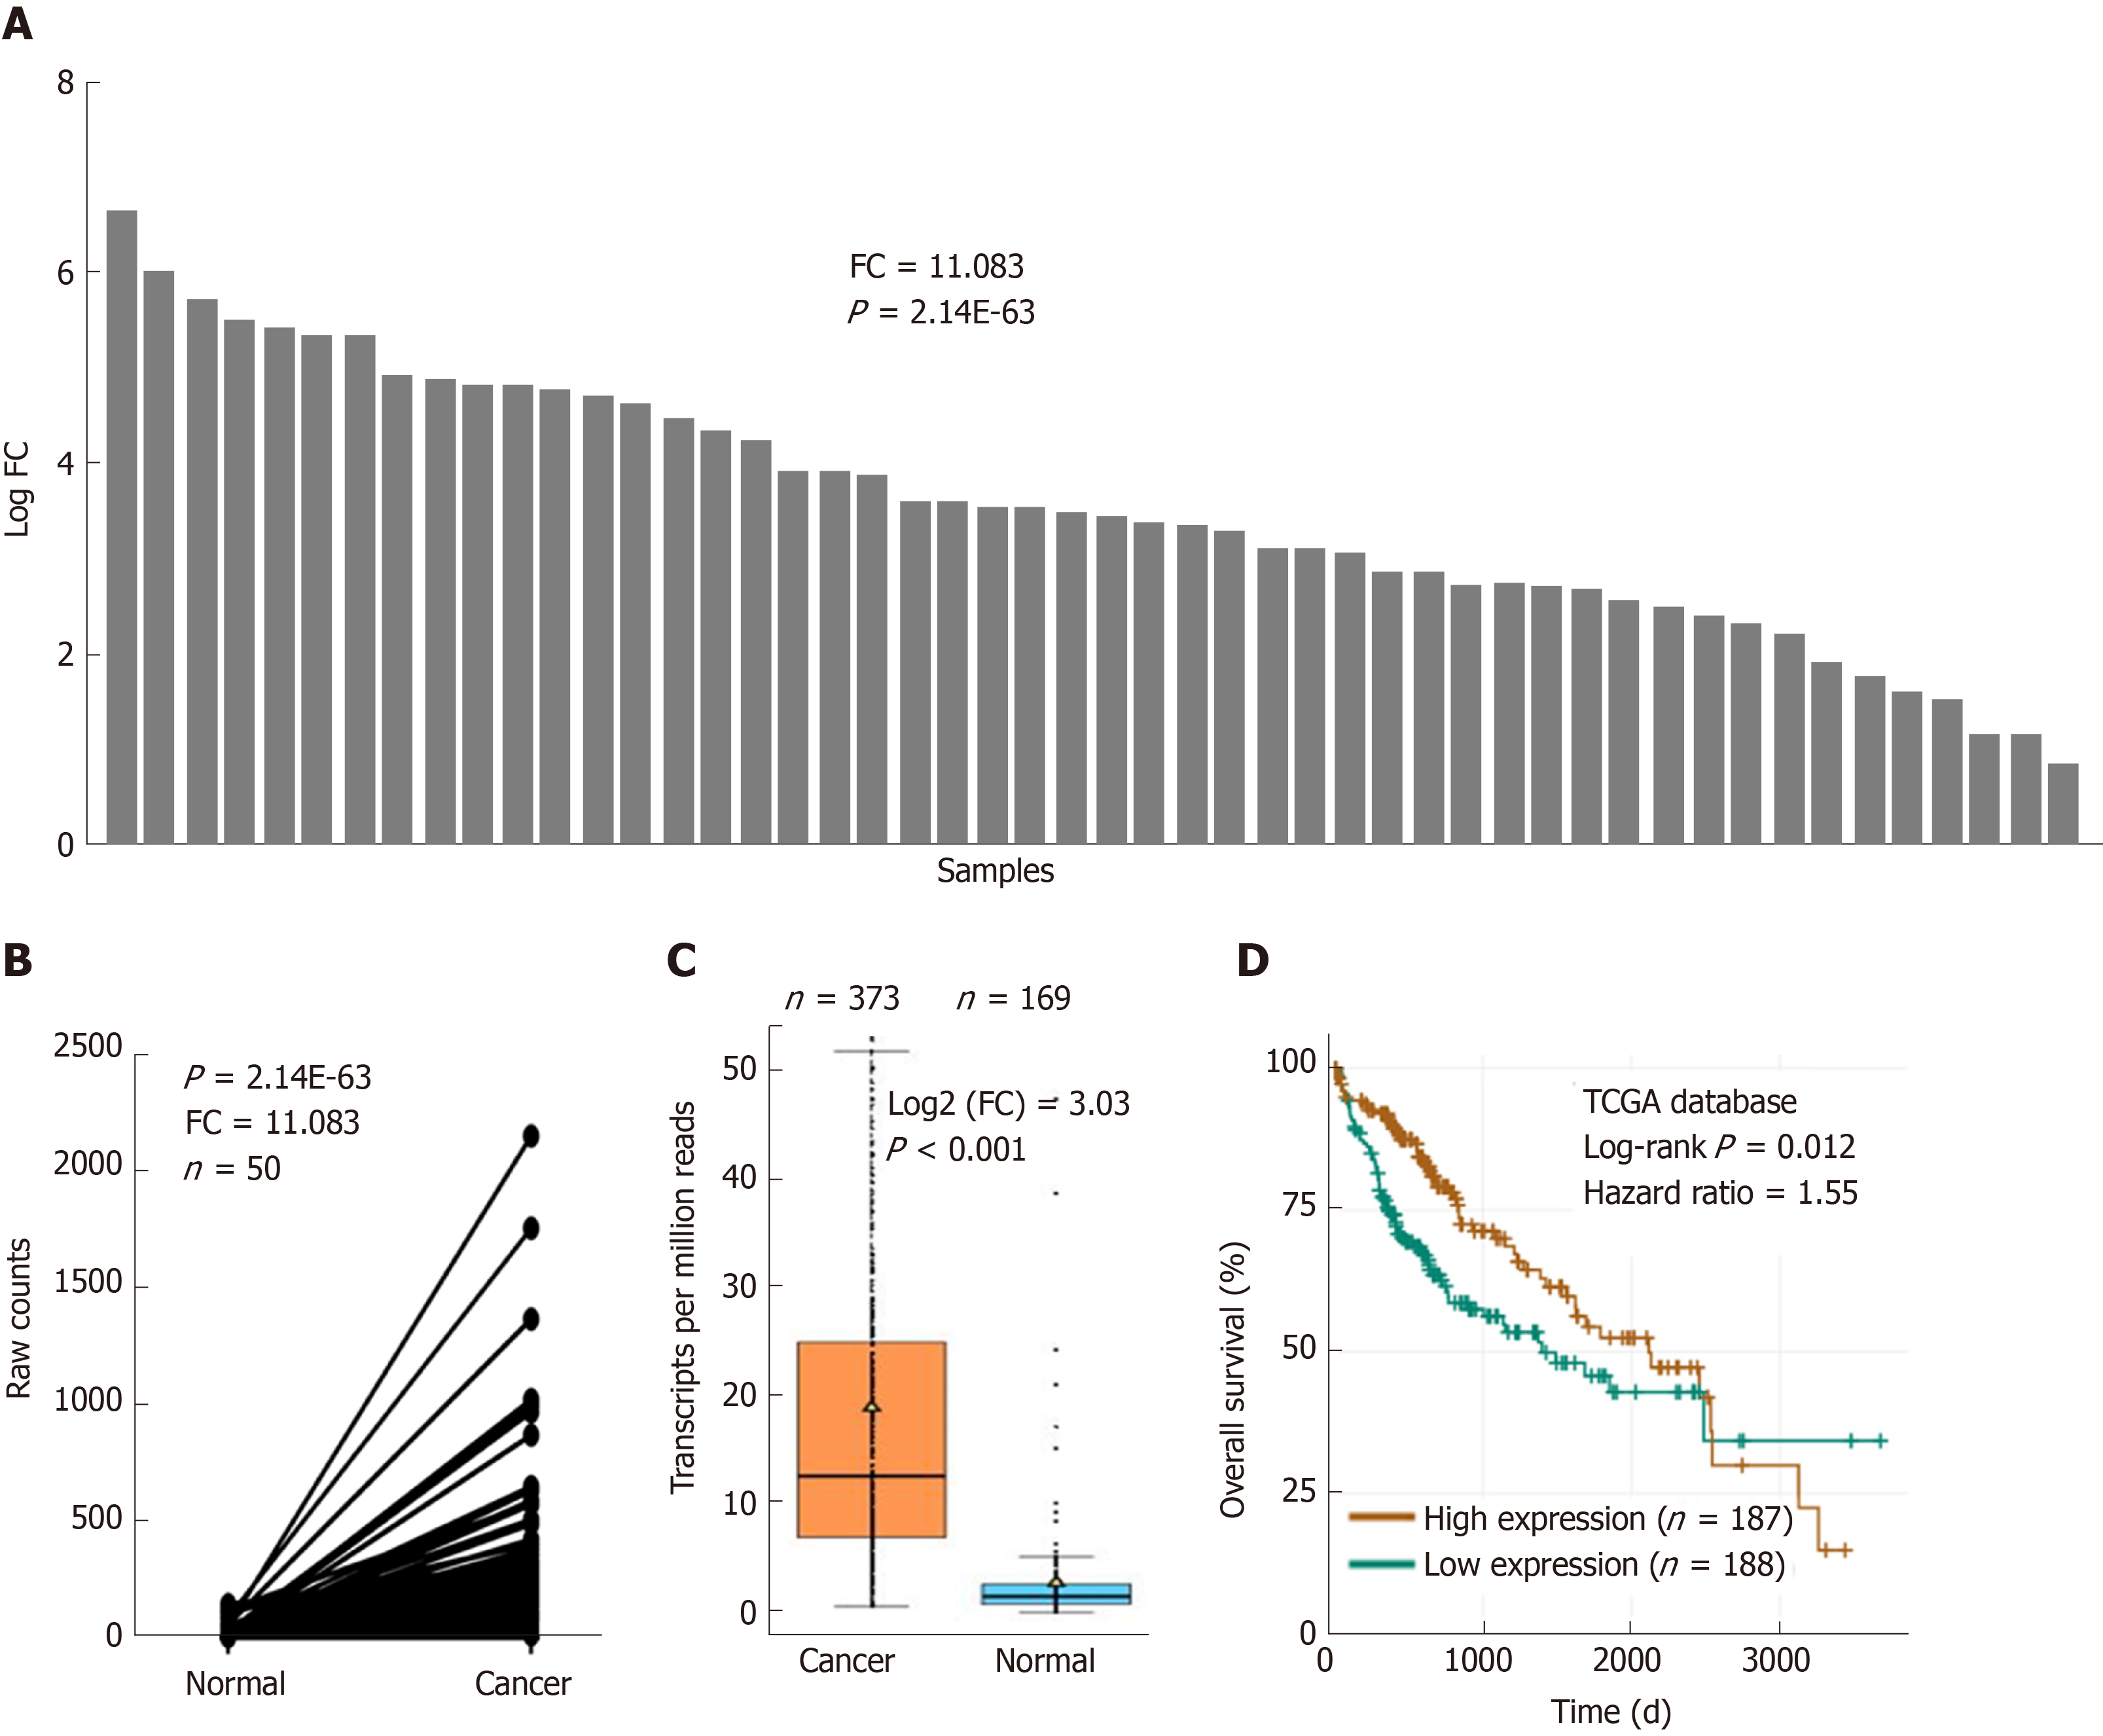
Figure 1 Ubiquitin-conjugating enzyme E2T is overexpressed in hepatocellular carcinoma.
A and B: The relative expression of ubiquitin-conjugating enzyme E2T (UBE2T) in hepatocellular carcinoma (HCC) and adjacent normal tissues based on The Cancer Genome Atlas (TCGA) database (fold change =11.083, n = 50, P = 2.14E-63); C: UBE2T mRNA expression in HCC (n = 373) and normal (n = 169) tissues based on the TCGA database. P < 0.001; D: The overall survival of HCC patients who were divided into the UBE2T high expression group (n = 186) and the UBE2T low expression group (n = 187). P = 0.012. FC: Fold change; TCGA: The Cancer Genome Atlas.
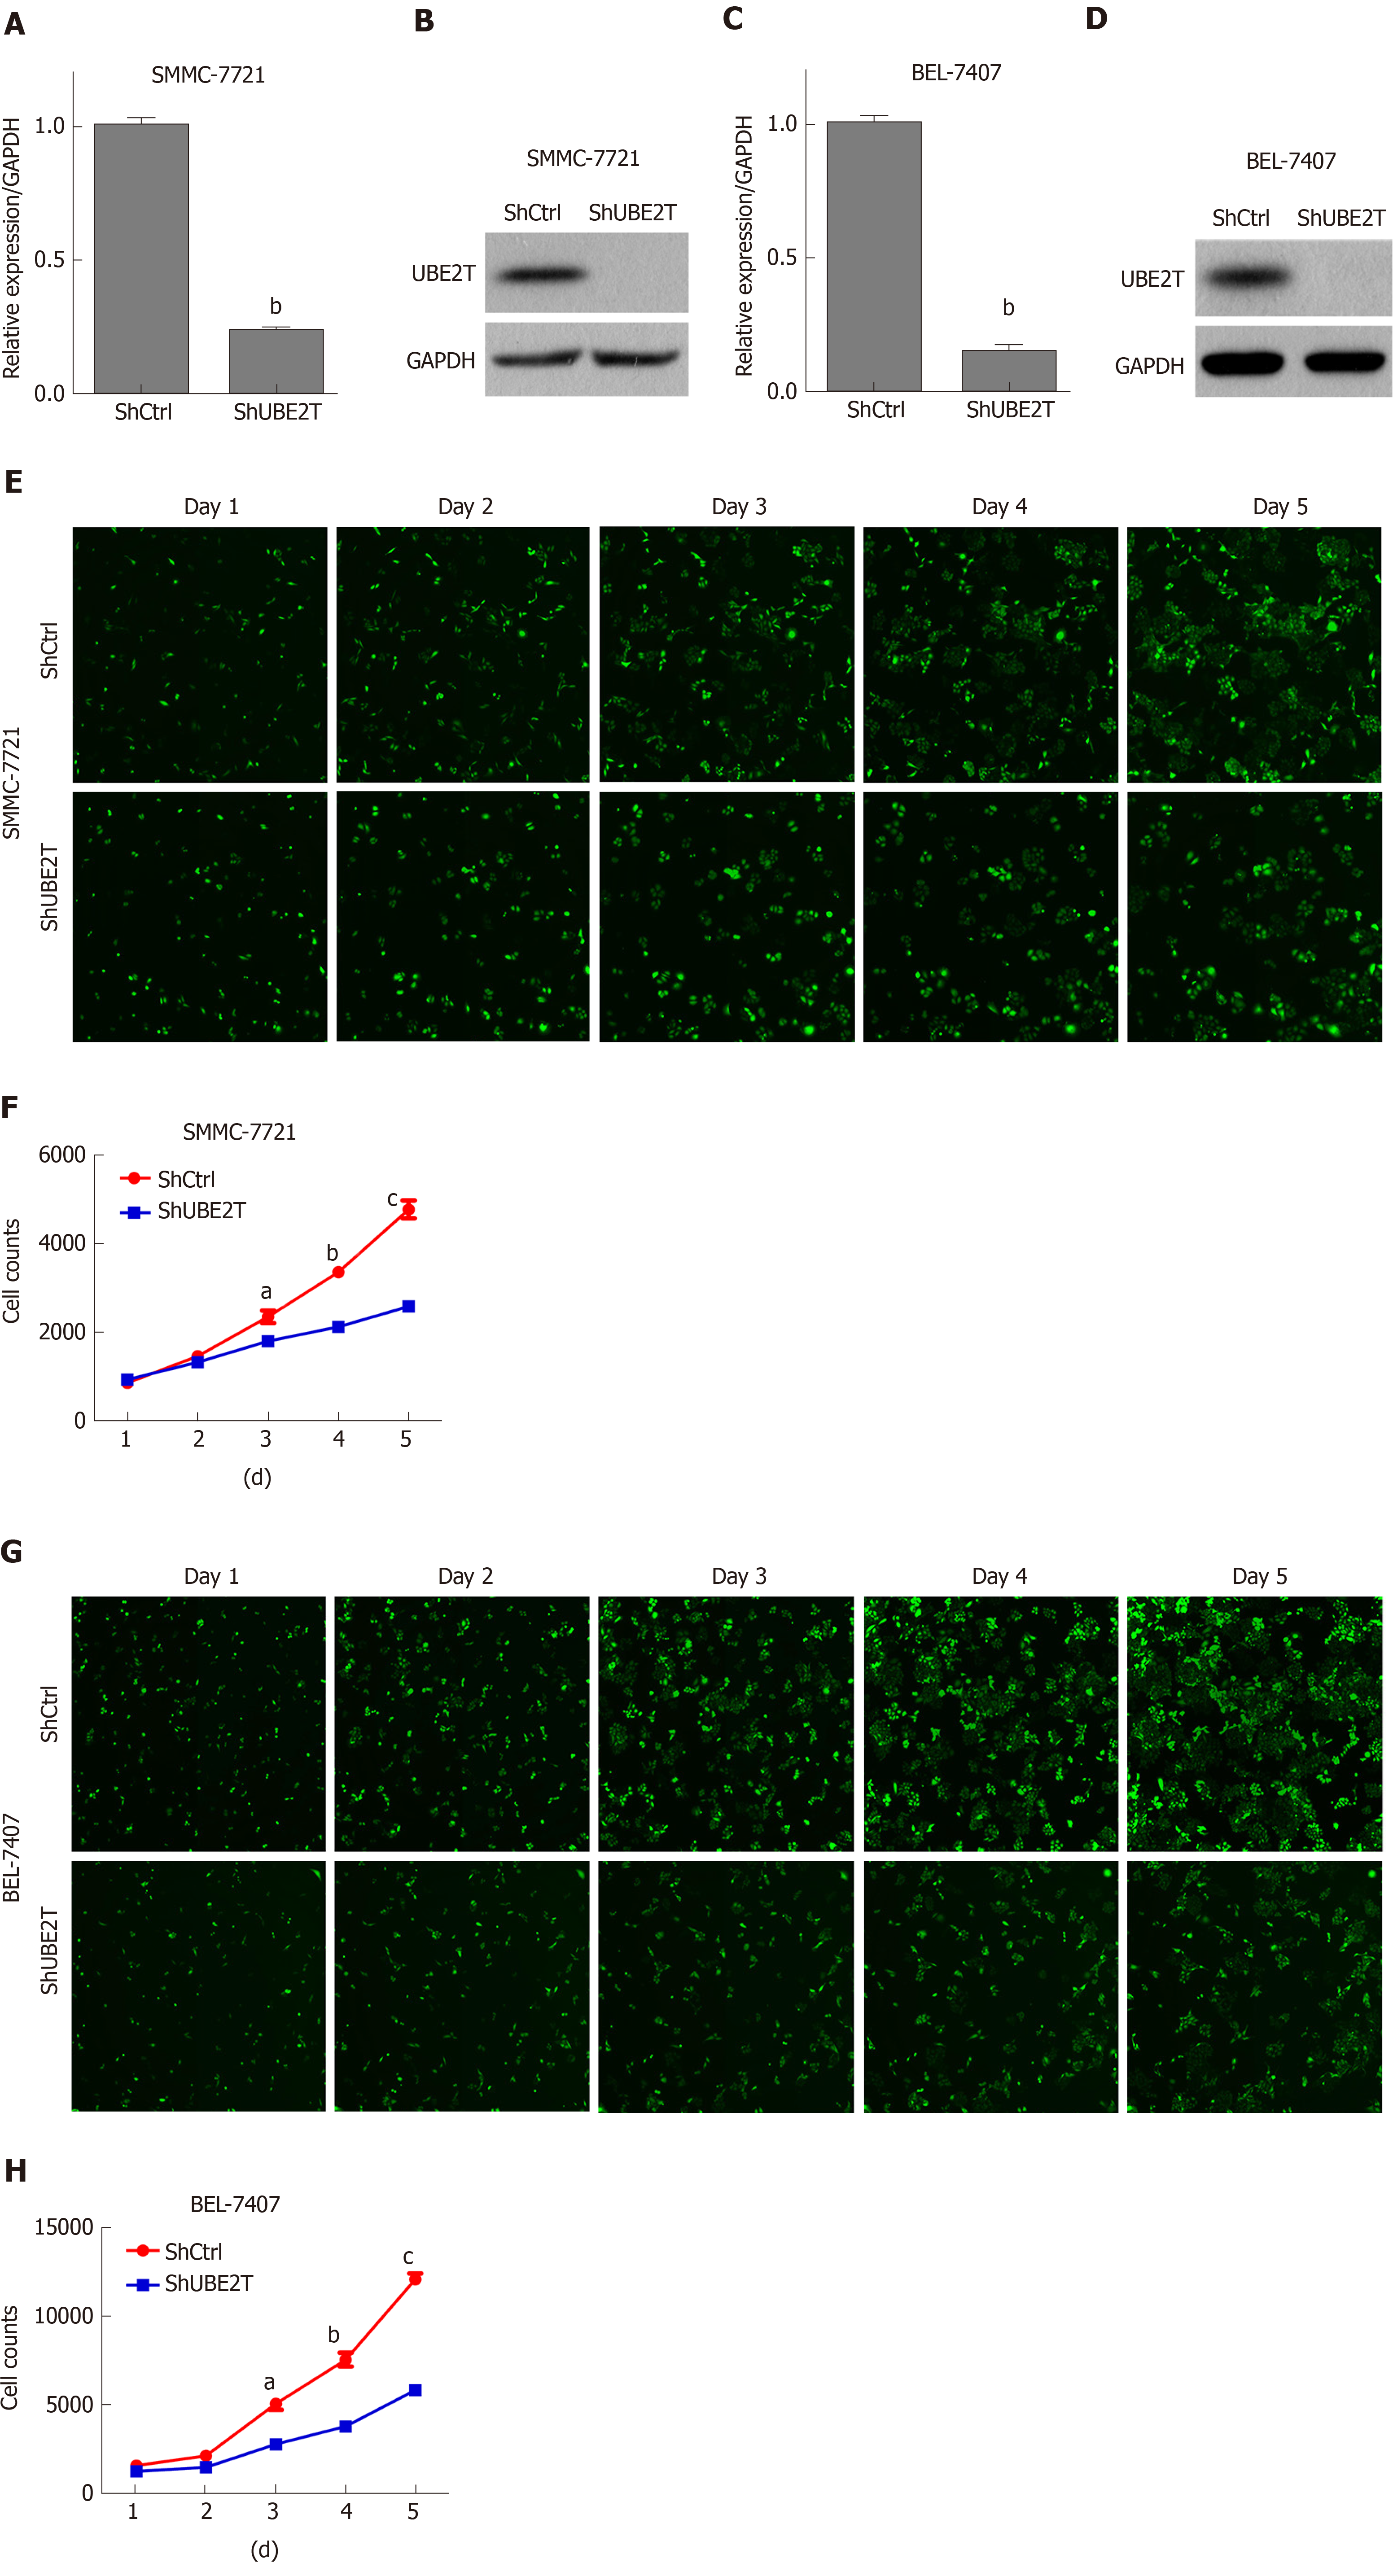
Figure 2 Ubiquitin-conjugating enzyme E2T knockdown reduces the viability of hepatocellular carcinoma cells.
A and B: ShCtrl or ShUBE2T SMMC-7721 cells were subjected to qRT-PCR and Western blot analyses of UBE2T. GAPDH served as an internal control. bP < 0.01; C and D: ShCtrl or ShUBE2T BEL-7404 cells were subjected to qRT-PCR and Western blot analyses of UBE2T. GAPDH served as an internal control. bP < 0.01; E and F: ShCtrl or ShUBE2T SMMC-7721 cells were subjected to multiparametric high-content screening (HCS) analysis of cell viability from day 1 to day 5. Representative images of HCS and quantification of HCS. aP < 0.05, bP < 0.01, cP < 0.001; G and H: ShCtrl or ShUBE2T BEL-7404 cells were subjected to multiparametric HCS analysis of cell viability from day 1 to day 5; G: Representative images of HCS; H: Quantification of HCS. aP < 0.05, bP < 0.01, cP < 0.001. UBE2T: Ubiquitin-conjugating enzyme E2T.
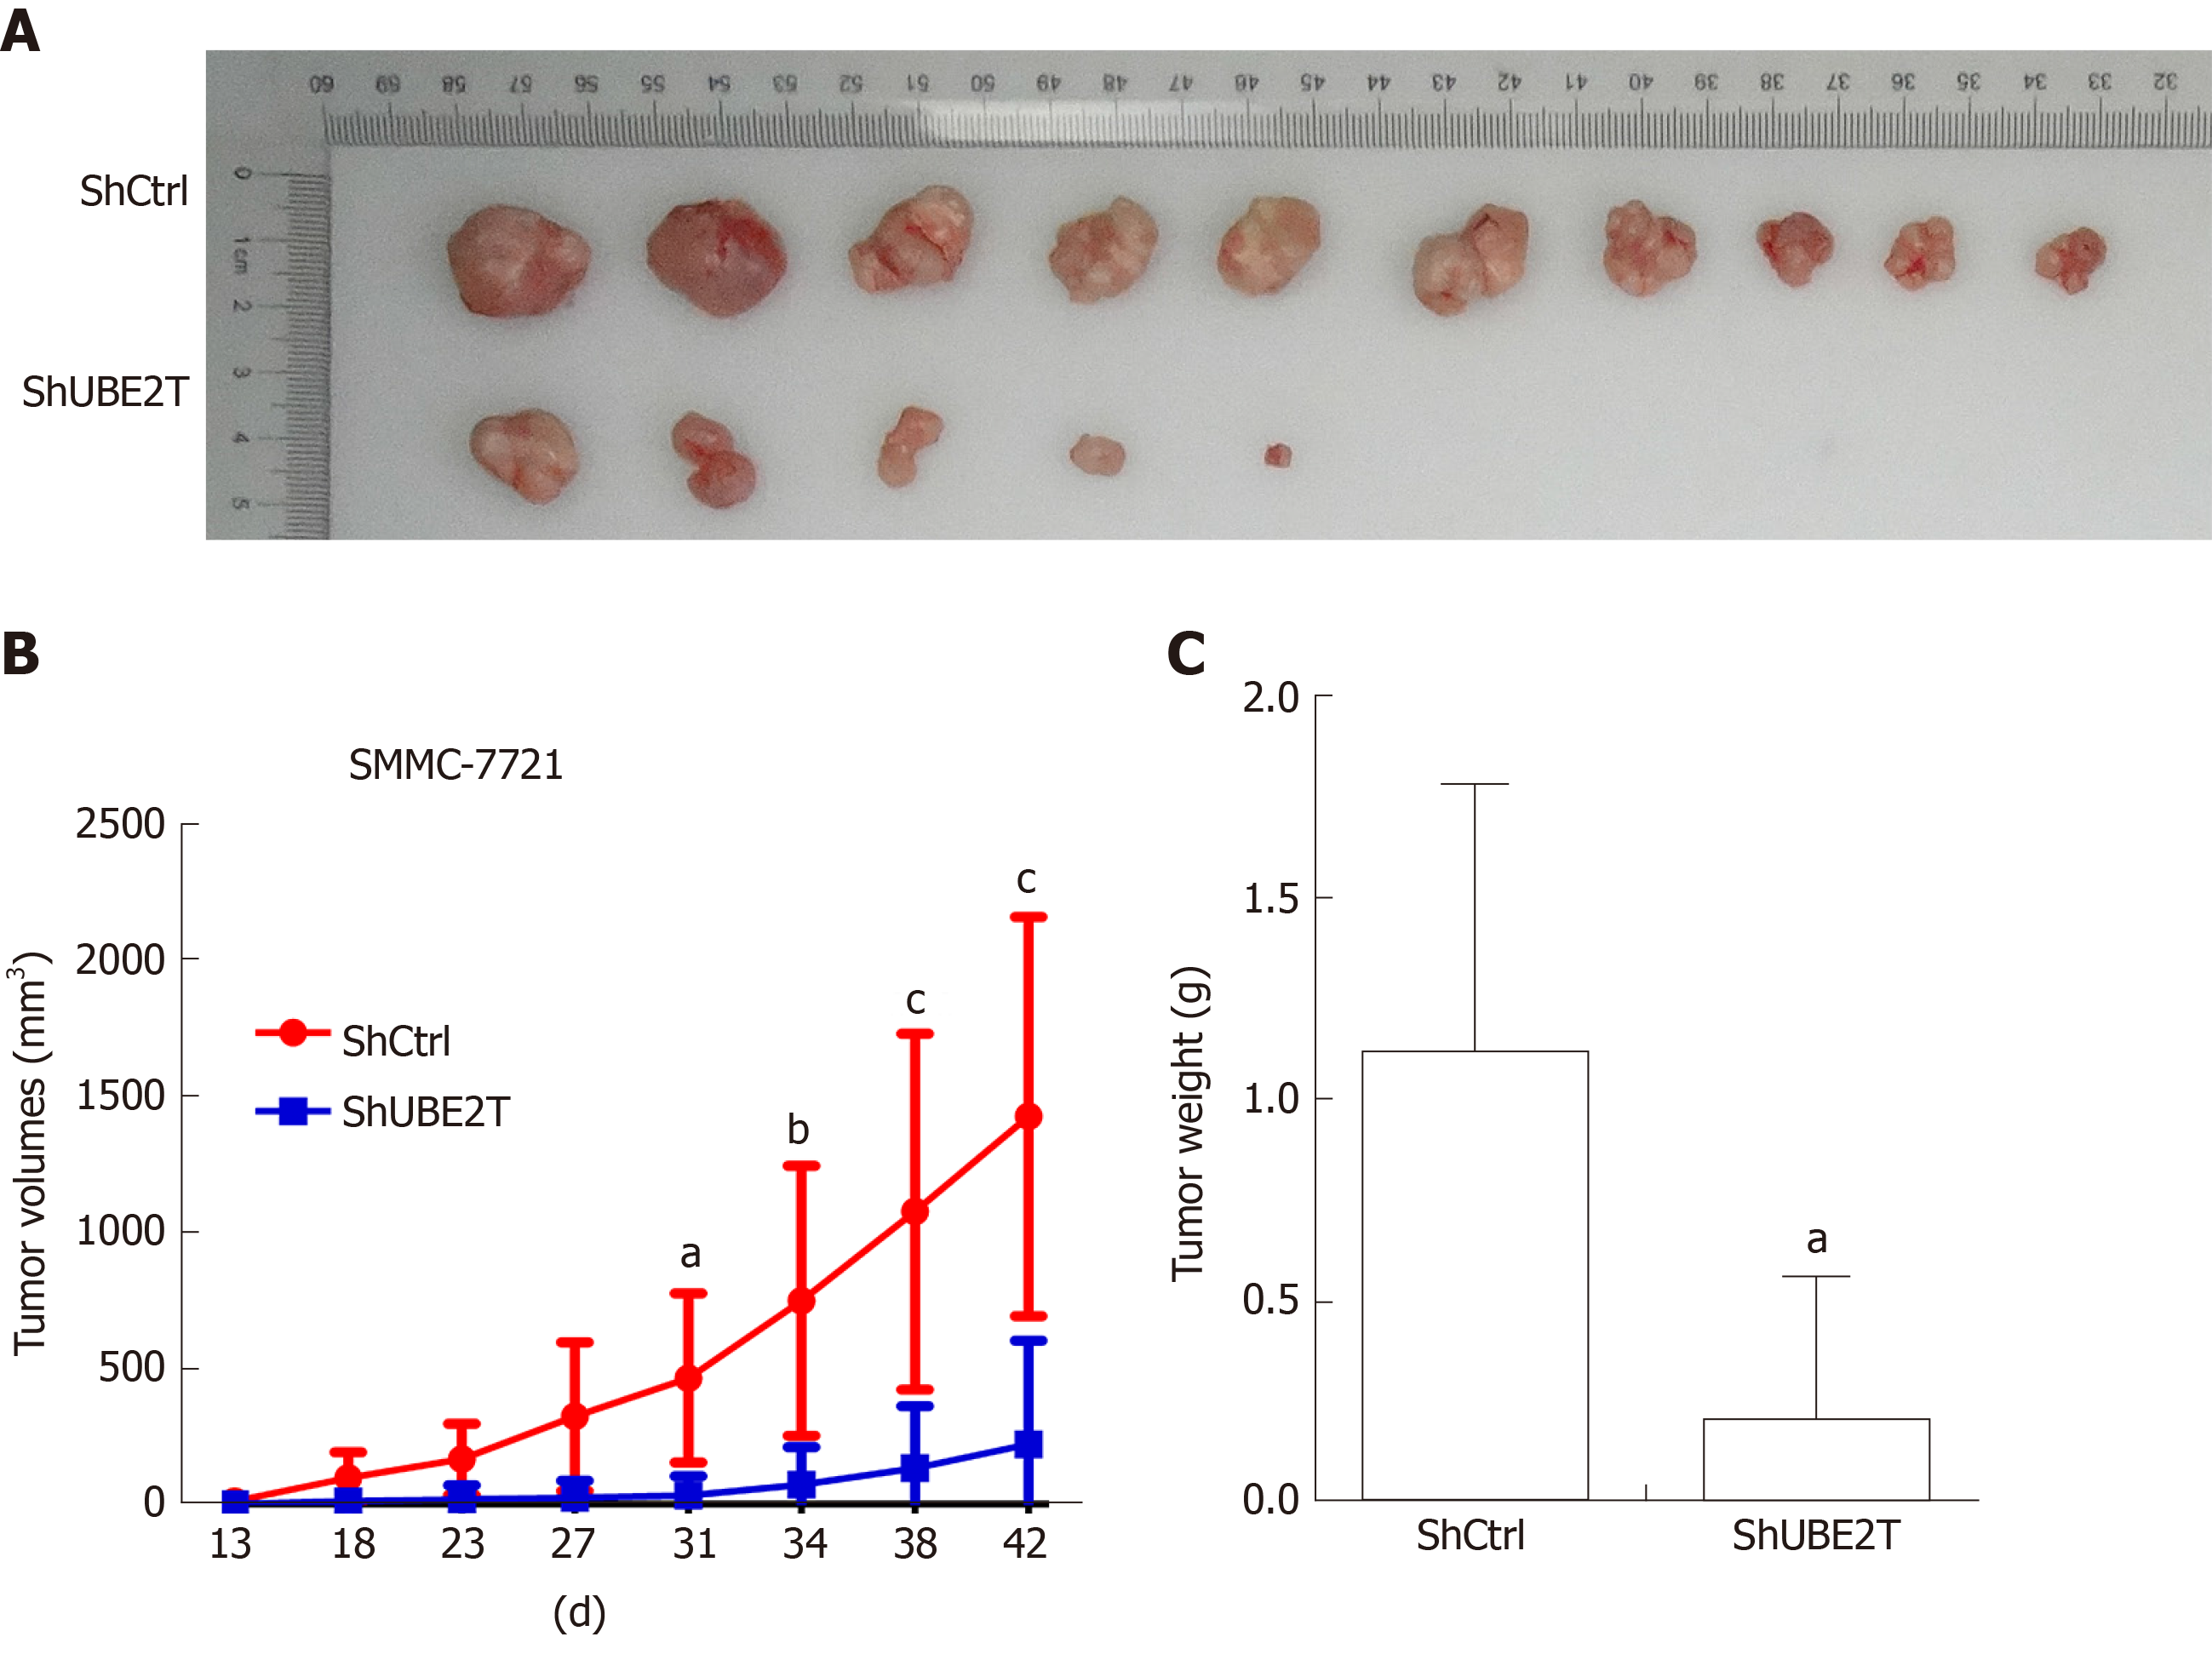
Figure 3 Ubiquitin-conjugating enzyme E2T reduction inhibits the xenograft tumor growth of SMMC-7721 cells.
A: Representative images of xenograft tumors derived from nude mice implanted with ShCtrl and ShUBE2T SMMC-7721 cells. n = 8 per group; B: Xenograft tumor growth in nude mice implanted with ShCtrl and ShUBE2T SMMC-7721 cells from day 13 to 42. n = 8 per group. aP < 0.05, bP < 0.01, cP < 0.001; C: ShCtrl and ShUBE2T xenograft tumor weight 42 d after implantation. bP < 0.01.
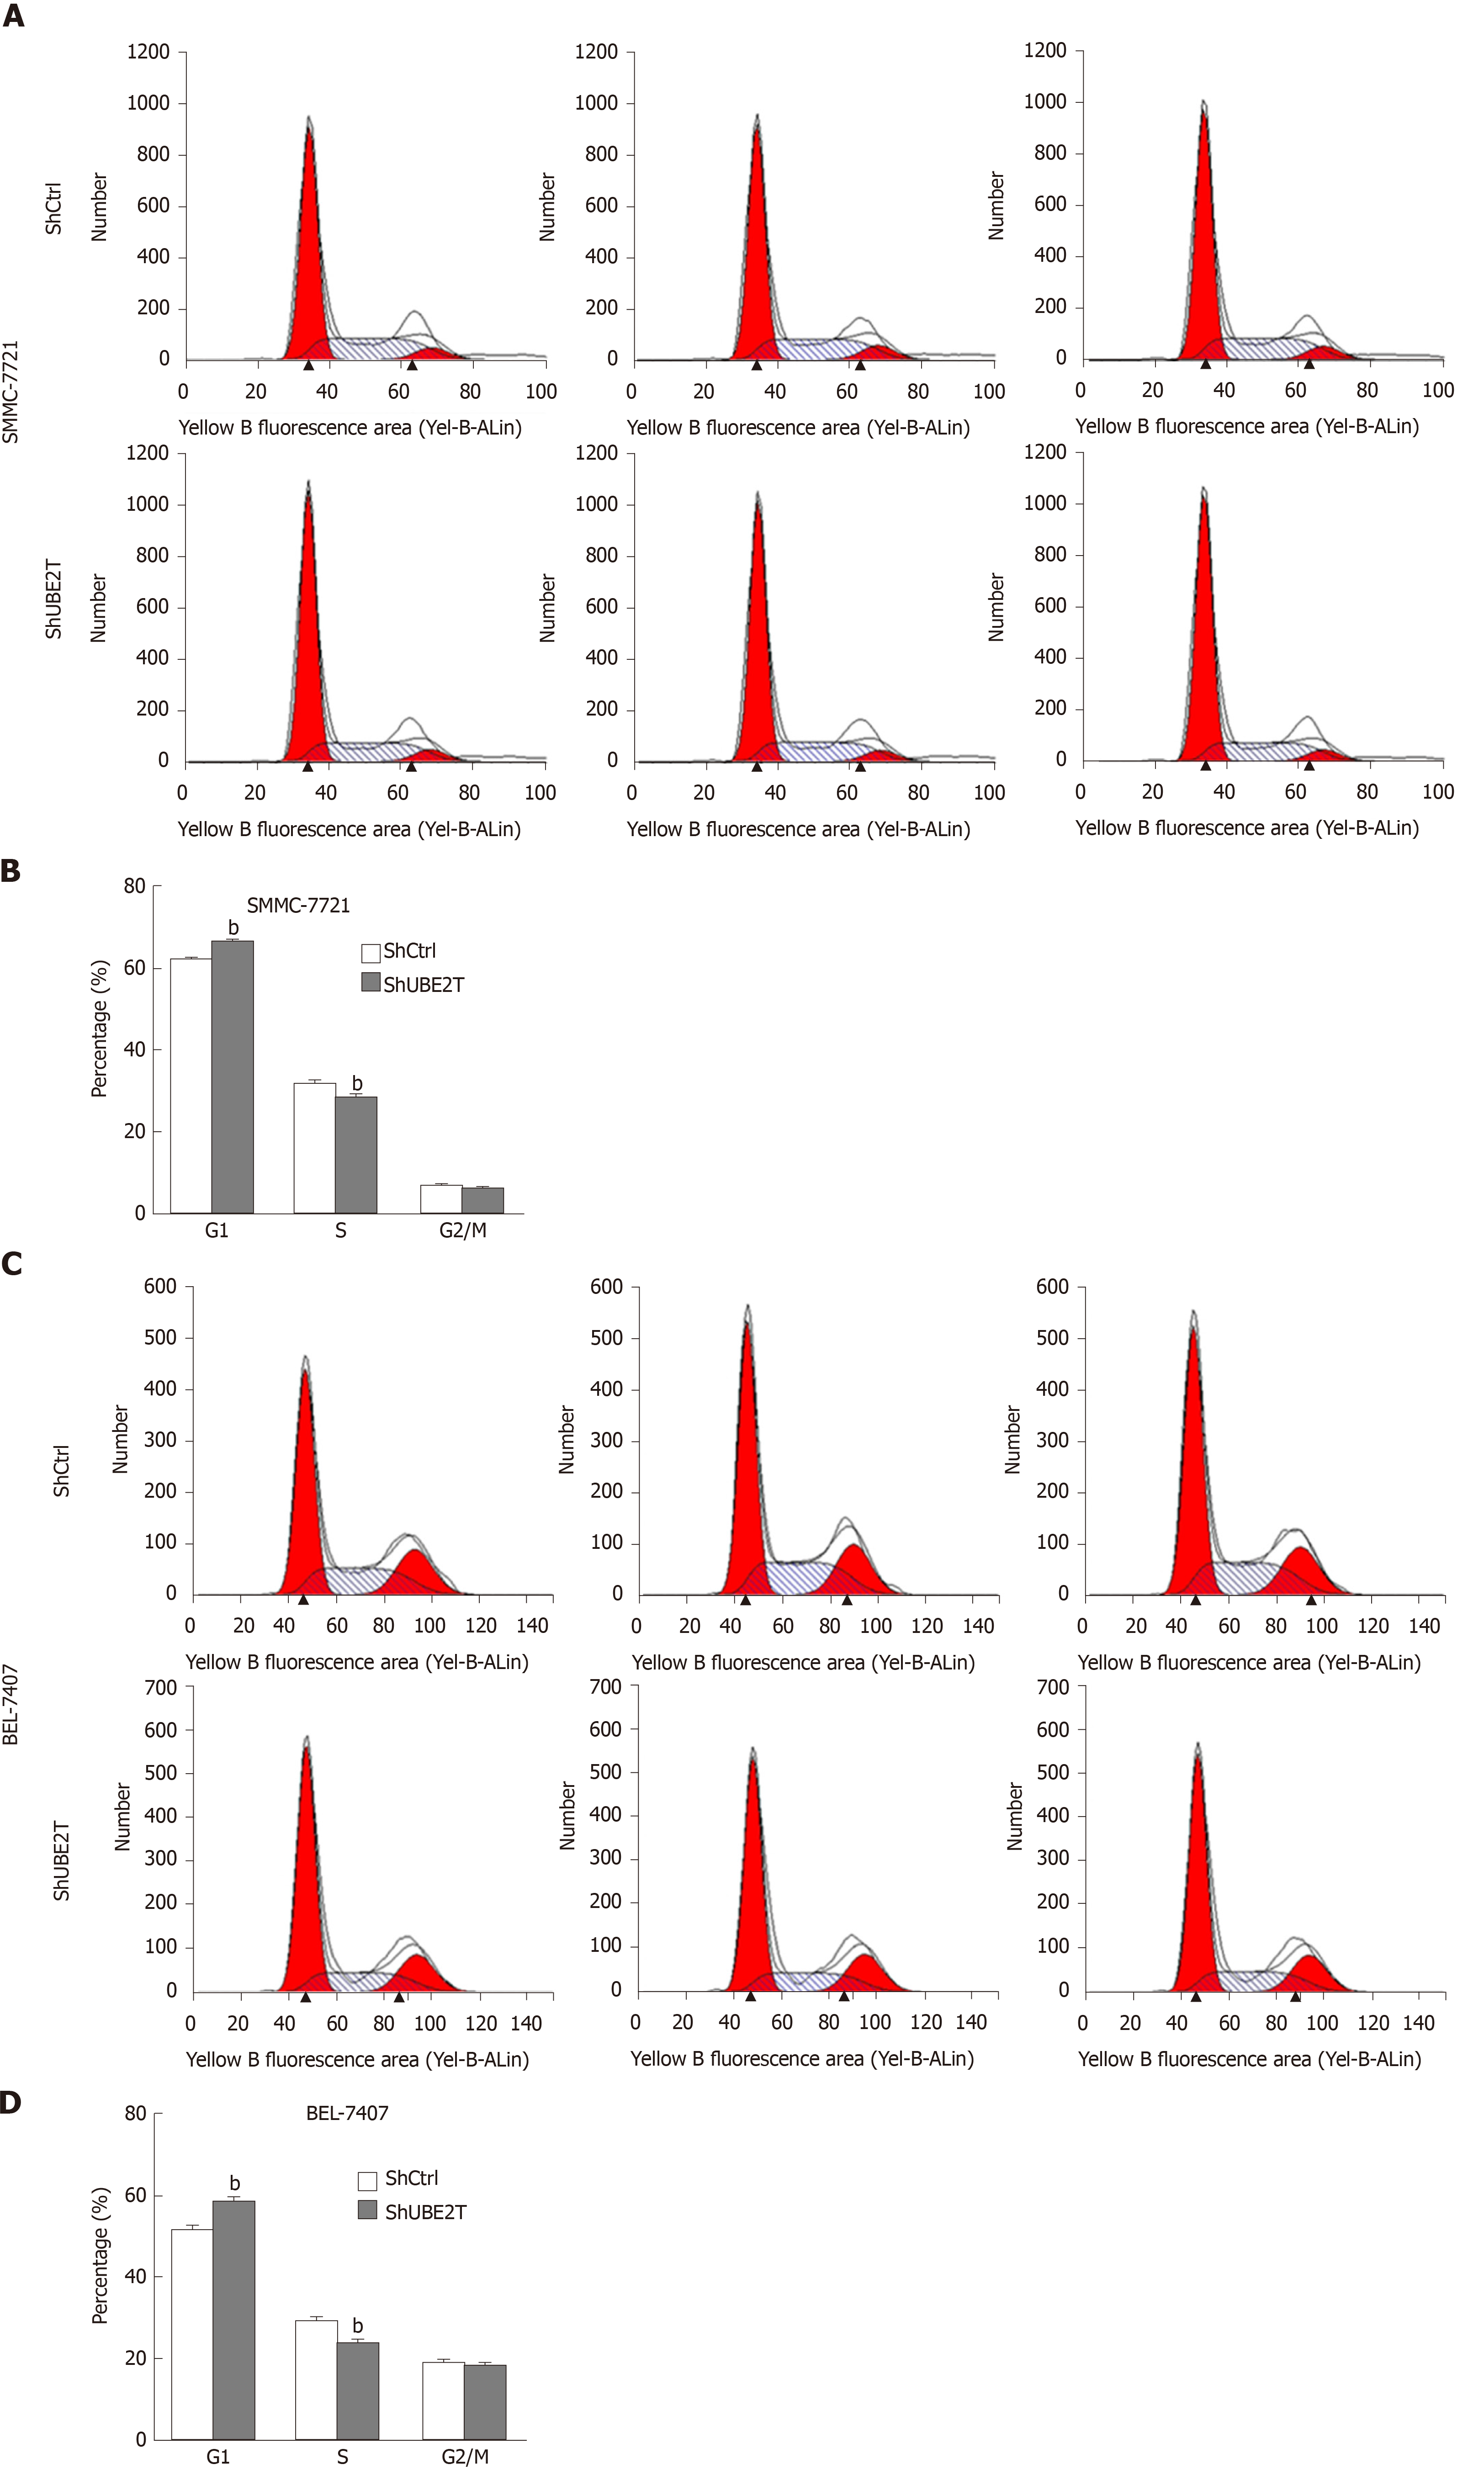
Figure 4 Ubiquitin-conjugating enzyme E2T silencing results in suppressed cell cycle progression in hepatocellular carcinoma cells.
A and B: Cell cycle distribution analysis by flow cytometry indicating that ubiquitin-conjugating enzyme E2T (UBE2T) knockdown caused increased G1 phase and decreased S phase in SMMC-7721 cells. bP < 0.01; C and D: Cell cycle distribution analysis by flow cytometry indicating that UBE2T knockdown caused increased G1 phase and decreased S phase in BEL-7404 cells. bP < 0.01.
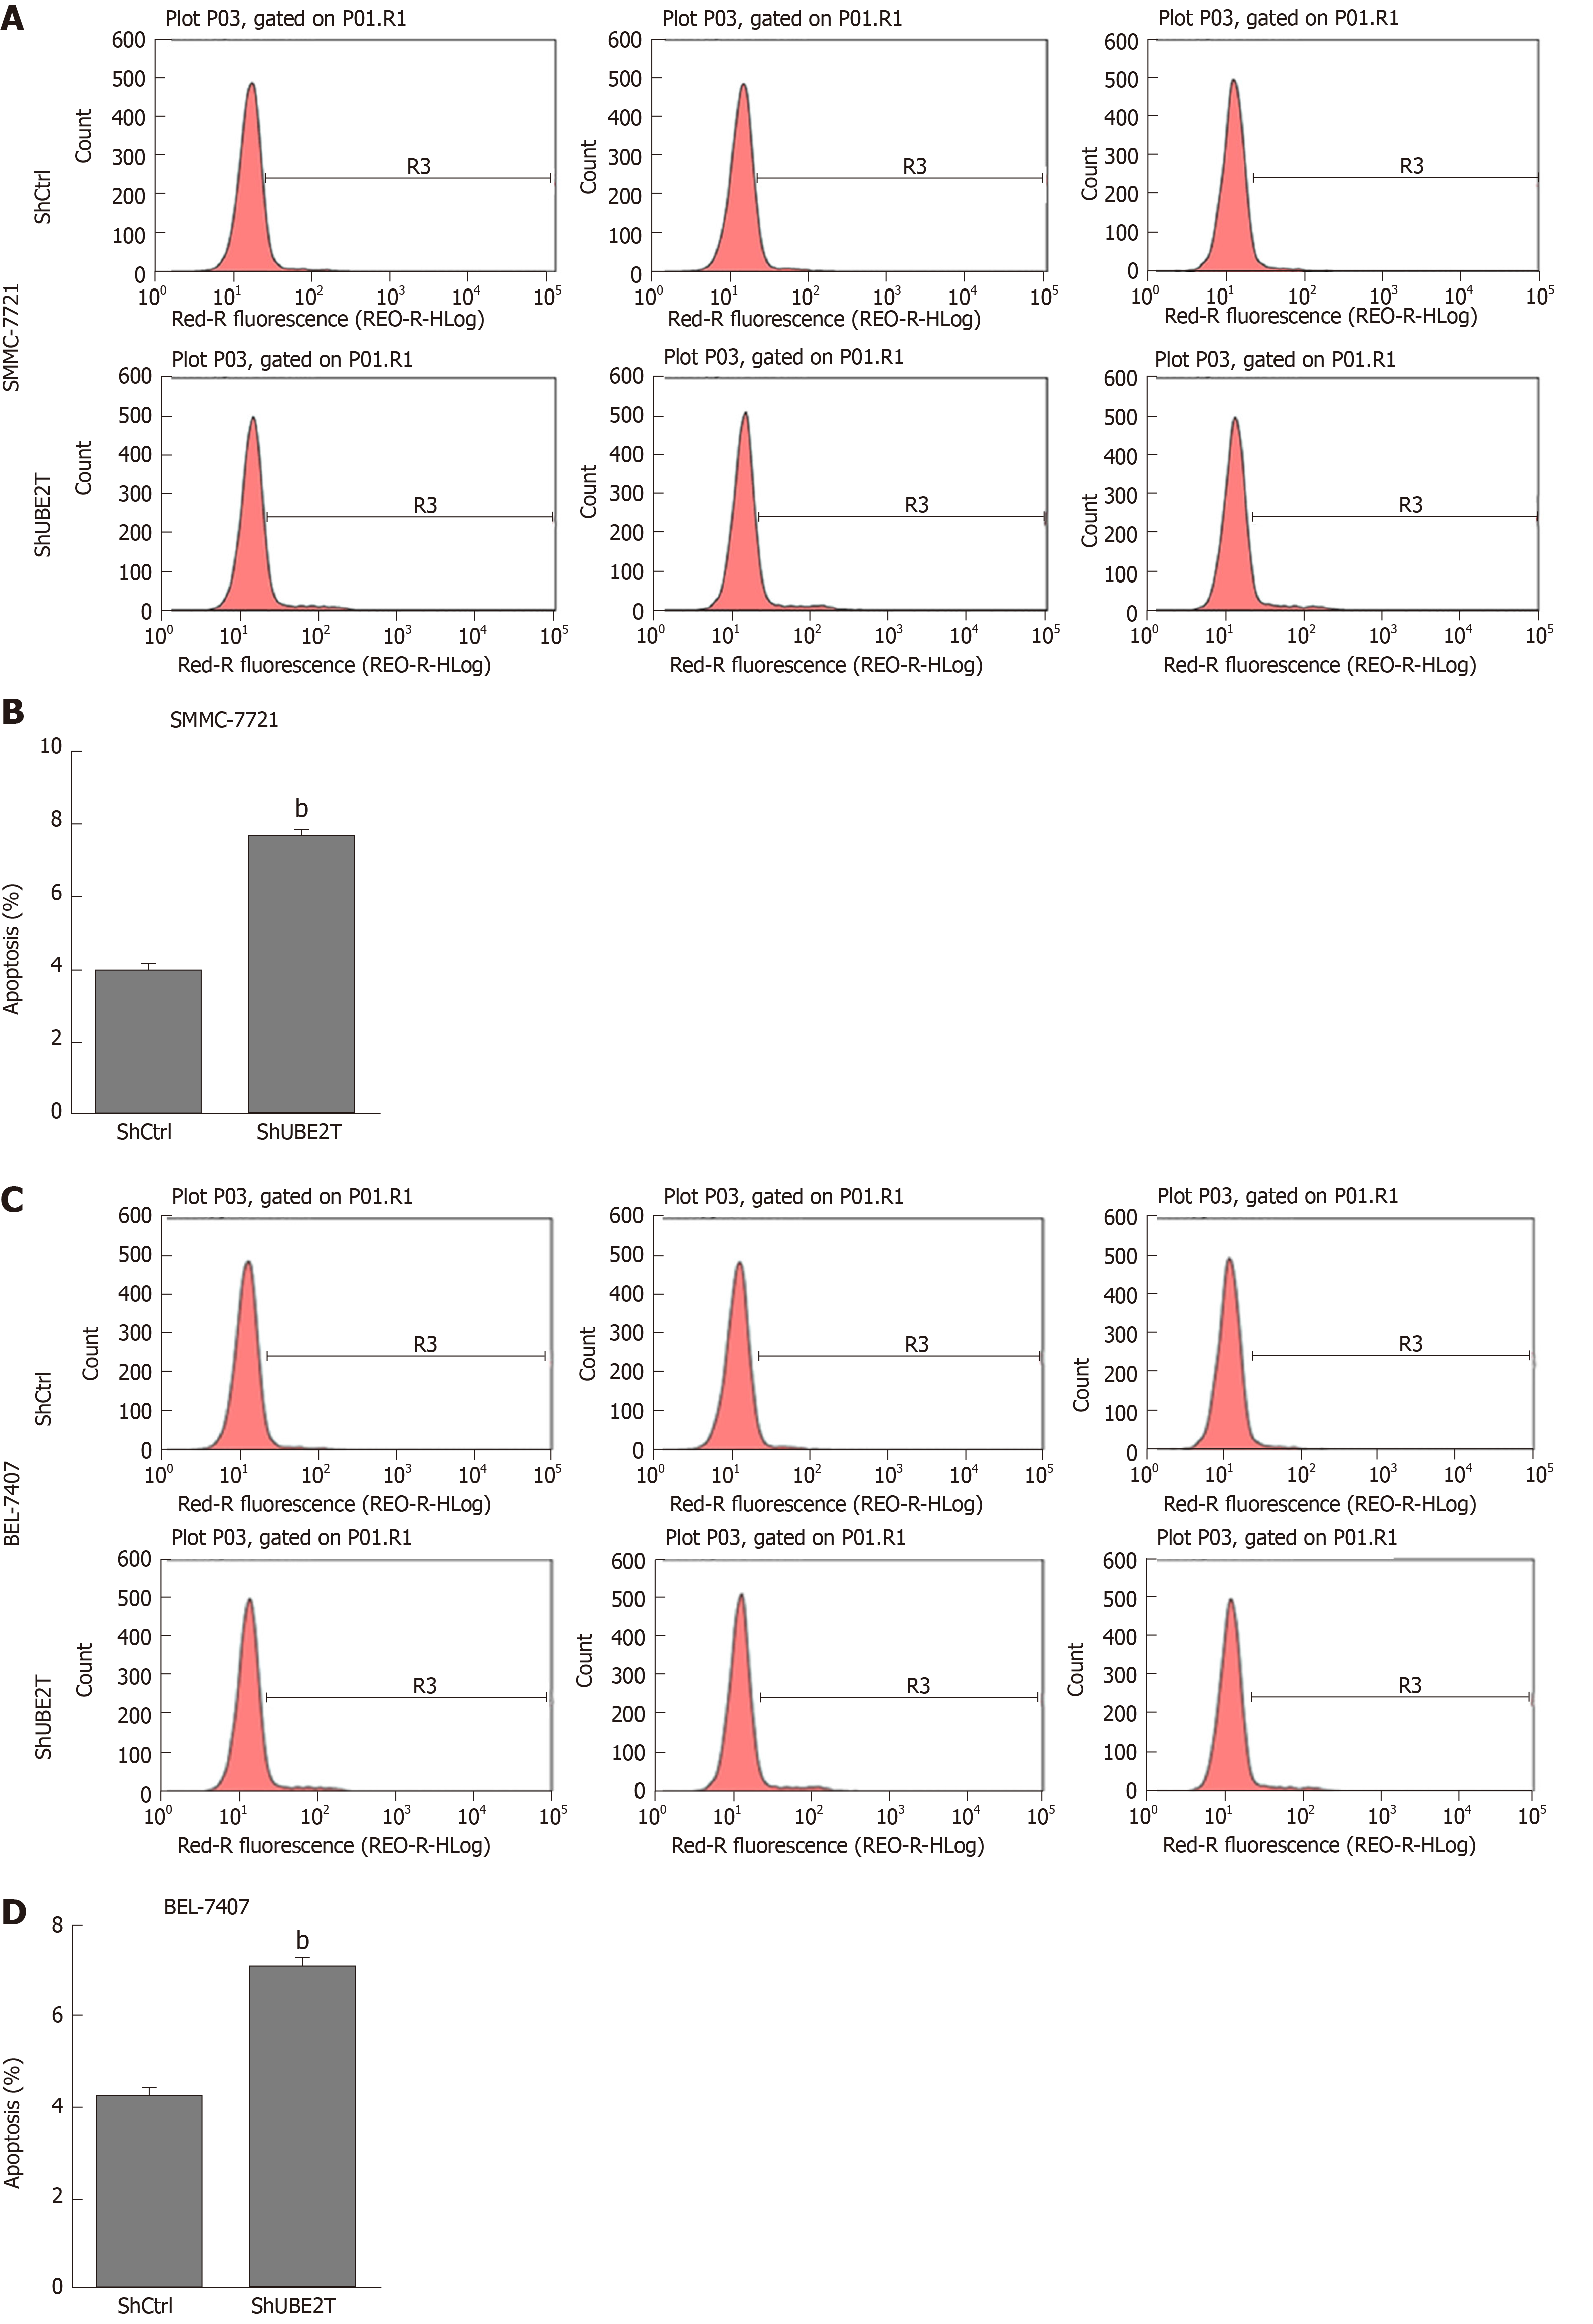
Figure 5 Ubiquitin-conjugating enzyme E2T knockdown enhances apoptosis in hepatocellular carcinoma cells.
A and B: Apoptosis in ShCtrl and ShUBE2T SMMC-7721 cells was detected by flow cytometry. Representative flow cytometry plots and apoptosis quantification are shown. bP < 0.01; C and D: The apoptosis of ShCtrl and ShUBE2T BEL-7404 cells was detected by flow cytometry. Representative flow cytometry plots and apoptosis quantification are shown. bP < 0.01.
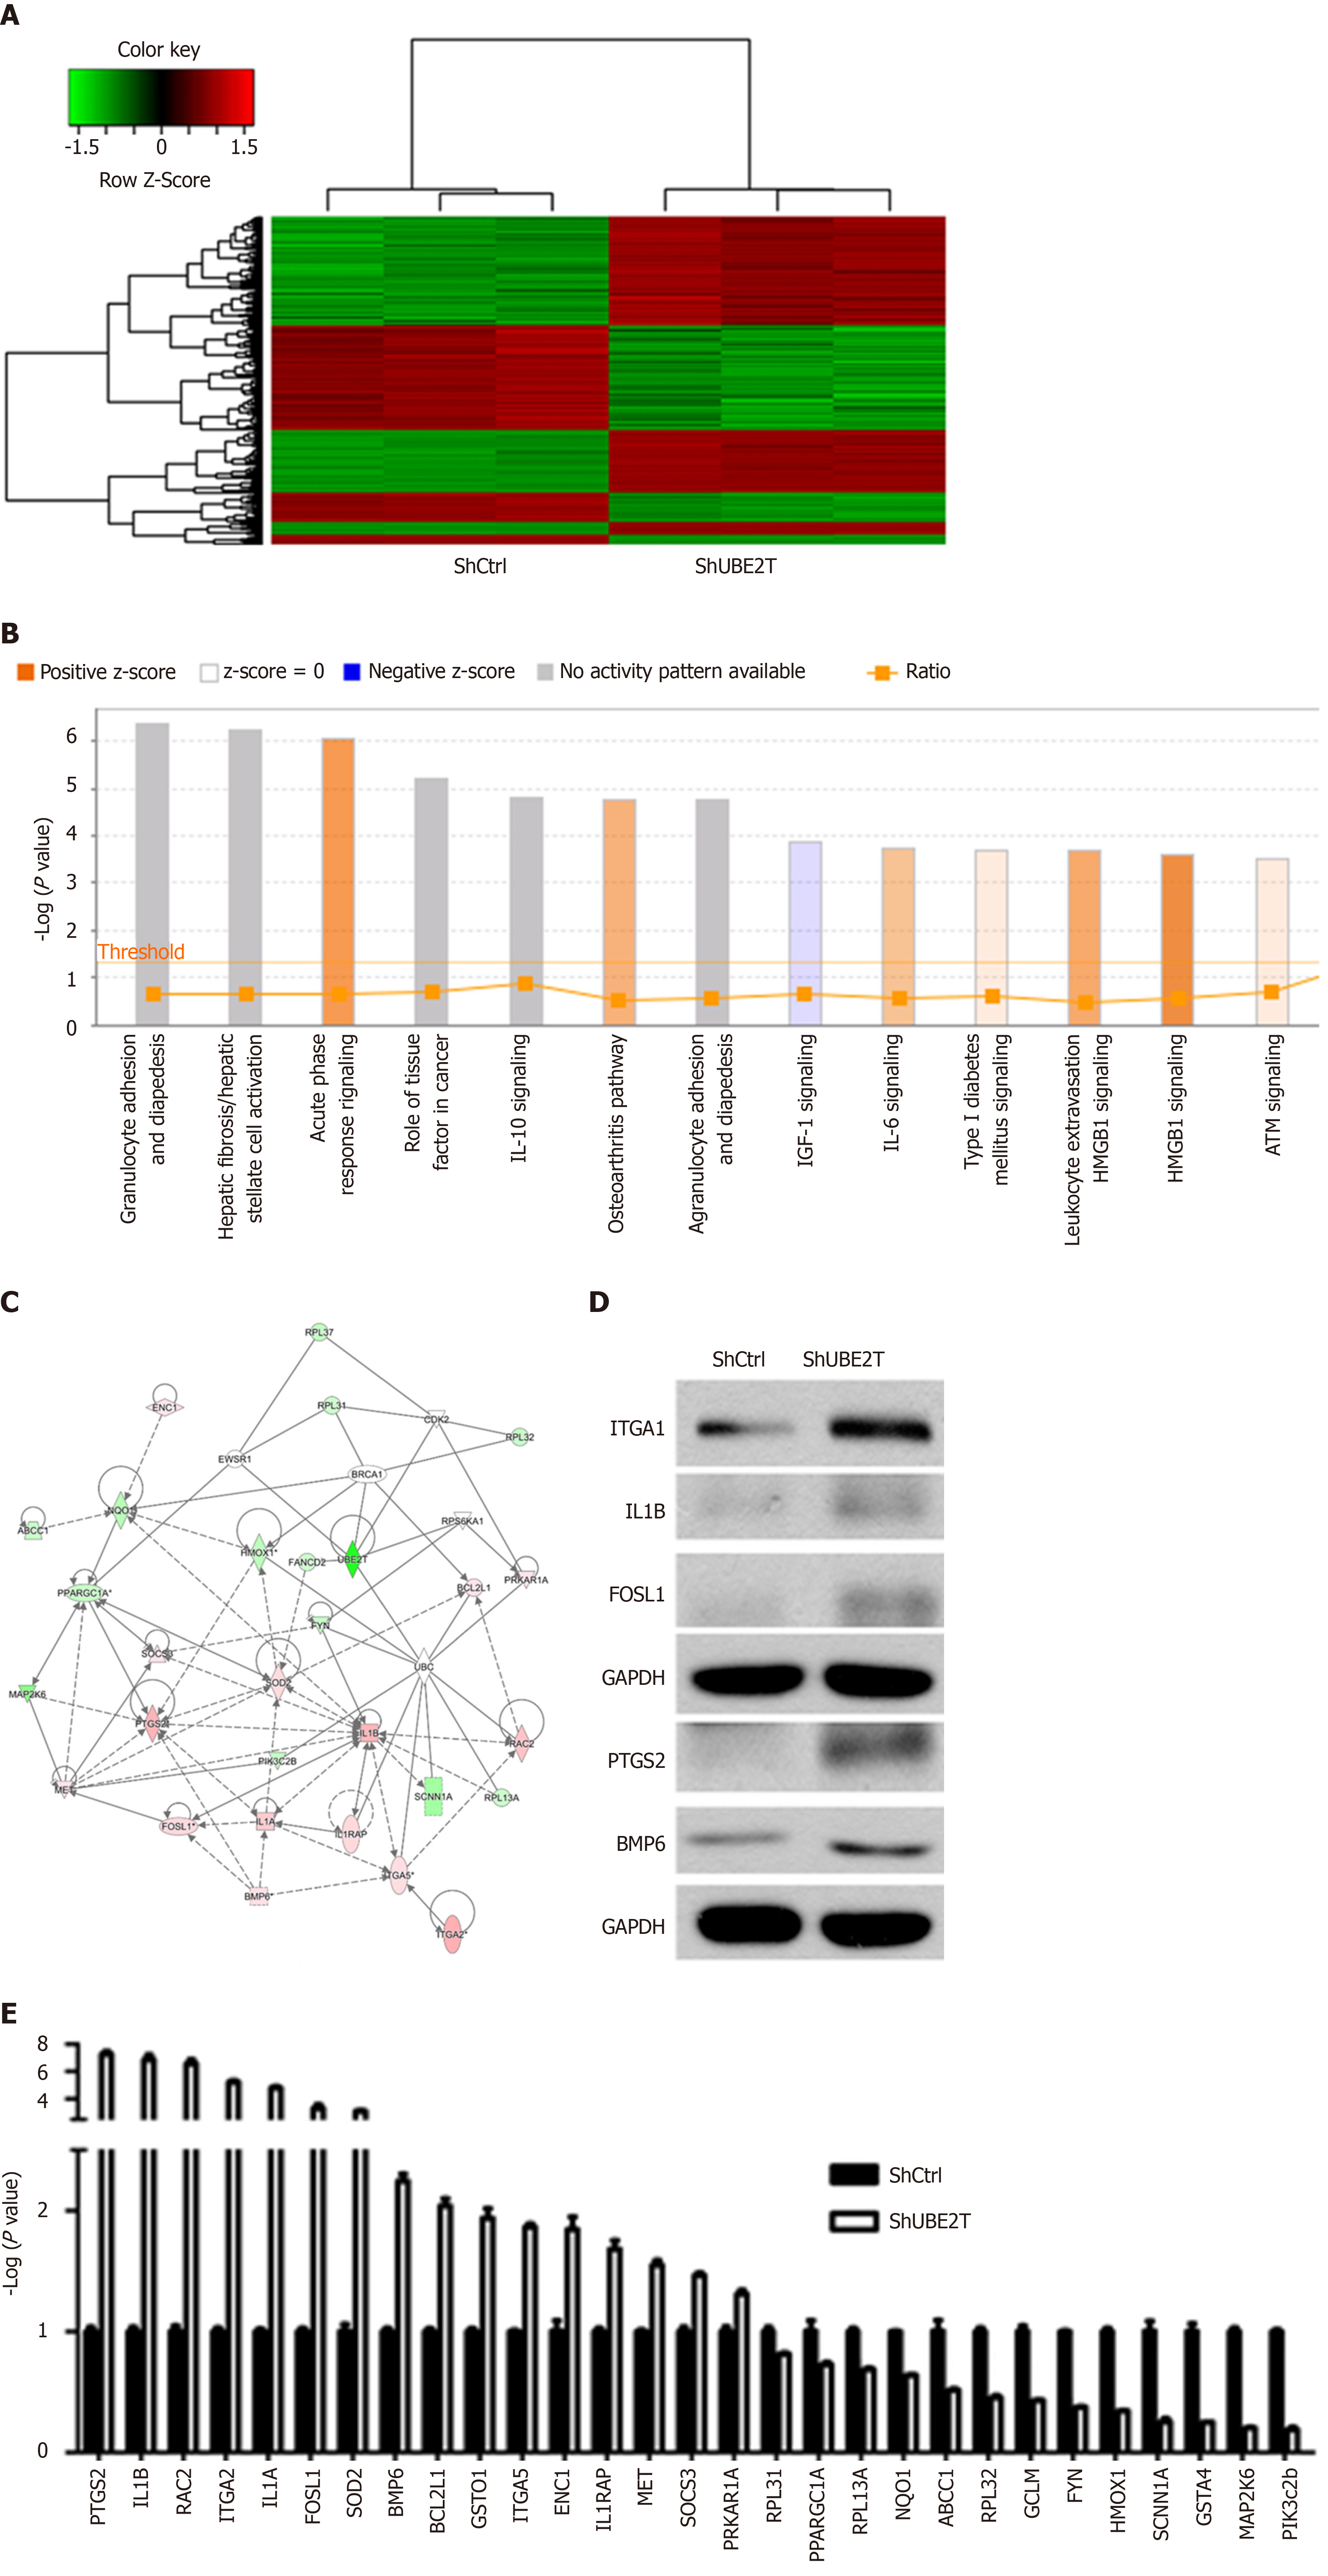
Figure 6 Dys-regulated genes in SMMC-7721 cells with ubiquitin-conjugating enzyme E2T knockdown.
A: GeneChip assay showed that a total of 630 genes were regulated by ubiquitin-conjugating enzyme E2T (UBE2T) knockdown in SMMC-7721 cells (354 genes were upregulated and 276 genes downregulated) (P < 0.05, fold change > 2); B: The pathway enrichment analysis was performed using IPA software. Orange indicates activated pathways, and blue indicates suppressed pathways; C: Possible regulation network for UBE2T. The map shows upregulated SOD2 and its potential downstream targets. Pink box indicates upregulated genes, and green box indicates downregulated genes; D: qRT-PCR analysis of the indicated genes in ShCtrl and ShUBE2T SMMC-7721 cells. aP < 0.05, bP < 0.01, cP < 0.001; E: ShCtrl and ShUBE2T SMMC-7721 cells were subjected to Western blot analysis.
- Citation: Guo J, Wang M, Wang JP, Wu CX. Ubiquitin-conjugating enzyme E2T knockdown suppresses hepatocellular tumorigenesis via inducing cell cycle arrest and apoptosis. World J Gastroenterol 2019; 25(43): 6386-6403
- URL: https://www.wjgnet.com/1007-9327/full/v25/i43/6386.htm
- DOI: https://dx.doi.org/10.3748/wjg.v25.i43.6386


