Copyright
©The Author(s) 2019.
World J Gastroenterol. Oct 7, 2019; 25(37): 5711-5731
Published online Oct 7, 2019. doi: 10.3748/wjg.v25.i37.5711
Published online Oct 7, 2019. doi: 10.3748/wjg.v25.i37.5711
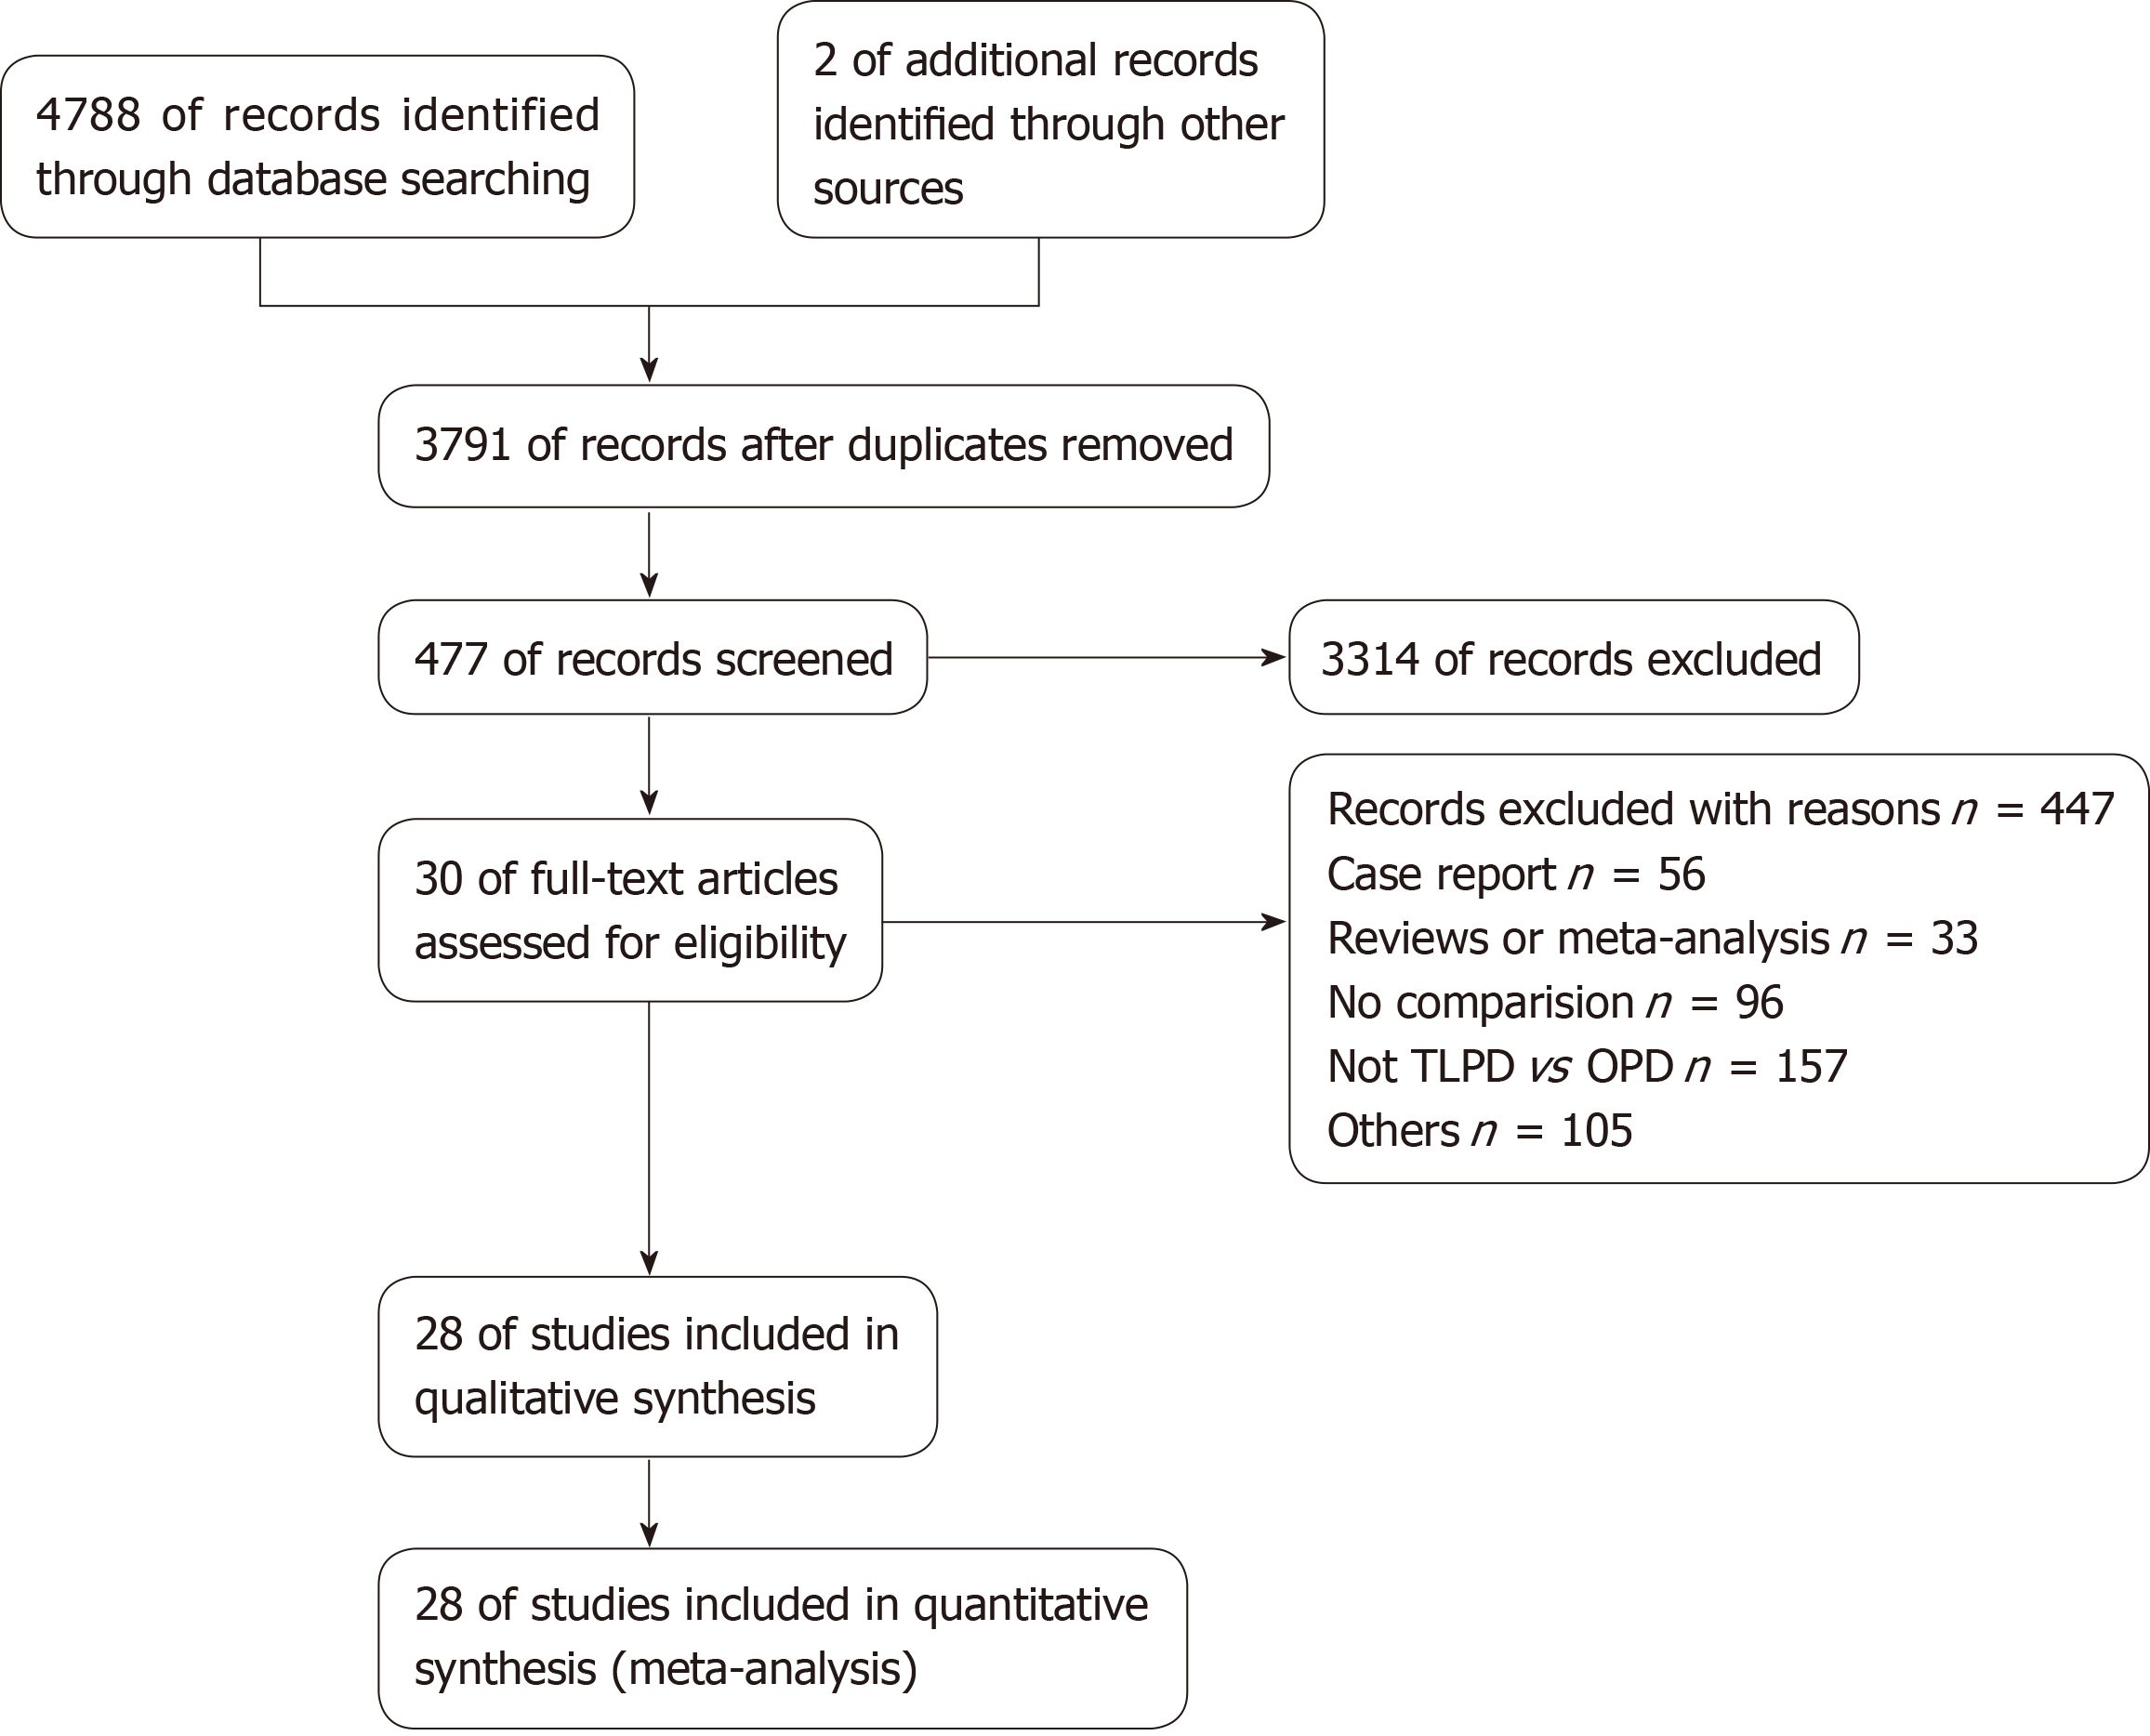
Figure 1 The PRISMA flowchart of the literature review.
Figure 2 Forest plots of the meta-analysis.
A: Operative time; B: Estimated blood loss; C: Transfusion rate; D: Overall morbidity; E: Postoperative pancreatic fistula; F: Delayed gastric emptying; G: Delayed gastric emptying (grade B/C); H: Bile leak; I: Postpancreatectomy hemorrhage; J: Wound infection; K: Pneumonia; L: Duration of intensive care unit stay; M: Length of hospital stay; N: Discharge to a new facility; O: 30-d readmission; P: Tumor size; Q: Retrieved lymph nodes; R: R0 resection; S: Time to adjuvant chemotherapy.
- Citation: Zhang H, Lan X, Peng B, Li B. Is total laparoscopic pancreaticoduodenectomy superior to open procedure? A meta-analysis. World J Gastroenterol 2019; 25(37): 5711-5731
- URL: https://www.wjgnet.com/1007-9327/full/v25/i37/5711.htm
- DOI: https://dx.doi.org/10.3748/wjg.v25.i37.5711


