Copyright
©The Author(s) 2019.
World J Gastroenterol. Sep 28, 2019; 25(36): 5434-5450
Published online Sep 28, 2019. doi: 10.3748/wjg.v25.i36.5434
Published online Sep 28, 2019. doi: 10.3748/wjg.v25.i36.5434
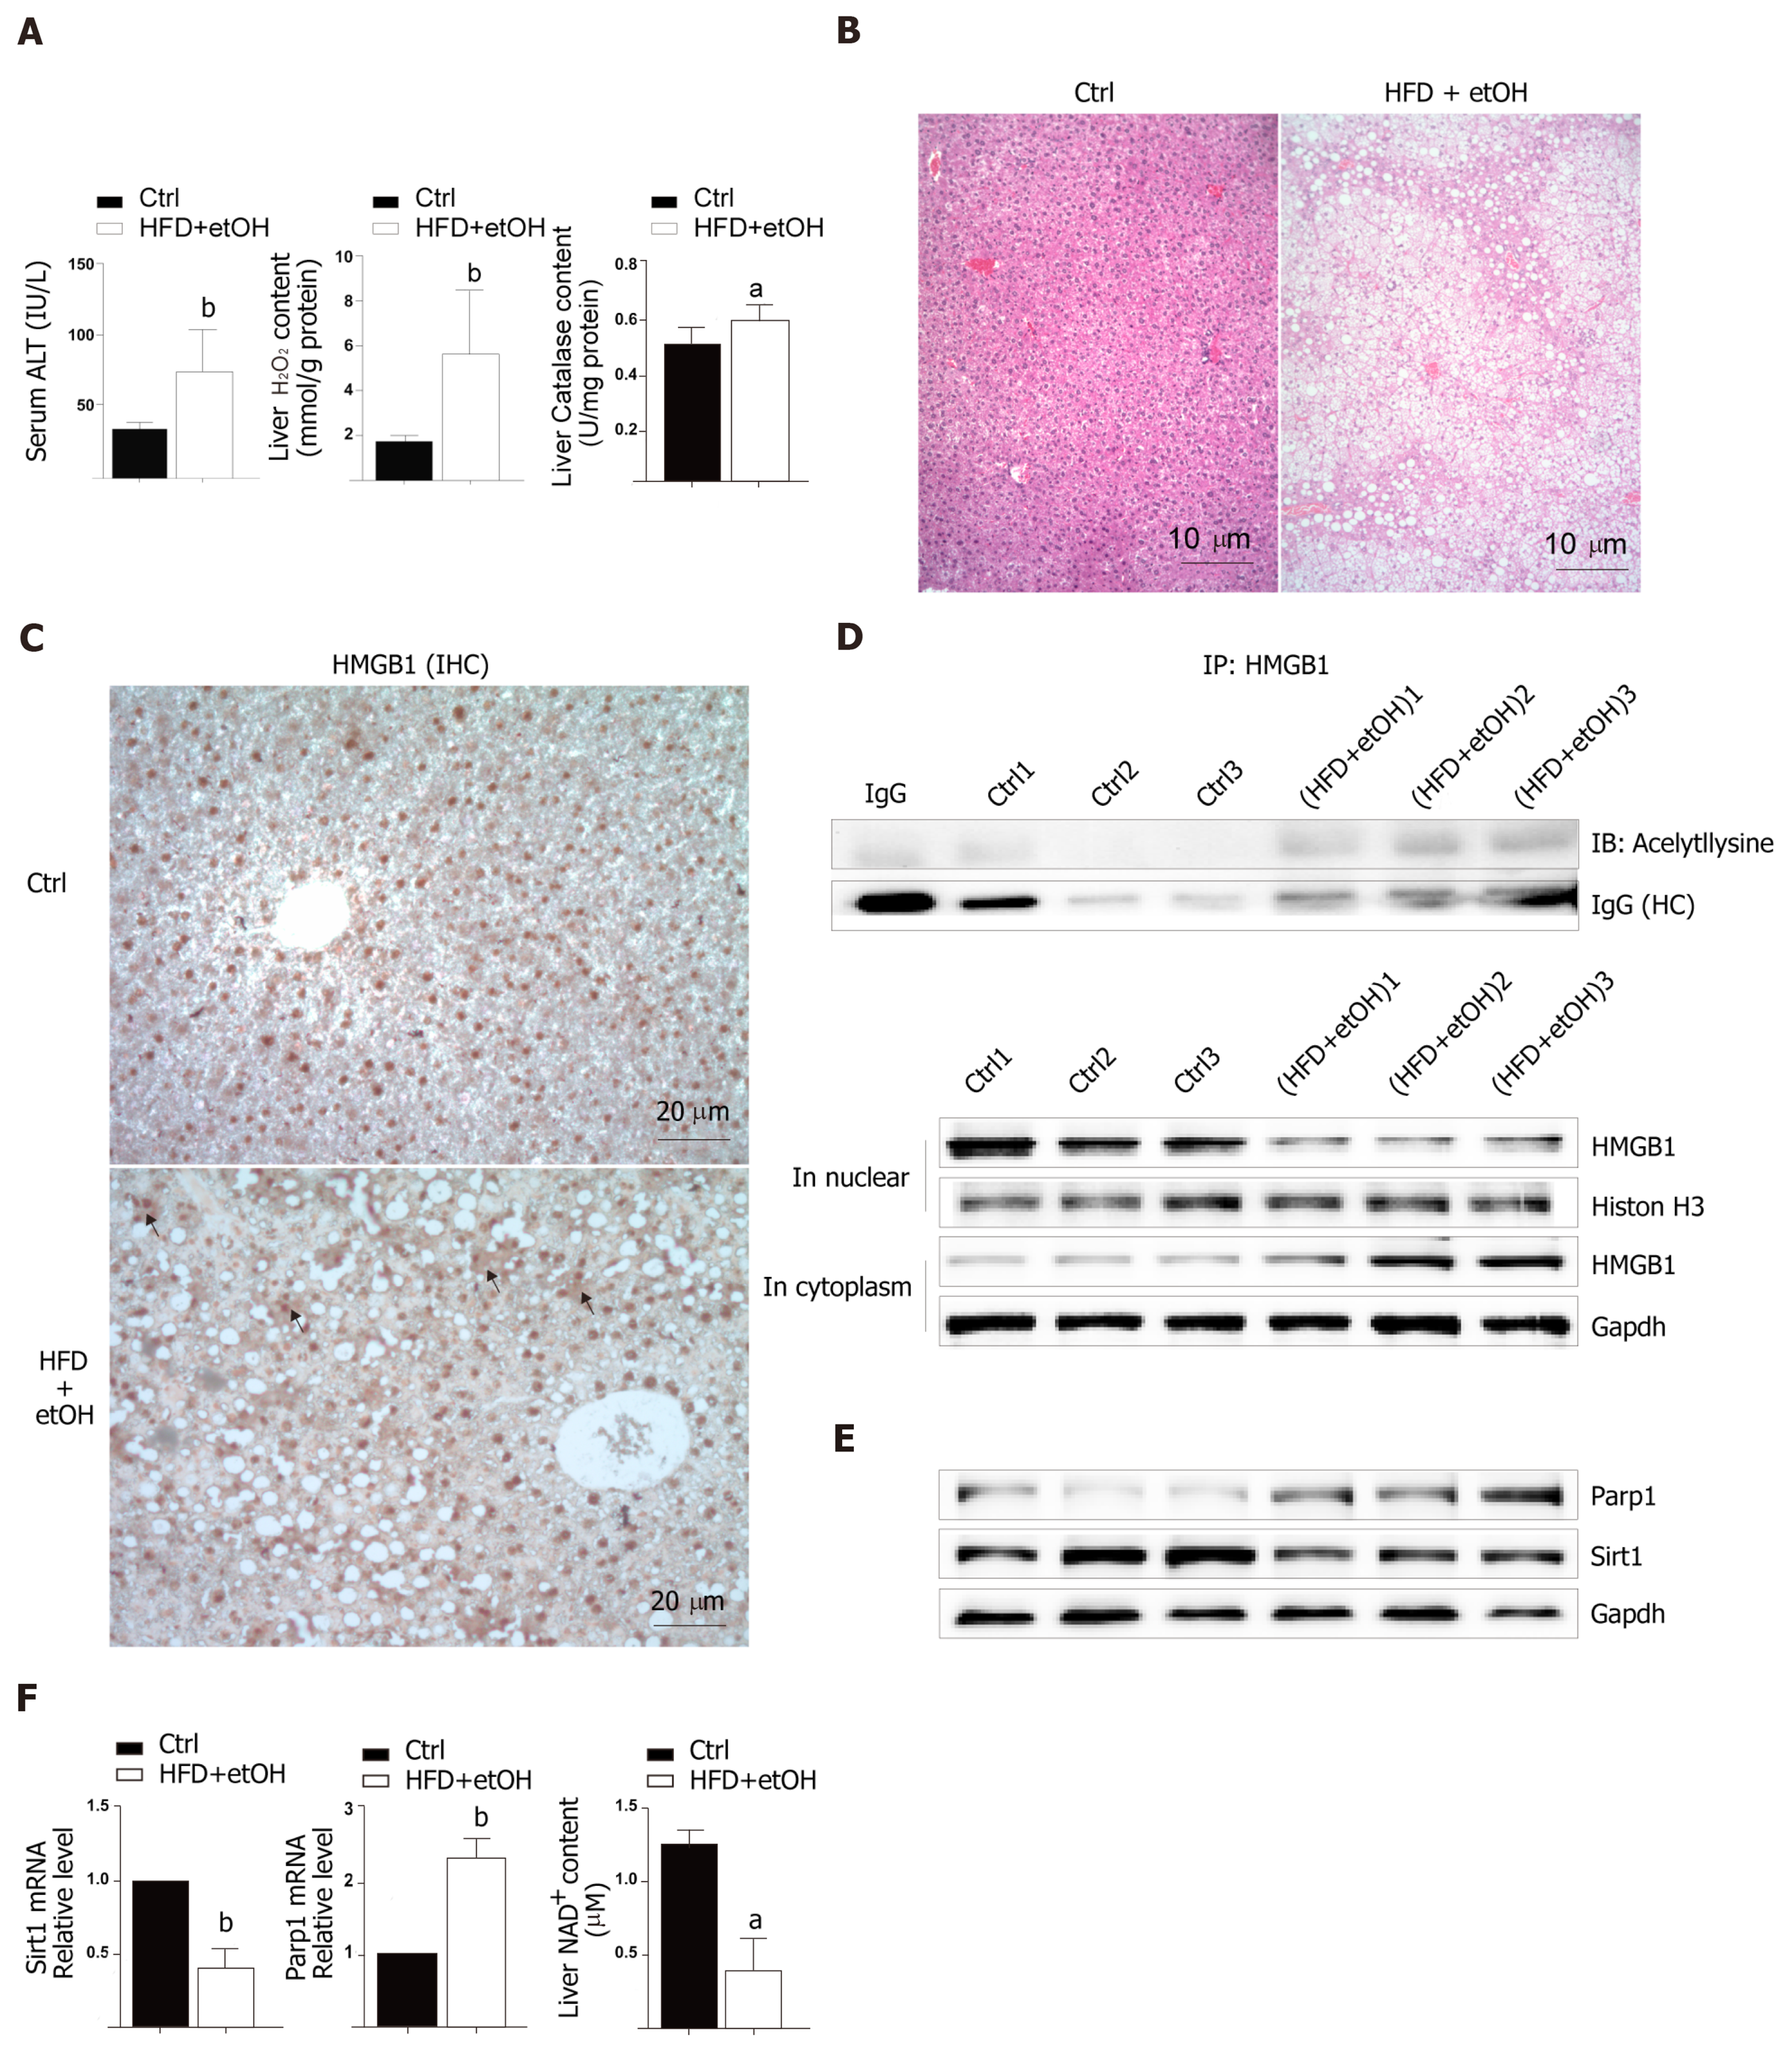
Figure 1 Hepatocellular injury in mice treated with a high-fat diet plus single binge alcohol.
A: Serum levels of alanine aminotransferase and the levels of H2O2 and catalase in C57BL/6 mice fed a control diet for 12 wk or a high-fat diet plus single binge alcohol (n = 12); B: Hematoxylin-eosin stained images (scale bar = 10 μm); C: High mobility group box-1 (HMGB1) staining (scale bar = 20 μm). The black arrow shows HMGB1 translocation; D and E: Western blot analysis for Parp1, Sirt1, and HMGB1 in whole tissue and HMGB1 in the cytoplasm or in nucleus. HMGB1 acetylation was detected by immunoprecipitation; F: The mRNA expression of Parp1 and Sirt1 by real-time PCR and liver NAD+ content. All data were presented as mean ± SD. Statistical analysis was done by the Student’s t-test. aP < 0.05 vs control, bP < 0.01 vs control, cP < 0.01 vs control. HFD/etOH: High-fat diet plus single binge alcohol; ALT: Alanine aminotransferase; HMGB1: High mobility group box-1; IP: Immunoprecipitation.
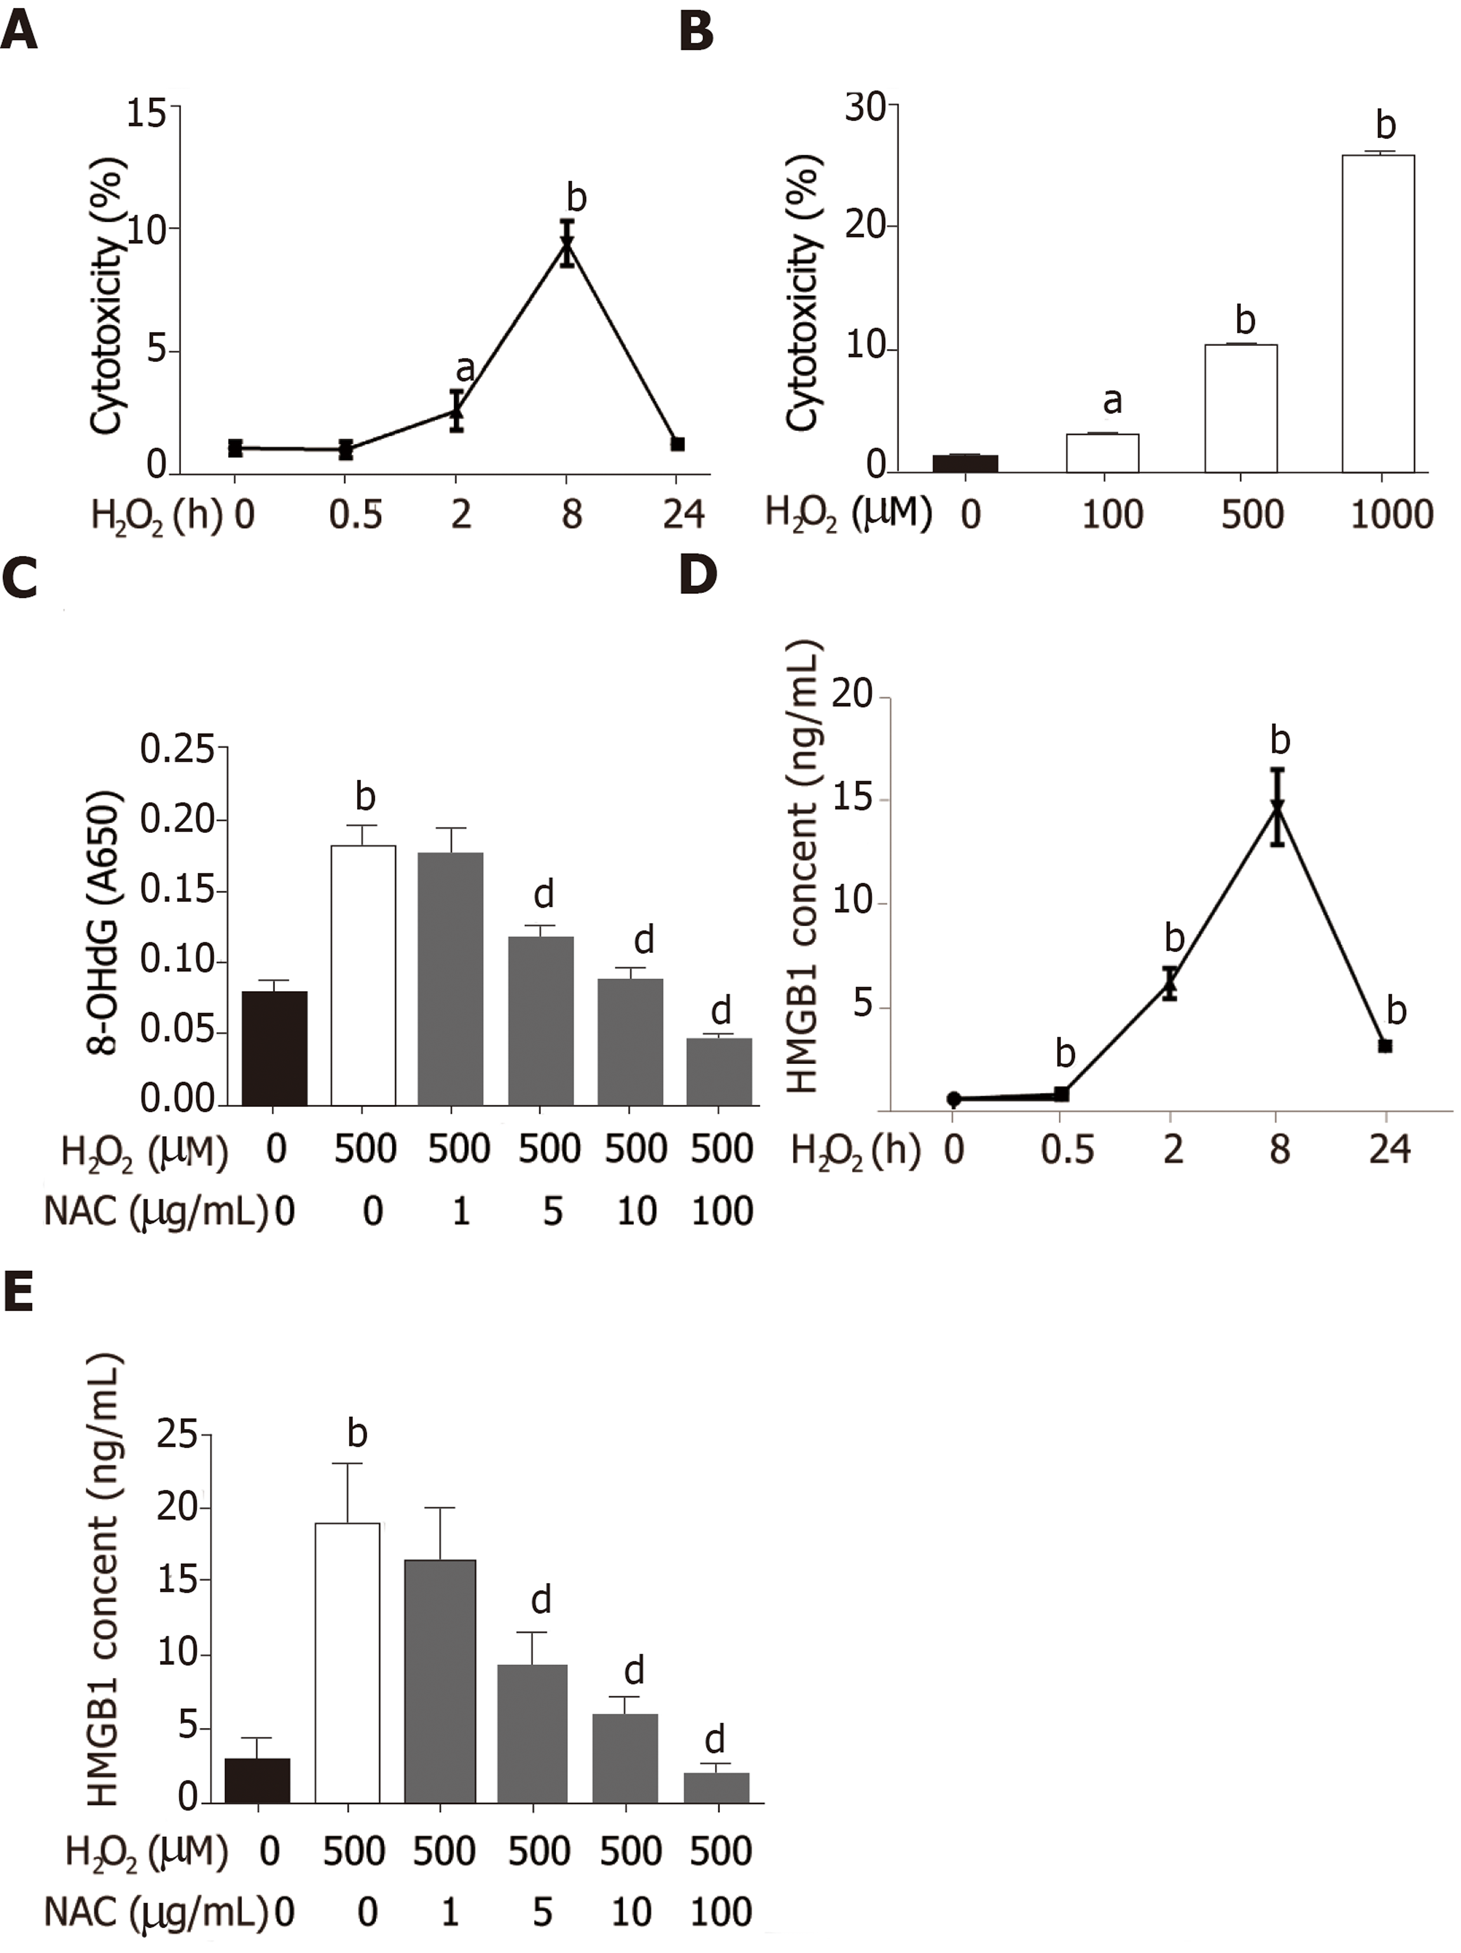
Figure 2 Cytotoxicity increase and high mobility group box-1 release induced by H2O2 in BNL CL cells.
A and B: BNL CL2 cells cultured with H2O2 for 0, 0.5, 2, 8, or 24 h or at different concentrations (0, 100, 500, and 1000 μmol/L); C: 8-hydroxy-2-deoxyguanosine levels in cells treated with 500 μmol/L H2O2 or N-acetylcysteine (NAC); D: High mobility group box-1 (HMGB1) content in medium detected by ELISA; E: Cells were treated with 500 μM H2O2 for different time intervals HMGB1 content in medium detected by ELISA. Cells were pre-treated with NAC for 24 h, and then incubated with or without H2O2 (500 μmol/L) for 8 h. All data are presented as the mean ± SD. Statistical analysis was done by the Student’s t-test. aP < 0.05 vs 0 group, bP < 0.01 vs 0 group, dP < 0.01 vs H2O2 group. 8-HOdG: 8-hydroxy-2-deoxyguanosine; NAC: N-acetylcysteine; HMGB1: High mobility group box-1.
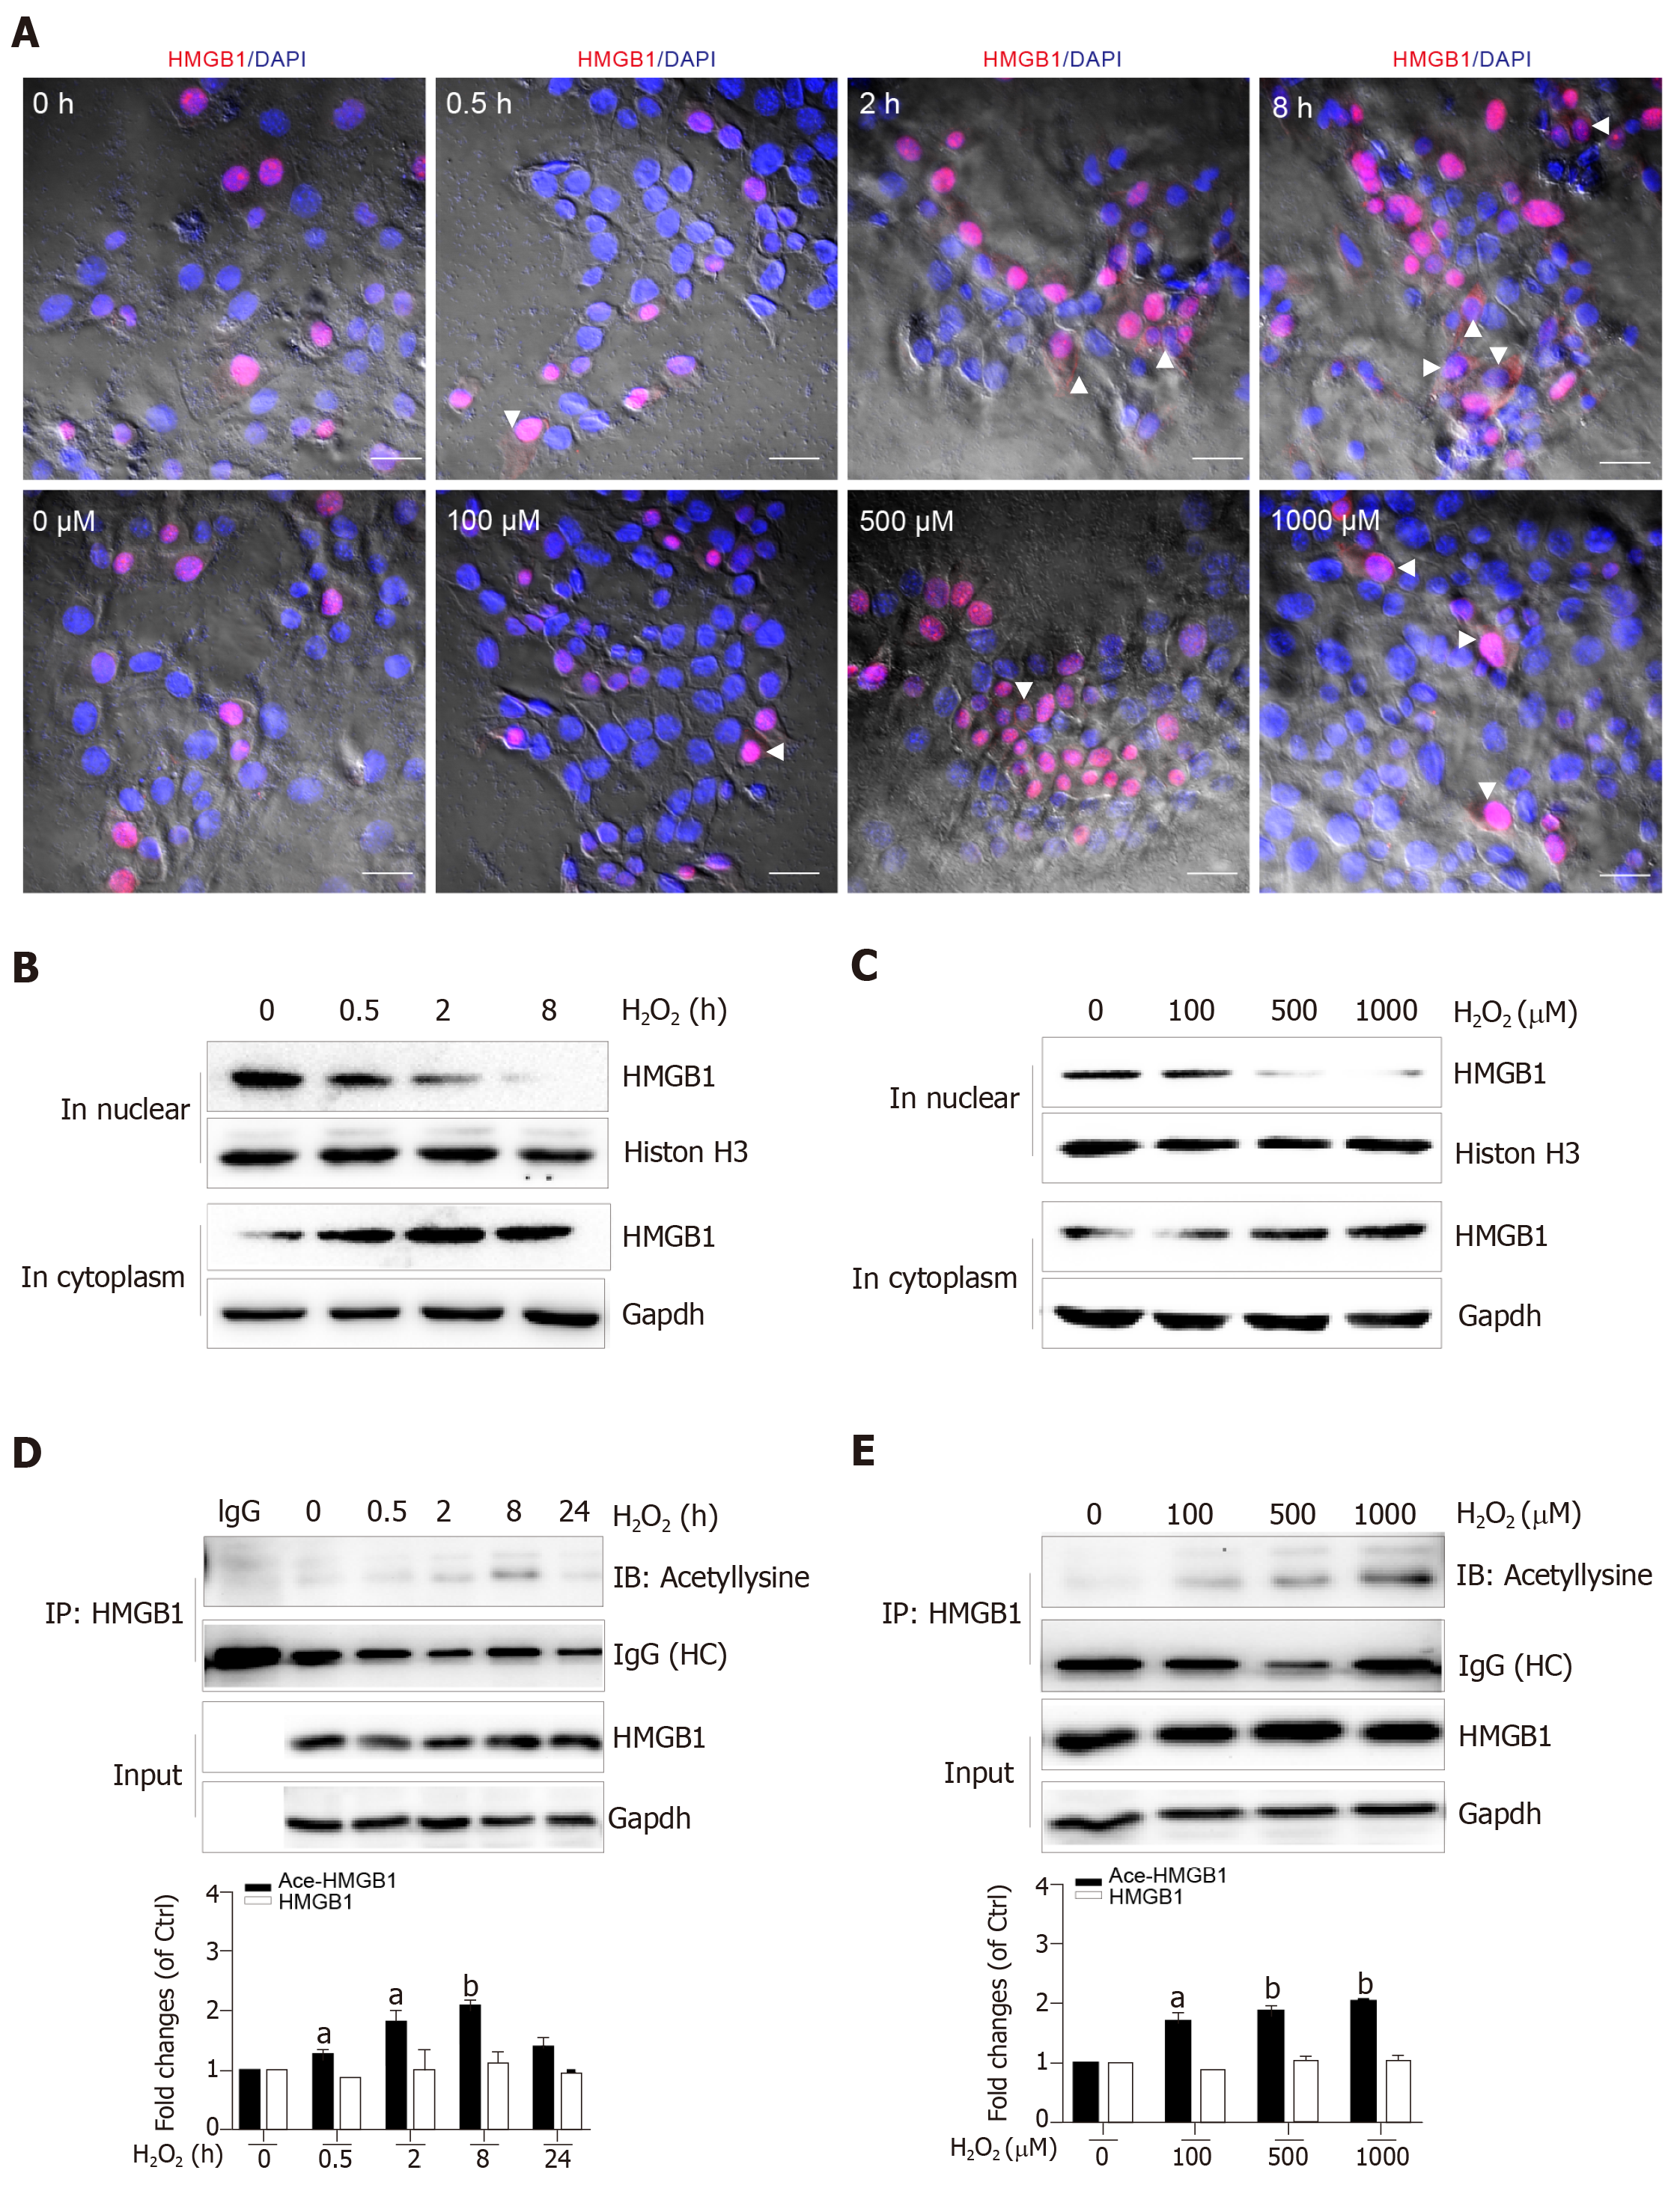
Figure 3 H2O2 induced high mobility group box-1 translocation and acetylation.
A: Confocal microscopy analysis of cells treated with H2O2 either for different durations or at different concentrations. (scale bar = 40 μm). The white arrow shows the translocation of high mobility group box-1 (HMGB1) to the cytoplasm; B and C: HMGB1 expression determined by Western blot; D and E: Acetylated HMGB1 determined by immunoprecipitation. All data are presented as the mean ± SD. Statistical analysis was done by the Student’s t-test. aP < 0.05 vs 0 group, bP < 0.01 vs 0 group. HMGB1: High mobility group box-1.
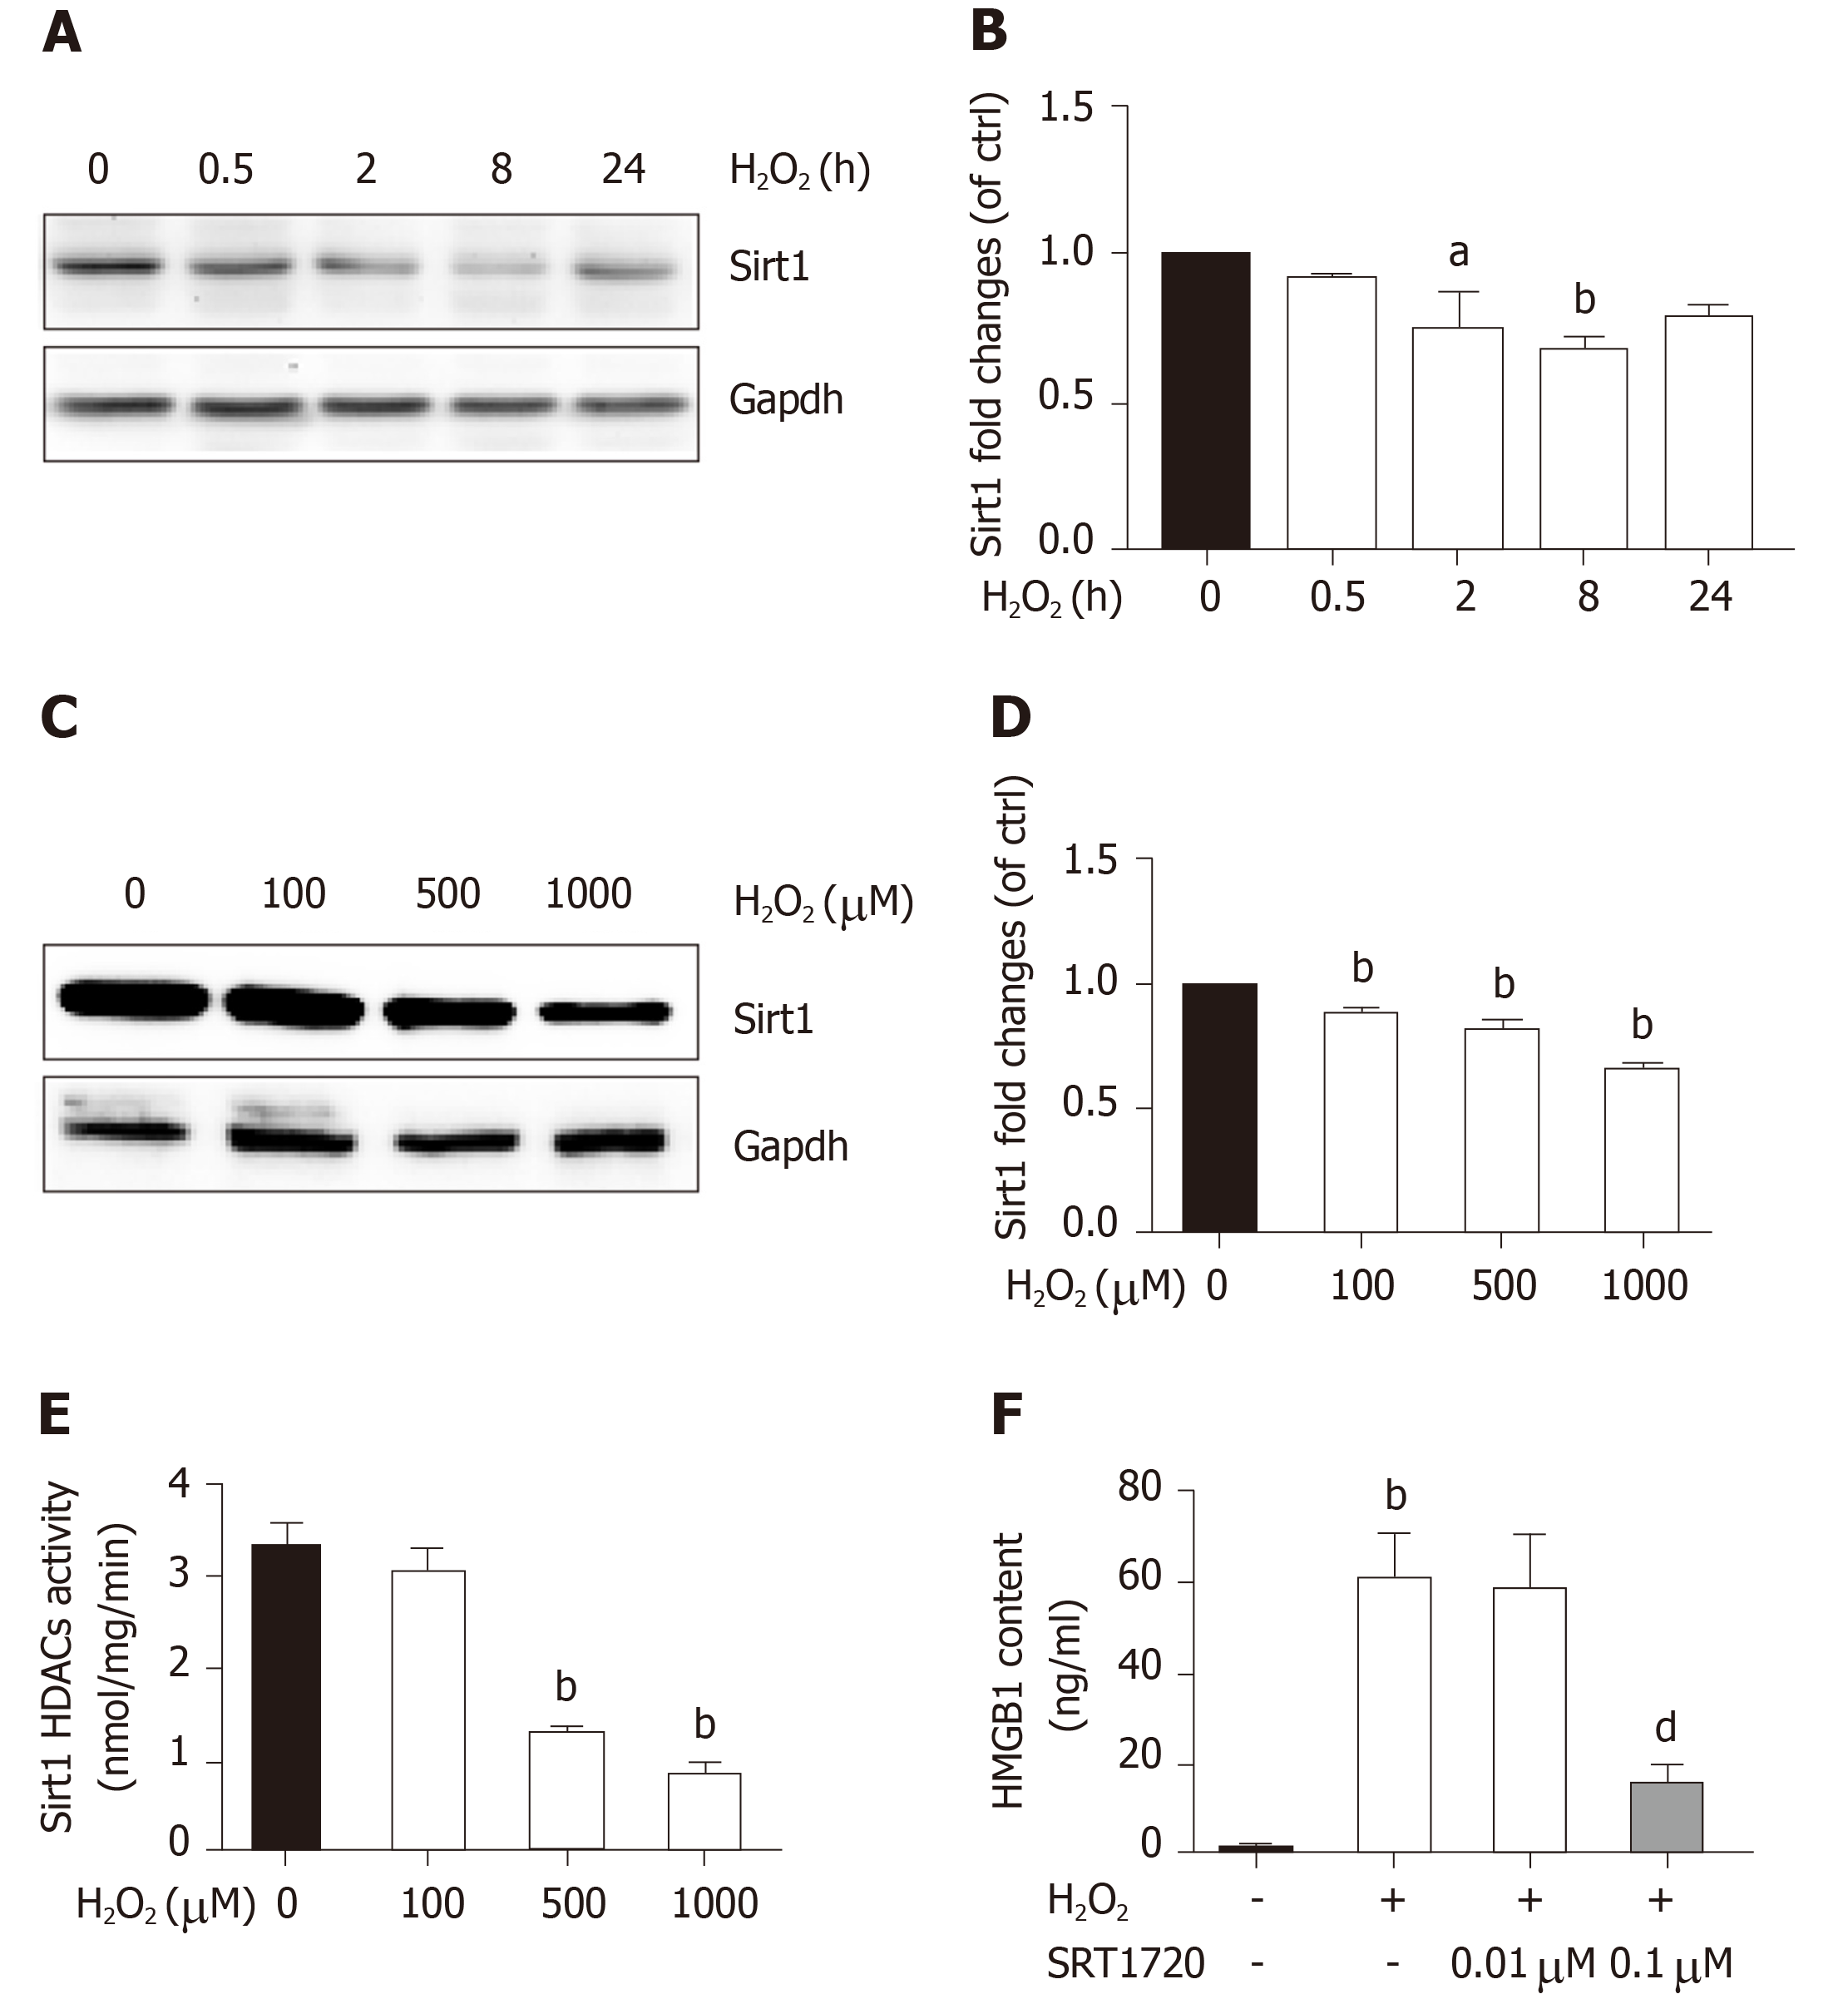
Figure 4 H2O2 treatment inhibits Sirt1 expression and activity.
A and B: BNL CL2 cells were treated with H2O2 for 0-24 h at 500 μmol/L. Sirt1 levels determined by Western blot; C and D: BNL CL2 cells were treated with H2O2 at 0-1000 μmol/L for 8 h. Sirt1 levels determined by Western blot; E: Sirt1 deacetylase activity detected by fluorescence spectrophotometry; F: BNL CL2 cells were treated with H2O2 (500 μmol/L) for 4 h, and then SRT1720, a Sirt1 activator, was added into the medium. The supernatants were collected to determinate high mobility group box-1 content by ELISA. All data are presented as the mean ± SD. Statistical analysis was done by the Student’s t-test. aP < 0.05 vs 0 group, bP < 0.01 vs 0 group or negative control, dP < 0.01 vs H2O2 group. HMGB1: High mobility group box-1.
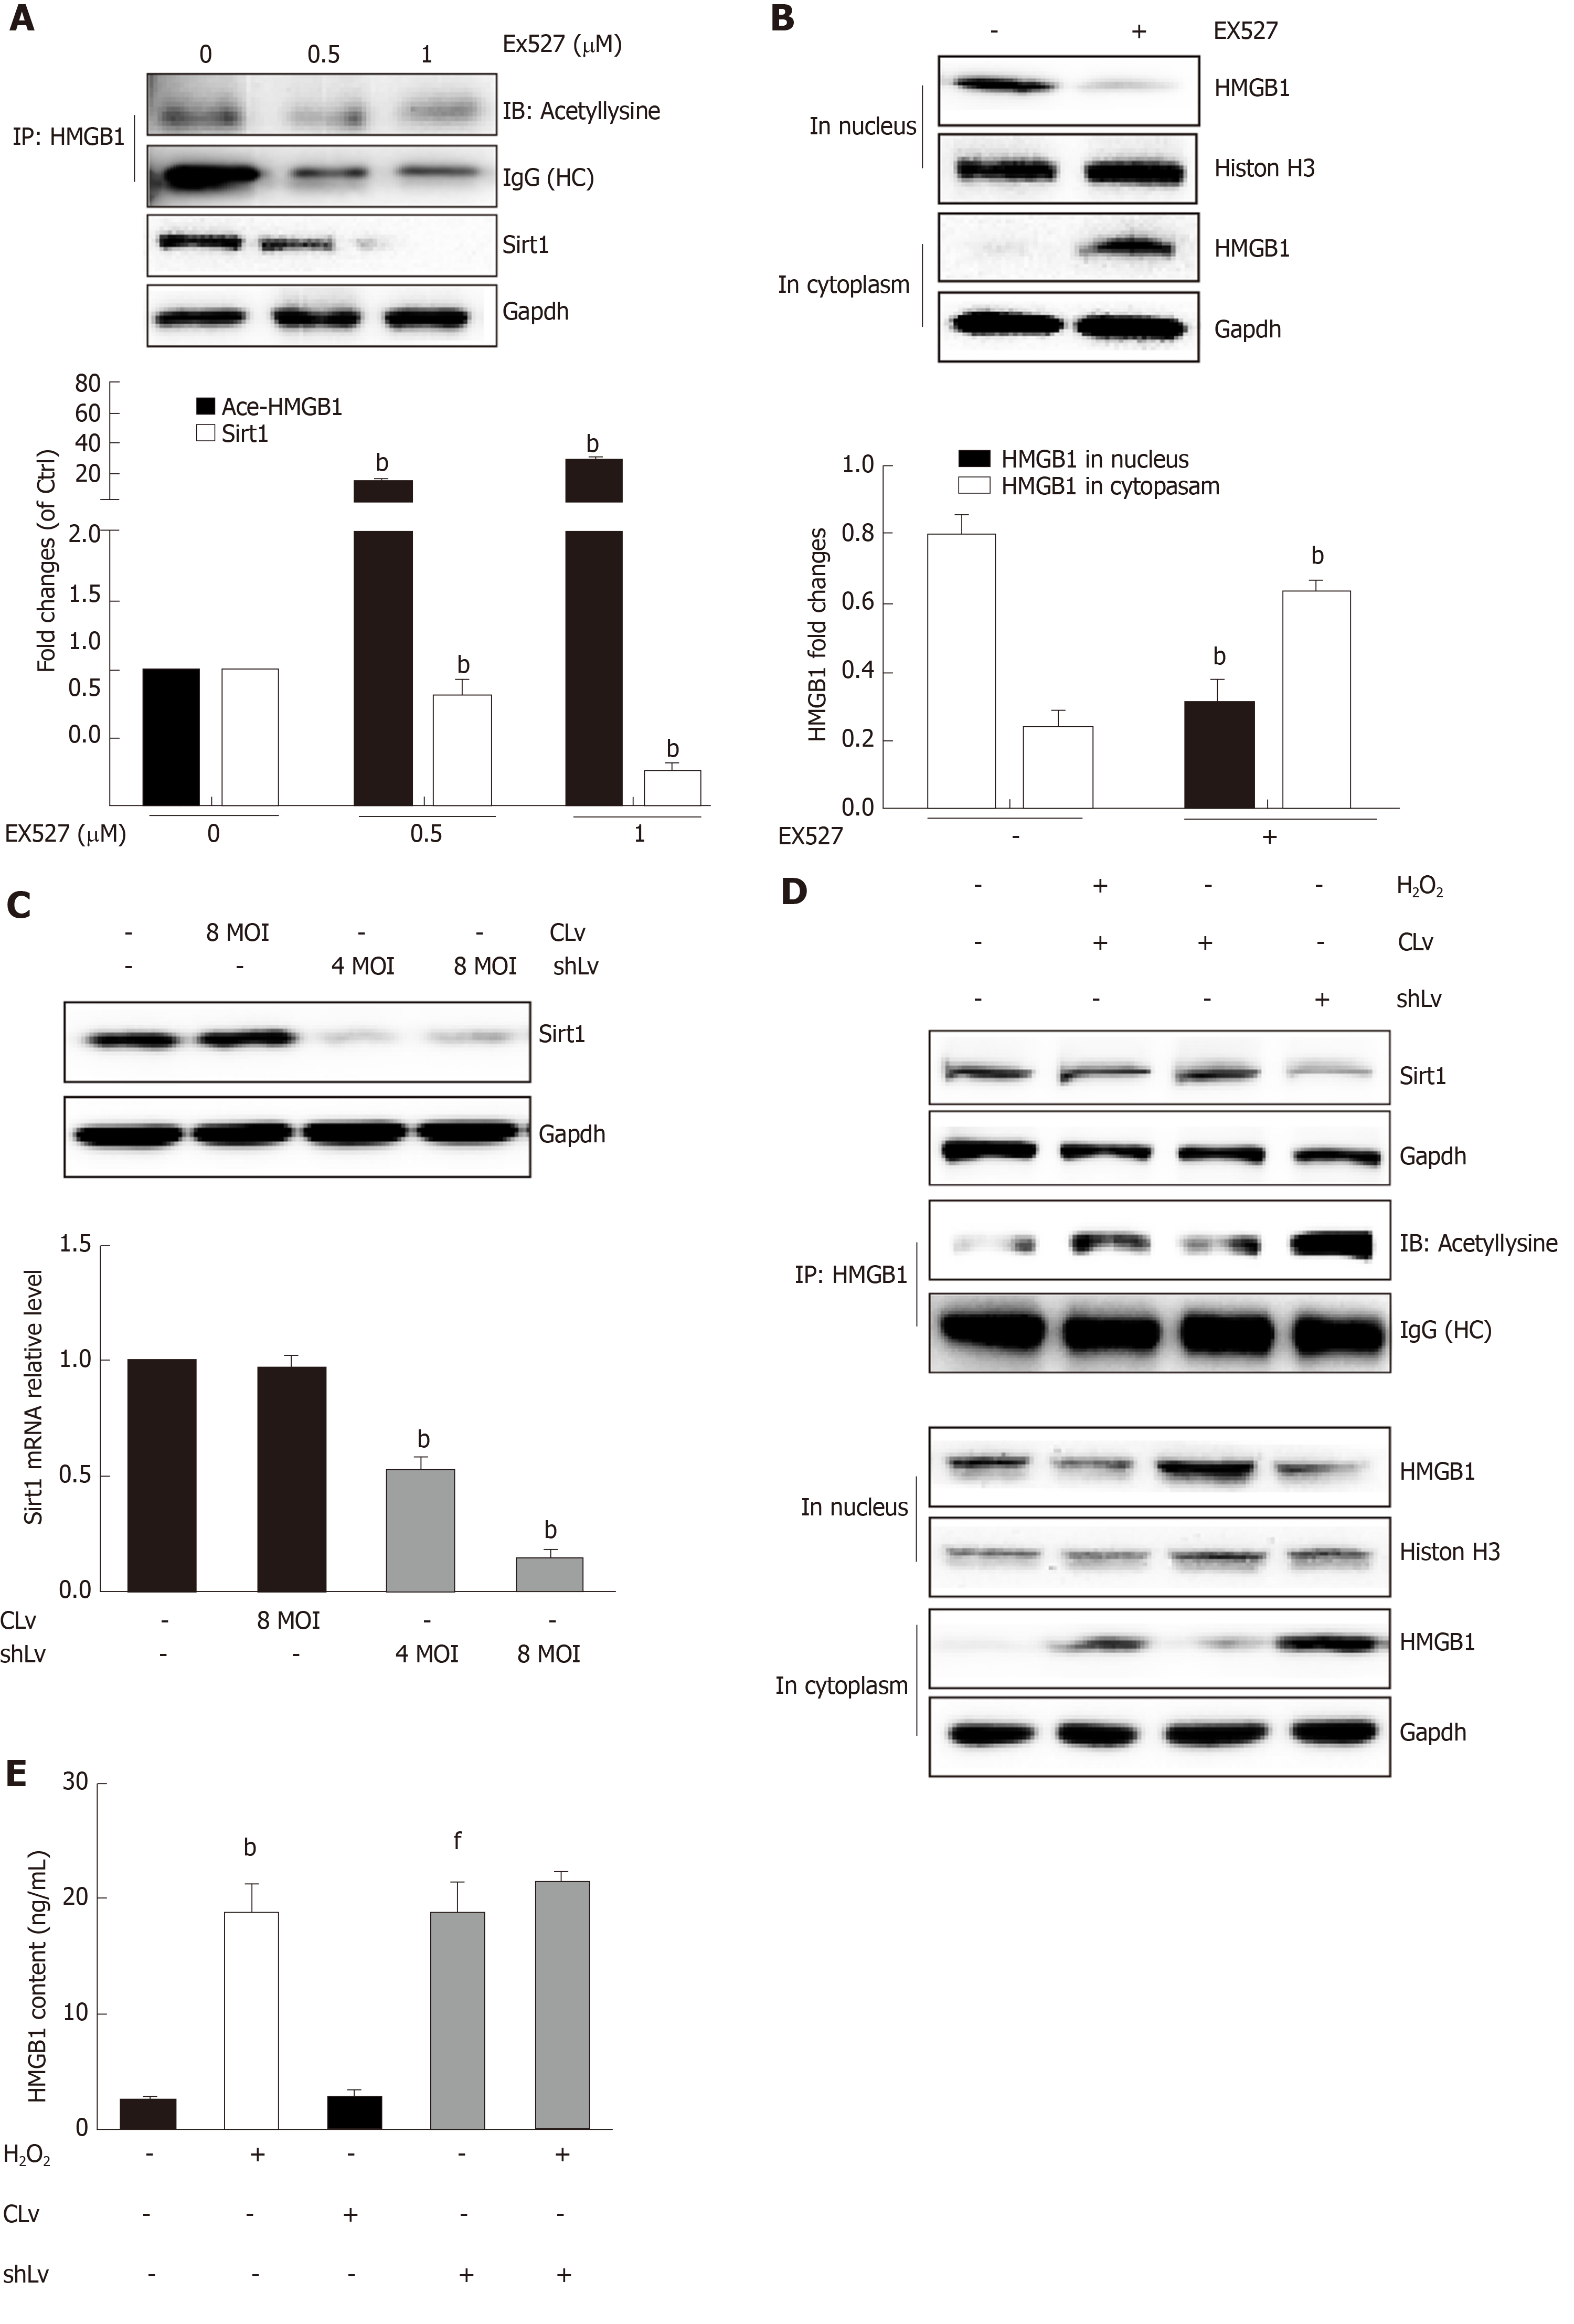
Figure 5 Sirt1 inhibits high mobility group box-1 translocation and release.
A: Acetylated HMGB1 levels determined by immunoprecipitation. EX527, a Sirt1 inhibitor inhibited sirt1 level and promoted HMGB1 acetylation; B: High mobility group box-1 (HMGB1) expression in the nucleus or cytoplasm determined by Western blot; C: The mRNA and protein levels of Sirt1. BNL CL2 cells were transfected with control lentiviral vector or Sirt1 shRNA lentiviral vector for 48 h. The mRNA and protein levels of Sirt1 were detected by real-time PCR and Western blot. Multiplicity of infection, refers to the number of lent virus adsorption on the cells and the ratio of the number of cells in culture; D: HMGB1 translocation; E: HMGB1 content in medium determined by ELISA. All data are presented as the mean ± SD. Statistical analysis was done by the Student’s t-test. bP < 0.01 vs 0 group or negative control, fP < 0.01 vs control lent viral group. MOI: Multiplicity of infection; HMGB1: High mobility group box-1.
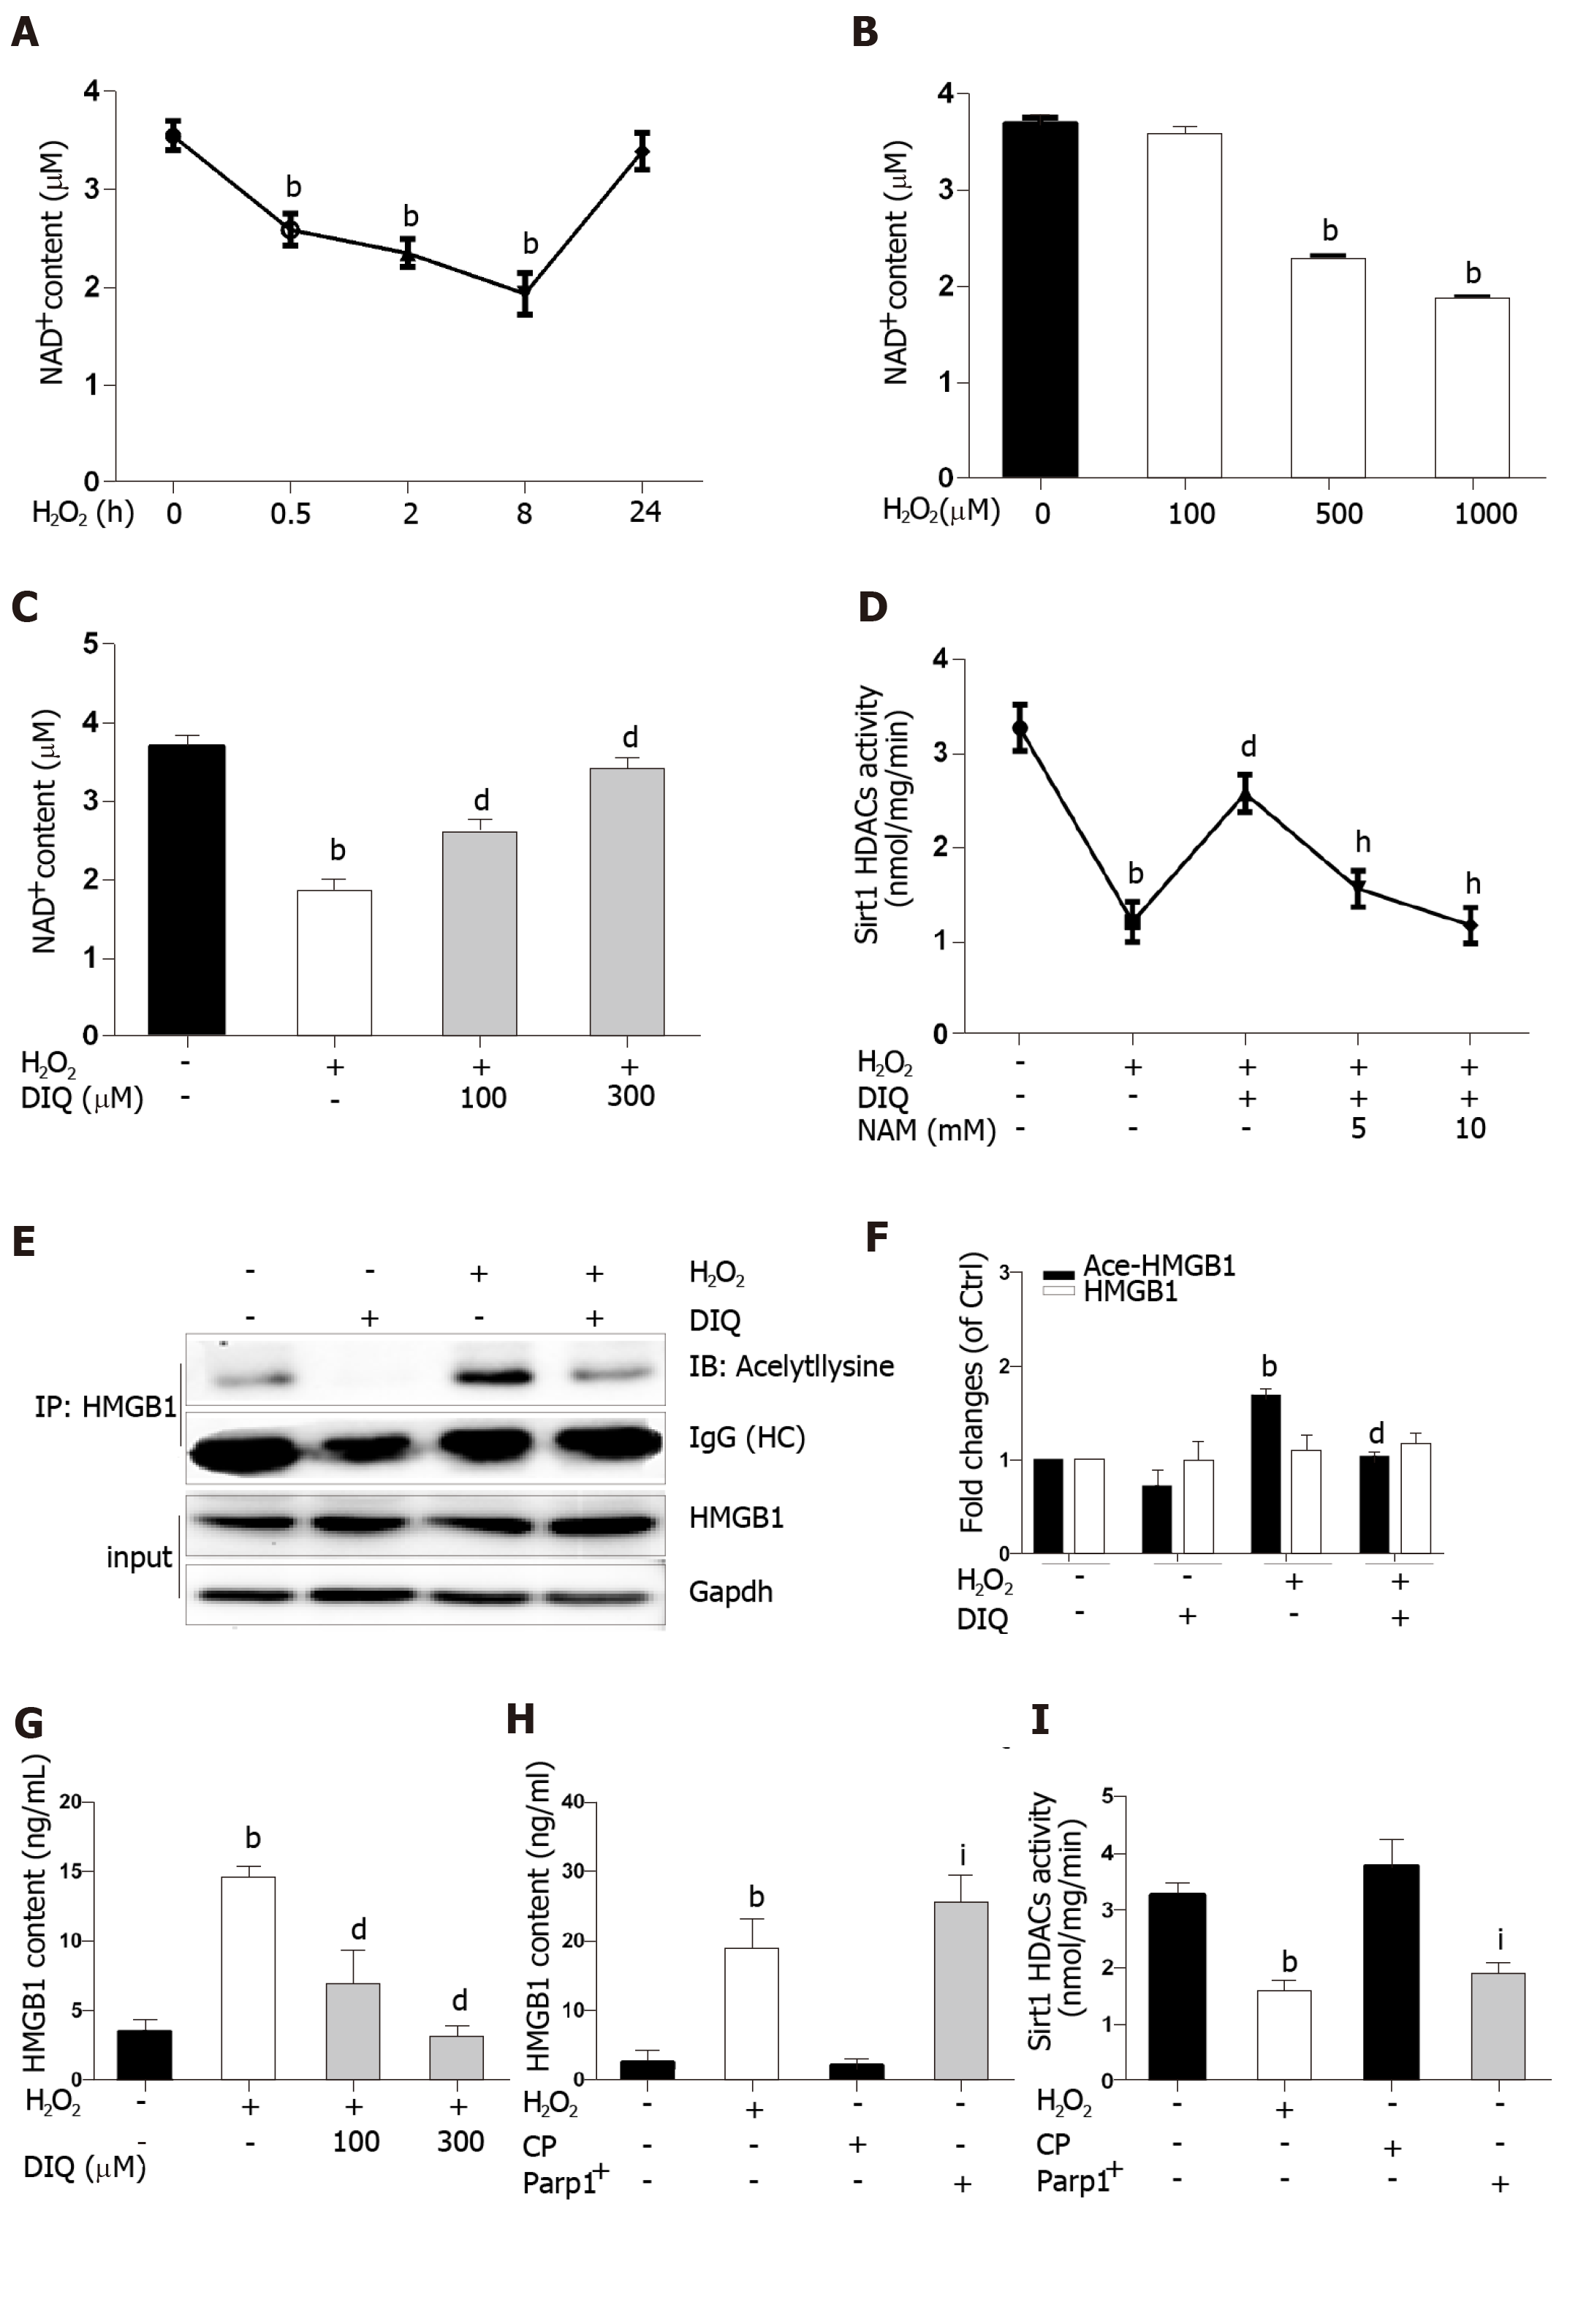
Figure 6 Sirt1 activity is inhibited by H2O2 through Parp1-NAD+.
A and B: NAD+ contents in cells treated with H2O2 for different durations or at different concentrations; C: NAD+ contents in cells treated with DIQ, a Parp1 inhibitor; D: Sirt1 activity in cells treated with DIQ and NAM, an NAD+ inhibitor; E and F: High mobility group box-1 (HMGB1) acetylation in cells treated with DIQ; G: BNL CL2 cells were treated with DIQ or H2O2. And then HMGB1 contents in medium determined by ELISA; H: HMGB1 contents in medium determined by ELISA in cells treated with CP or Parp1+ transfection; I: Sirt1 activity of cells with Parp1+ transfection. All data are presented as the mean ± SD. Statistical analysis was done by the Student’s t-test. bP < 0.01 vs 0 group or negative control, dP < 0.01 vs H2O2 group, hP < 0.01 vs H2O2 + DIQ group, iP < 0.01 vs CP group. CP: Control Plasmid.
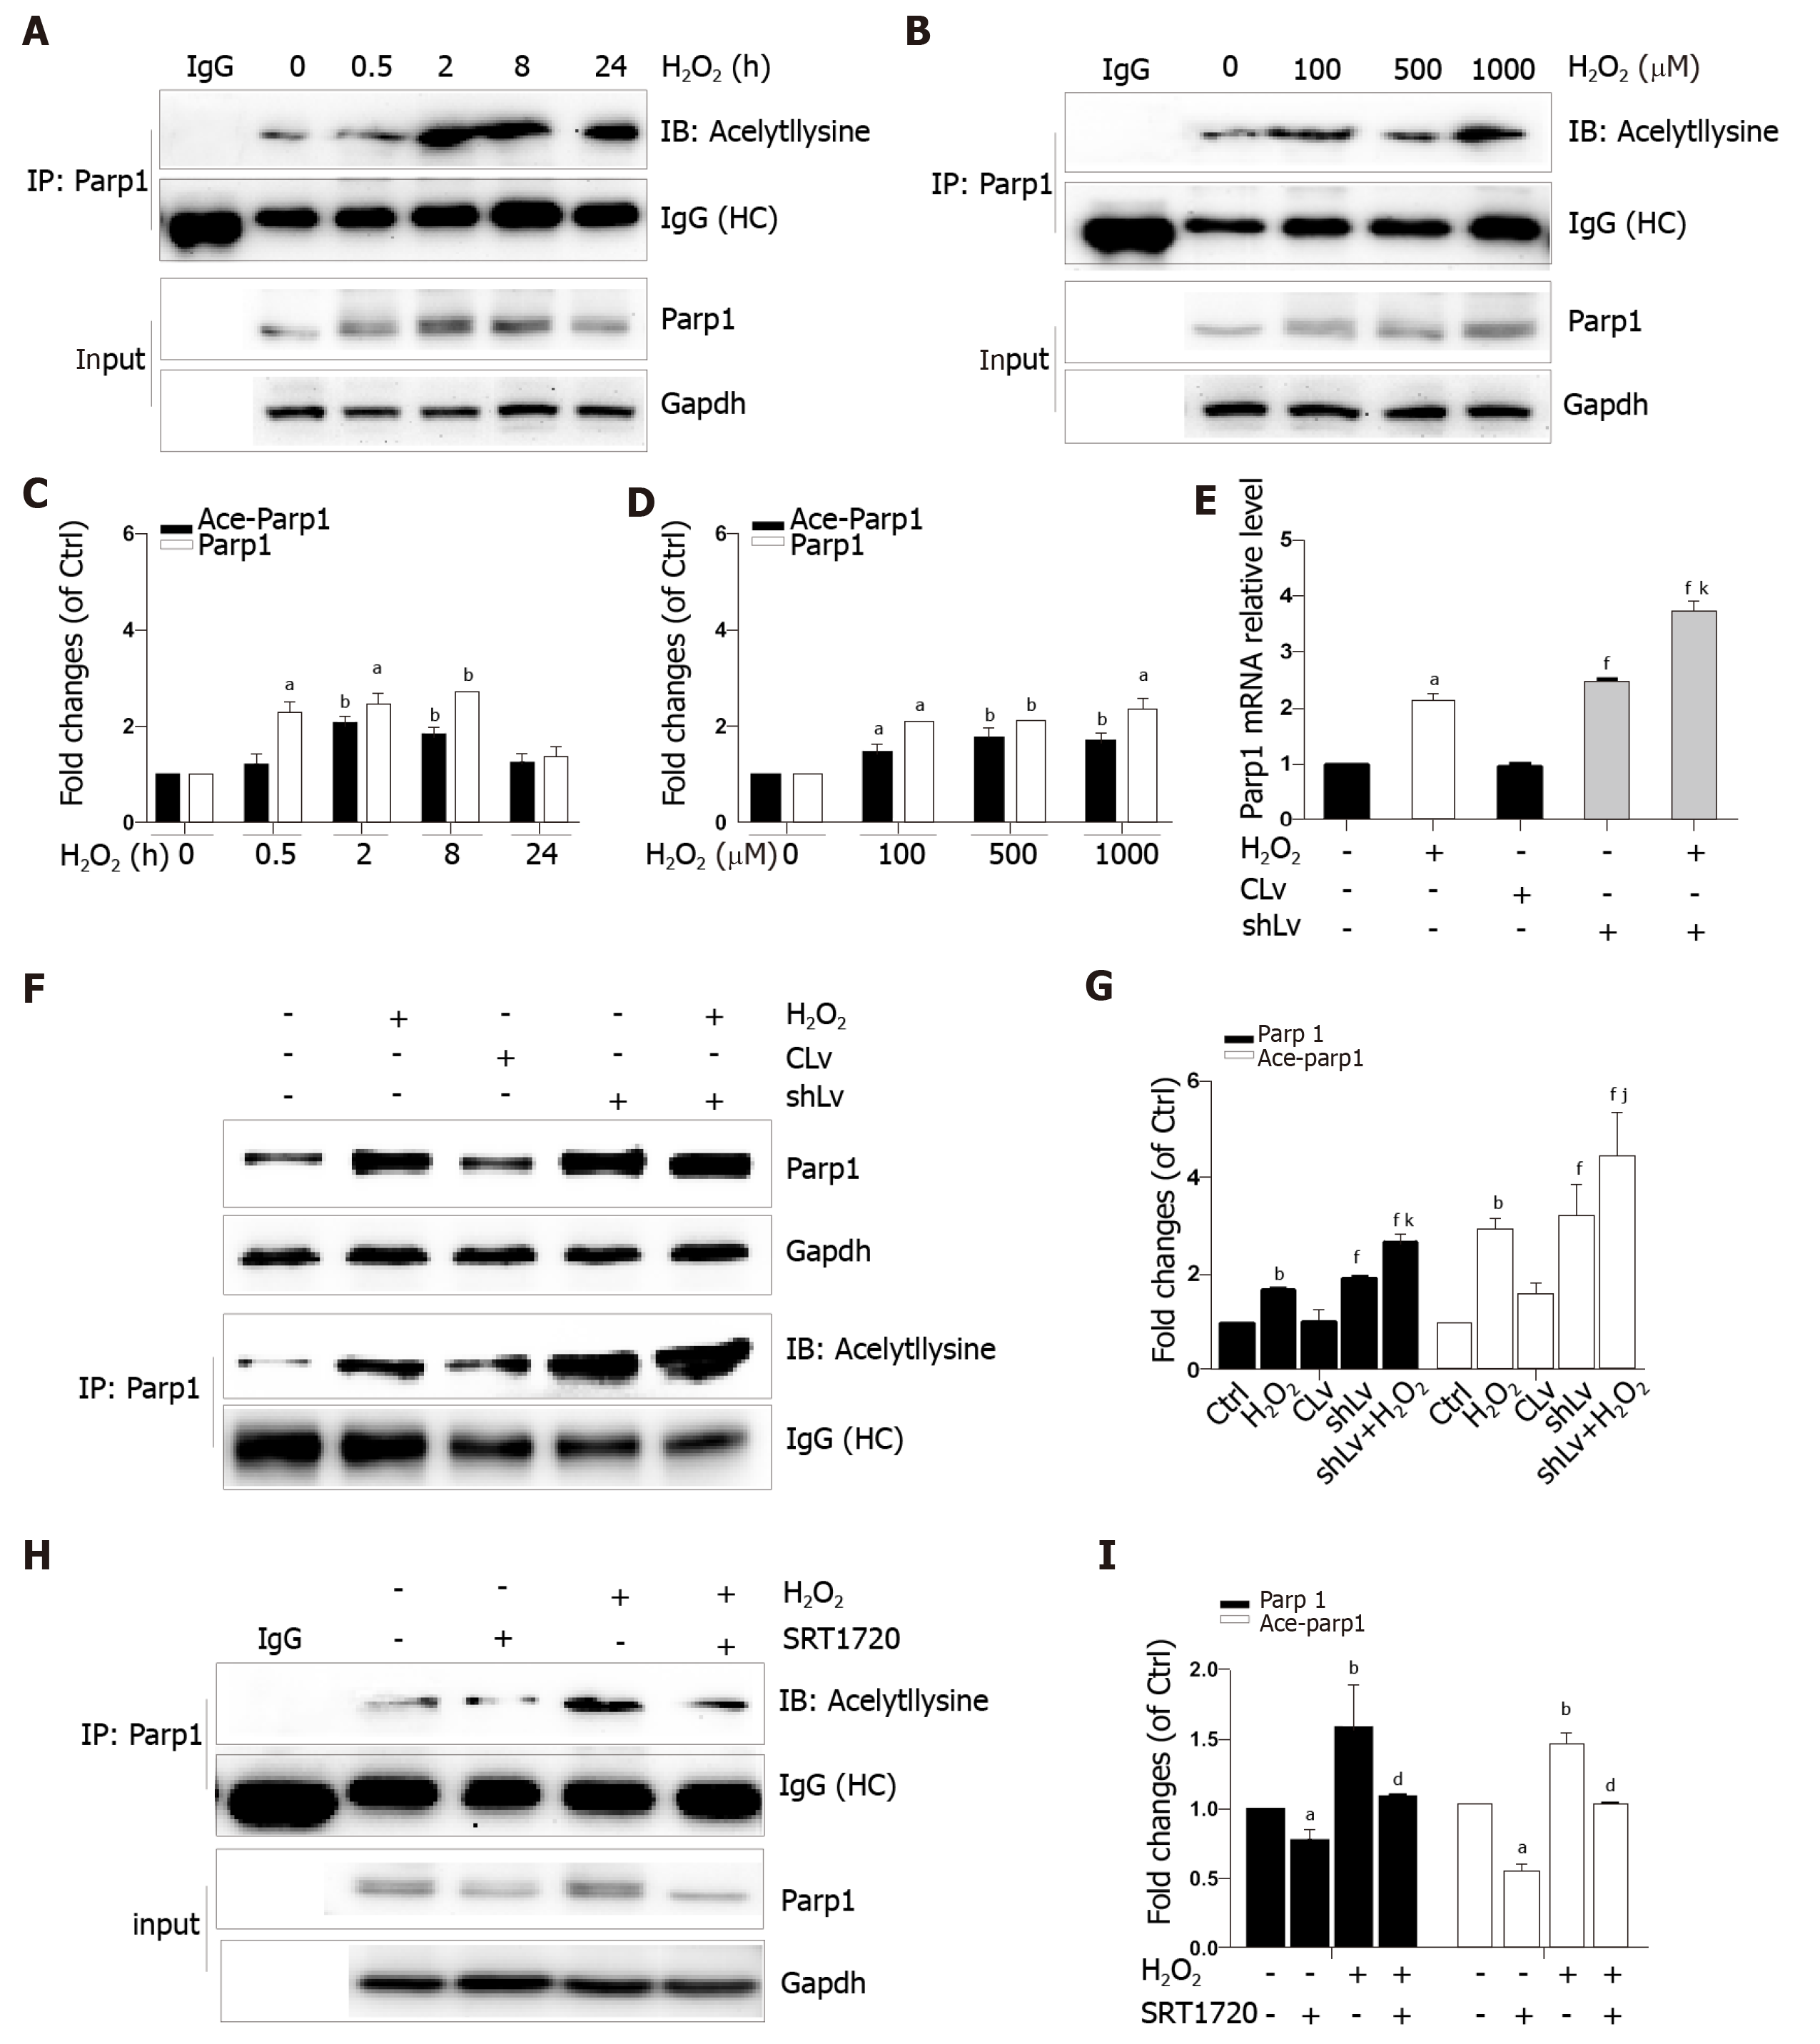
Figure 7 Sirt1 inhibits Parp1 expression and acetylation in BNL CL2 cells.
A-D: Parp1 expression and acetylation in cells treated with H2O2 for different durarions or at different concentrations; E: The mRNA levels of Parp1 in Sirt1 knockdown cells treated with H2O2; F and G: Parp1 expression and acetylation in Sirt1 knockdown cells treated with H2O2; H and I: Parp1 expression and acetylation in cells treated with SRT1720, a Sirt1 activator. All data are presented as the mean ± SD. Statistical analysis was done by the Student’s t-test. aP < 0.05 vs 0 group or negative control, bP < 0.01 or negative control, dP < 0.01 vs H2O2 group, fP < 0.01 vs CLv group, jP < 0.05 vs shLv group, kP < 0.01 vs shLv group.
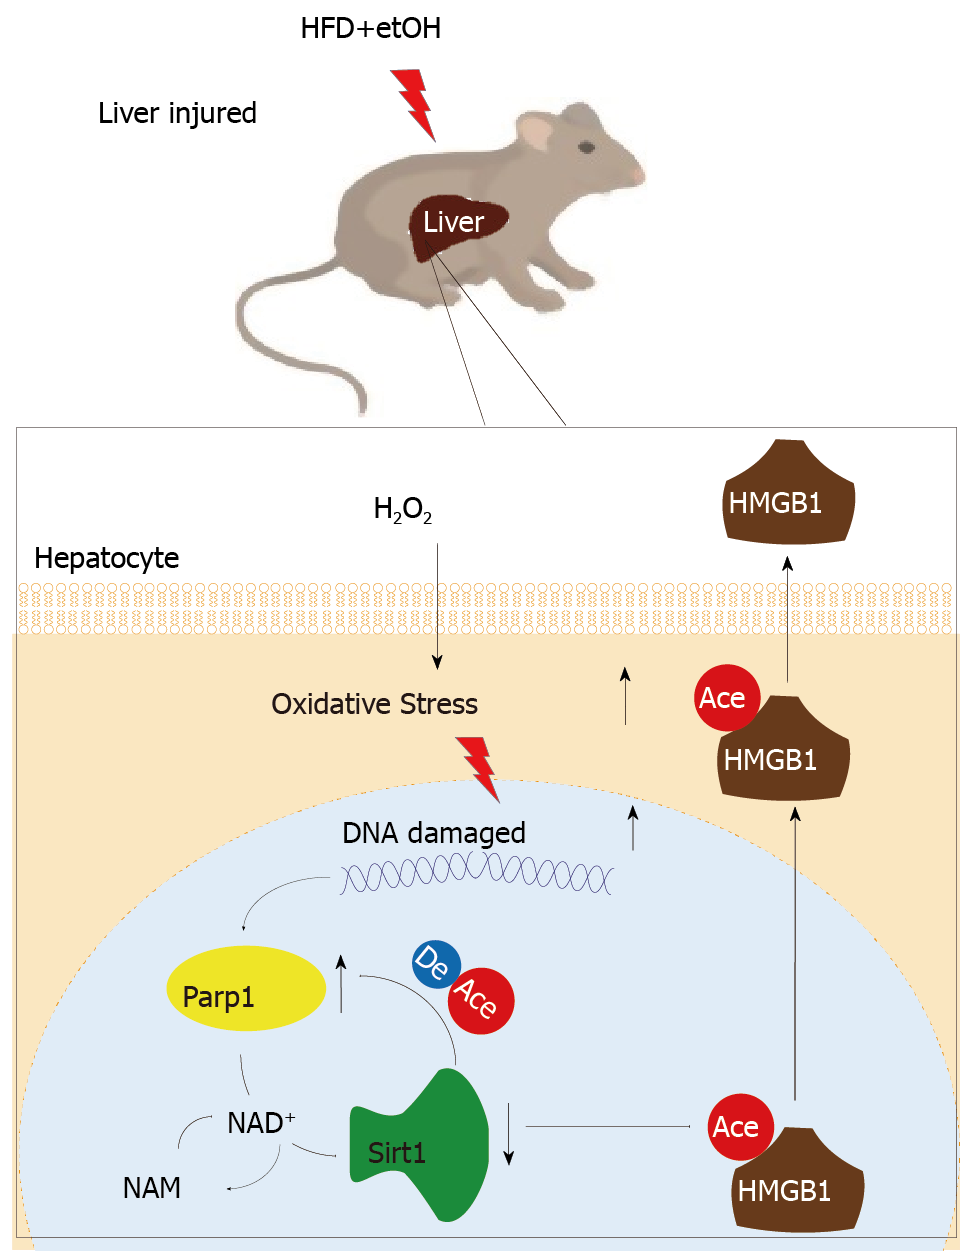
Figure 8 Imbalance of mutual inhibition between Parp1 and Sirt1 causes high mobility group box-1 translocation in hepatocytes.
HFD+etOH: High-fat diet plus ethyl alcohol; HMGB1: High mobility group box-1.
- Citation: Ye TJ, Lu YL, Yan XF, Hu XD, Wang XL. High mobility group box-1 release from H2O2-injured hepatocytes due to sirt1 functional inhibition. World J Gastroenterol 2019; 25(36): 5434-5450
- URL: https://www.wjgnet.com/1007-9327/full/v25/i36/5434.htm
- DOI: https://dx.doi.org/10.3748/wjg.v25.i36.5434


