Copyright
©The Author(s) 2019.
World J Gastroenterol. Sep 14, 2019; 25(34): 5134-5151
Published online Sep 14, 2019. doi: 10.3748/wjg.v25.i34.5134
Published online Sep 14, 2019. doi: 10.3748/wjg.v25.i34.5134
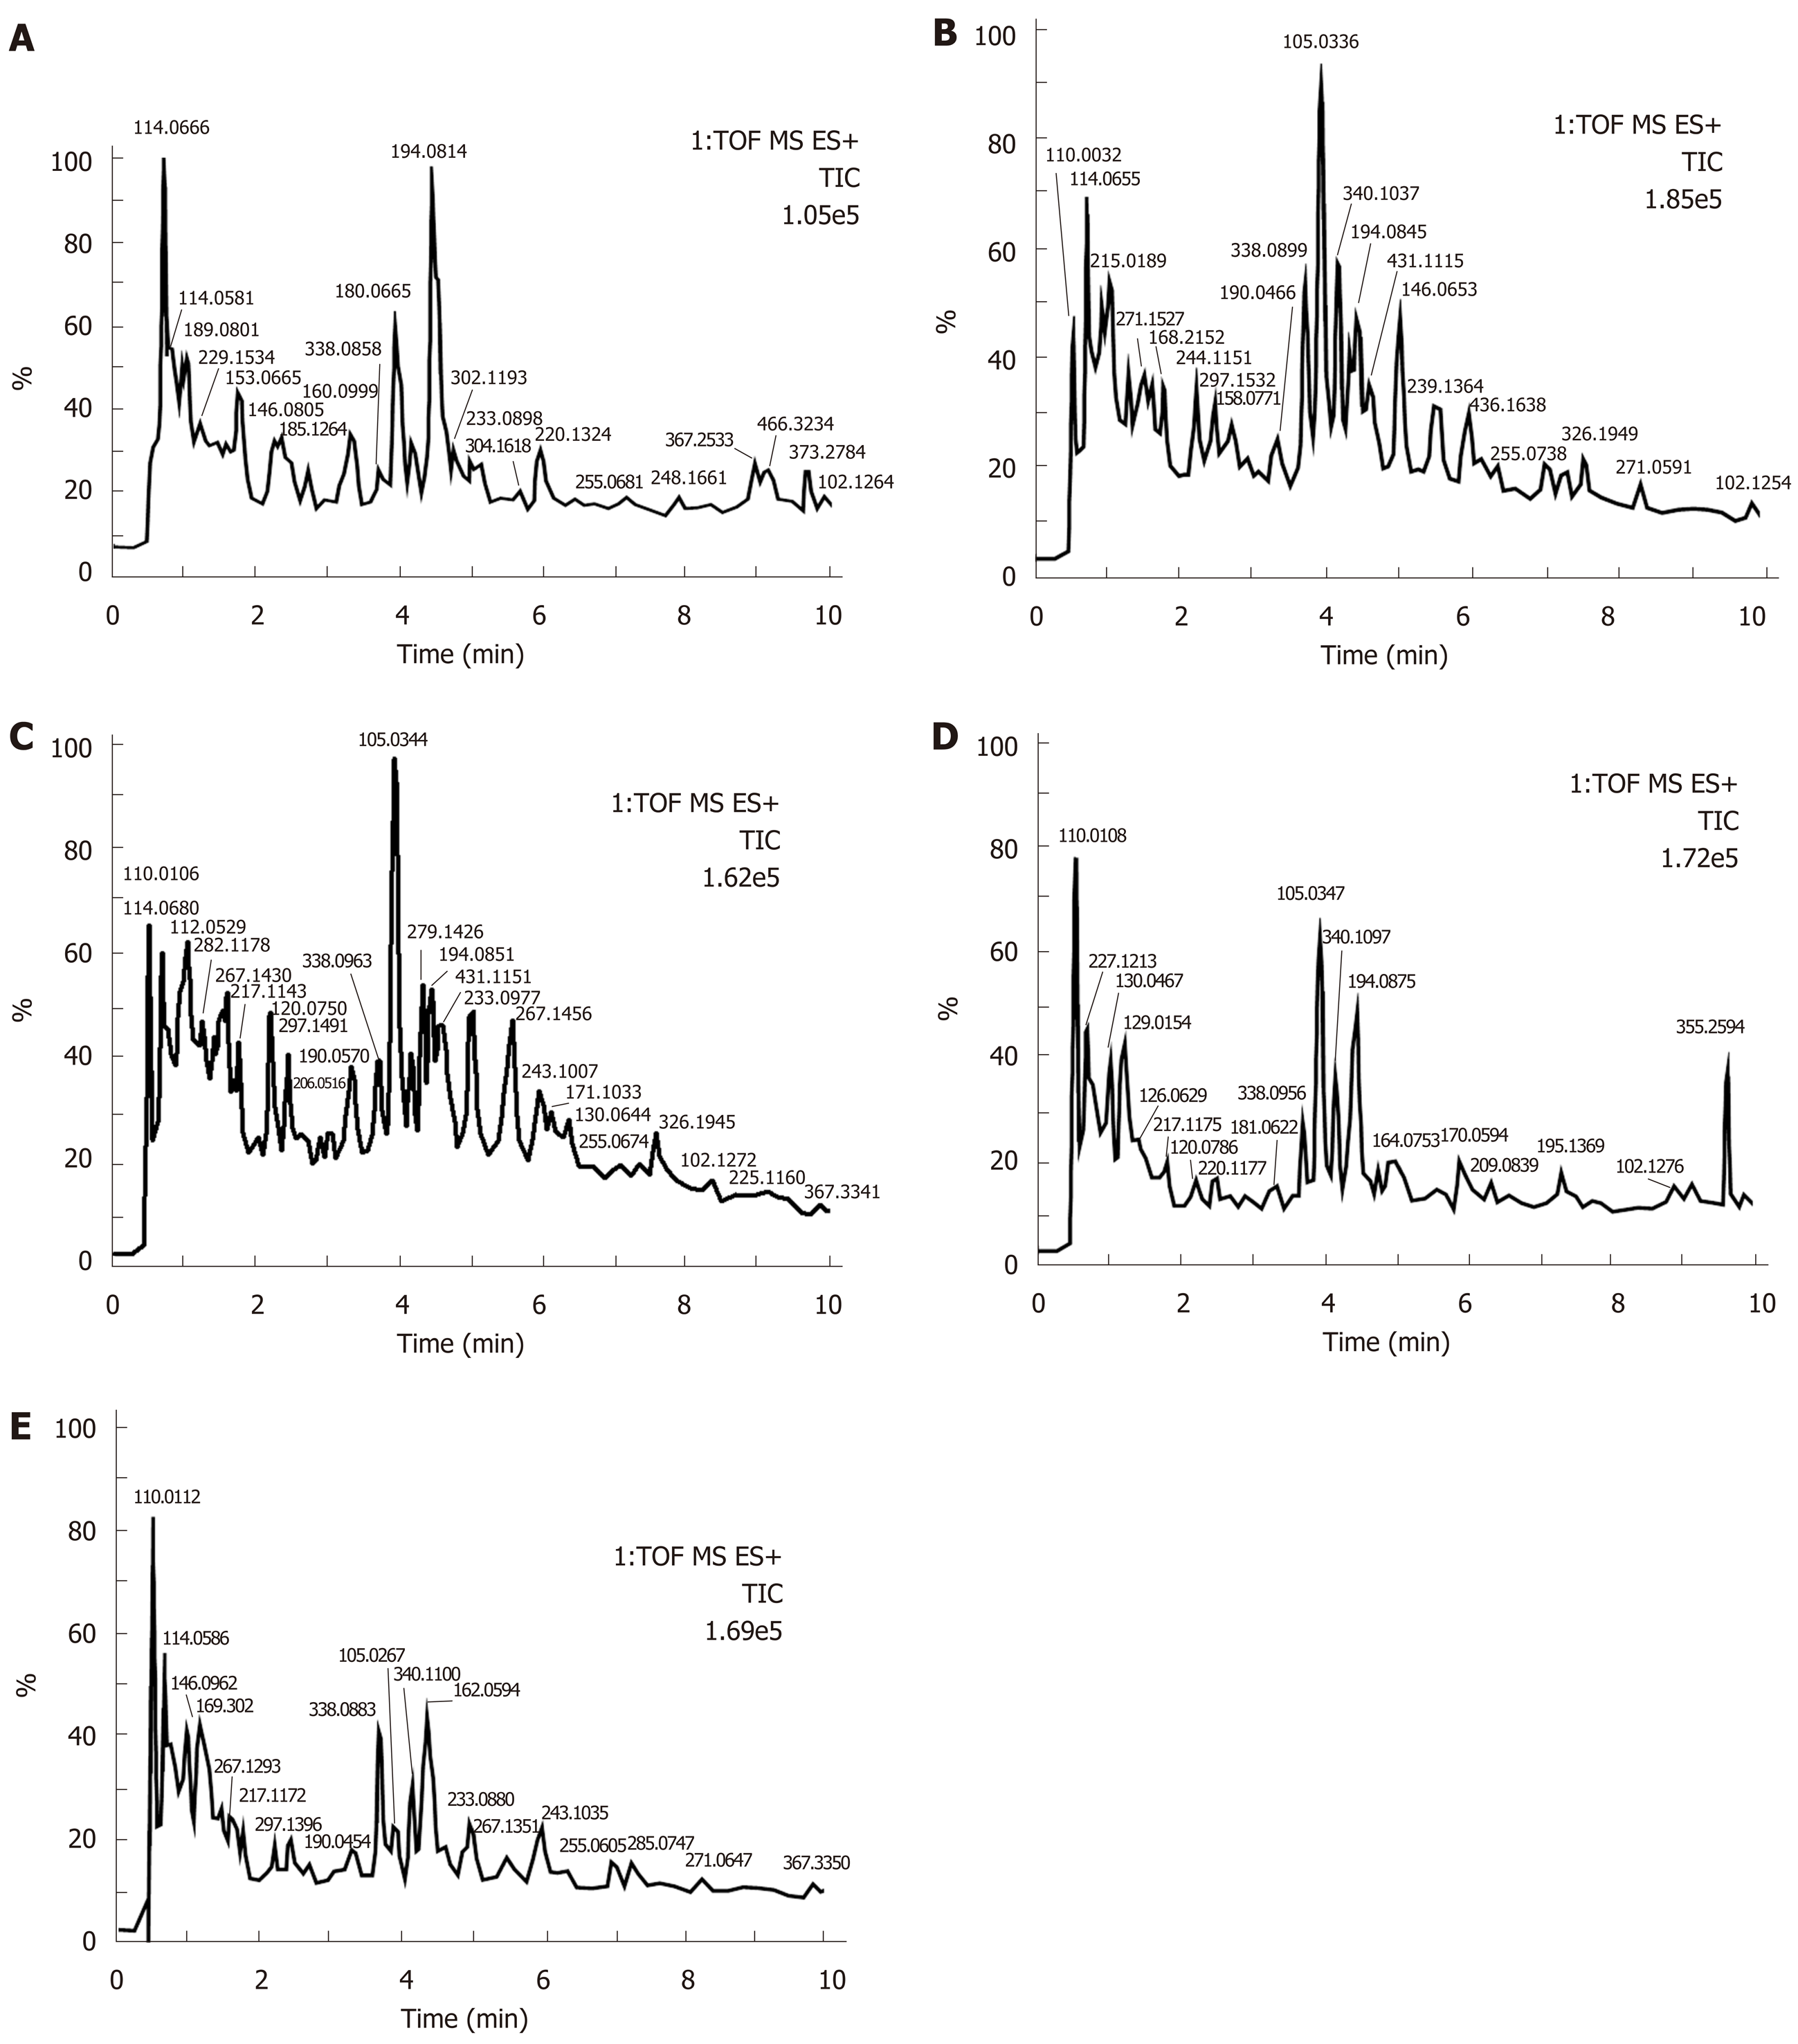
Figure 1 Base peak ion chromatograms in positive ion mode of metabolites in urine of rats treated for 0 d.
A: Normal group (K); B: Model control group (M); C: Tong Xie Yao Fang high dose group (G); D: Tong Xie Yao Fang medium dose group (Z); E: Tong Xie Yao Fang low dose group (D).
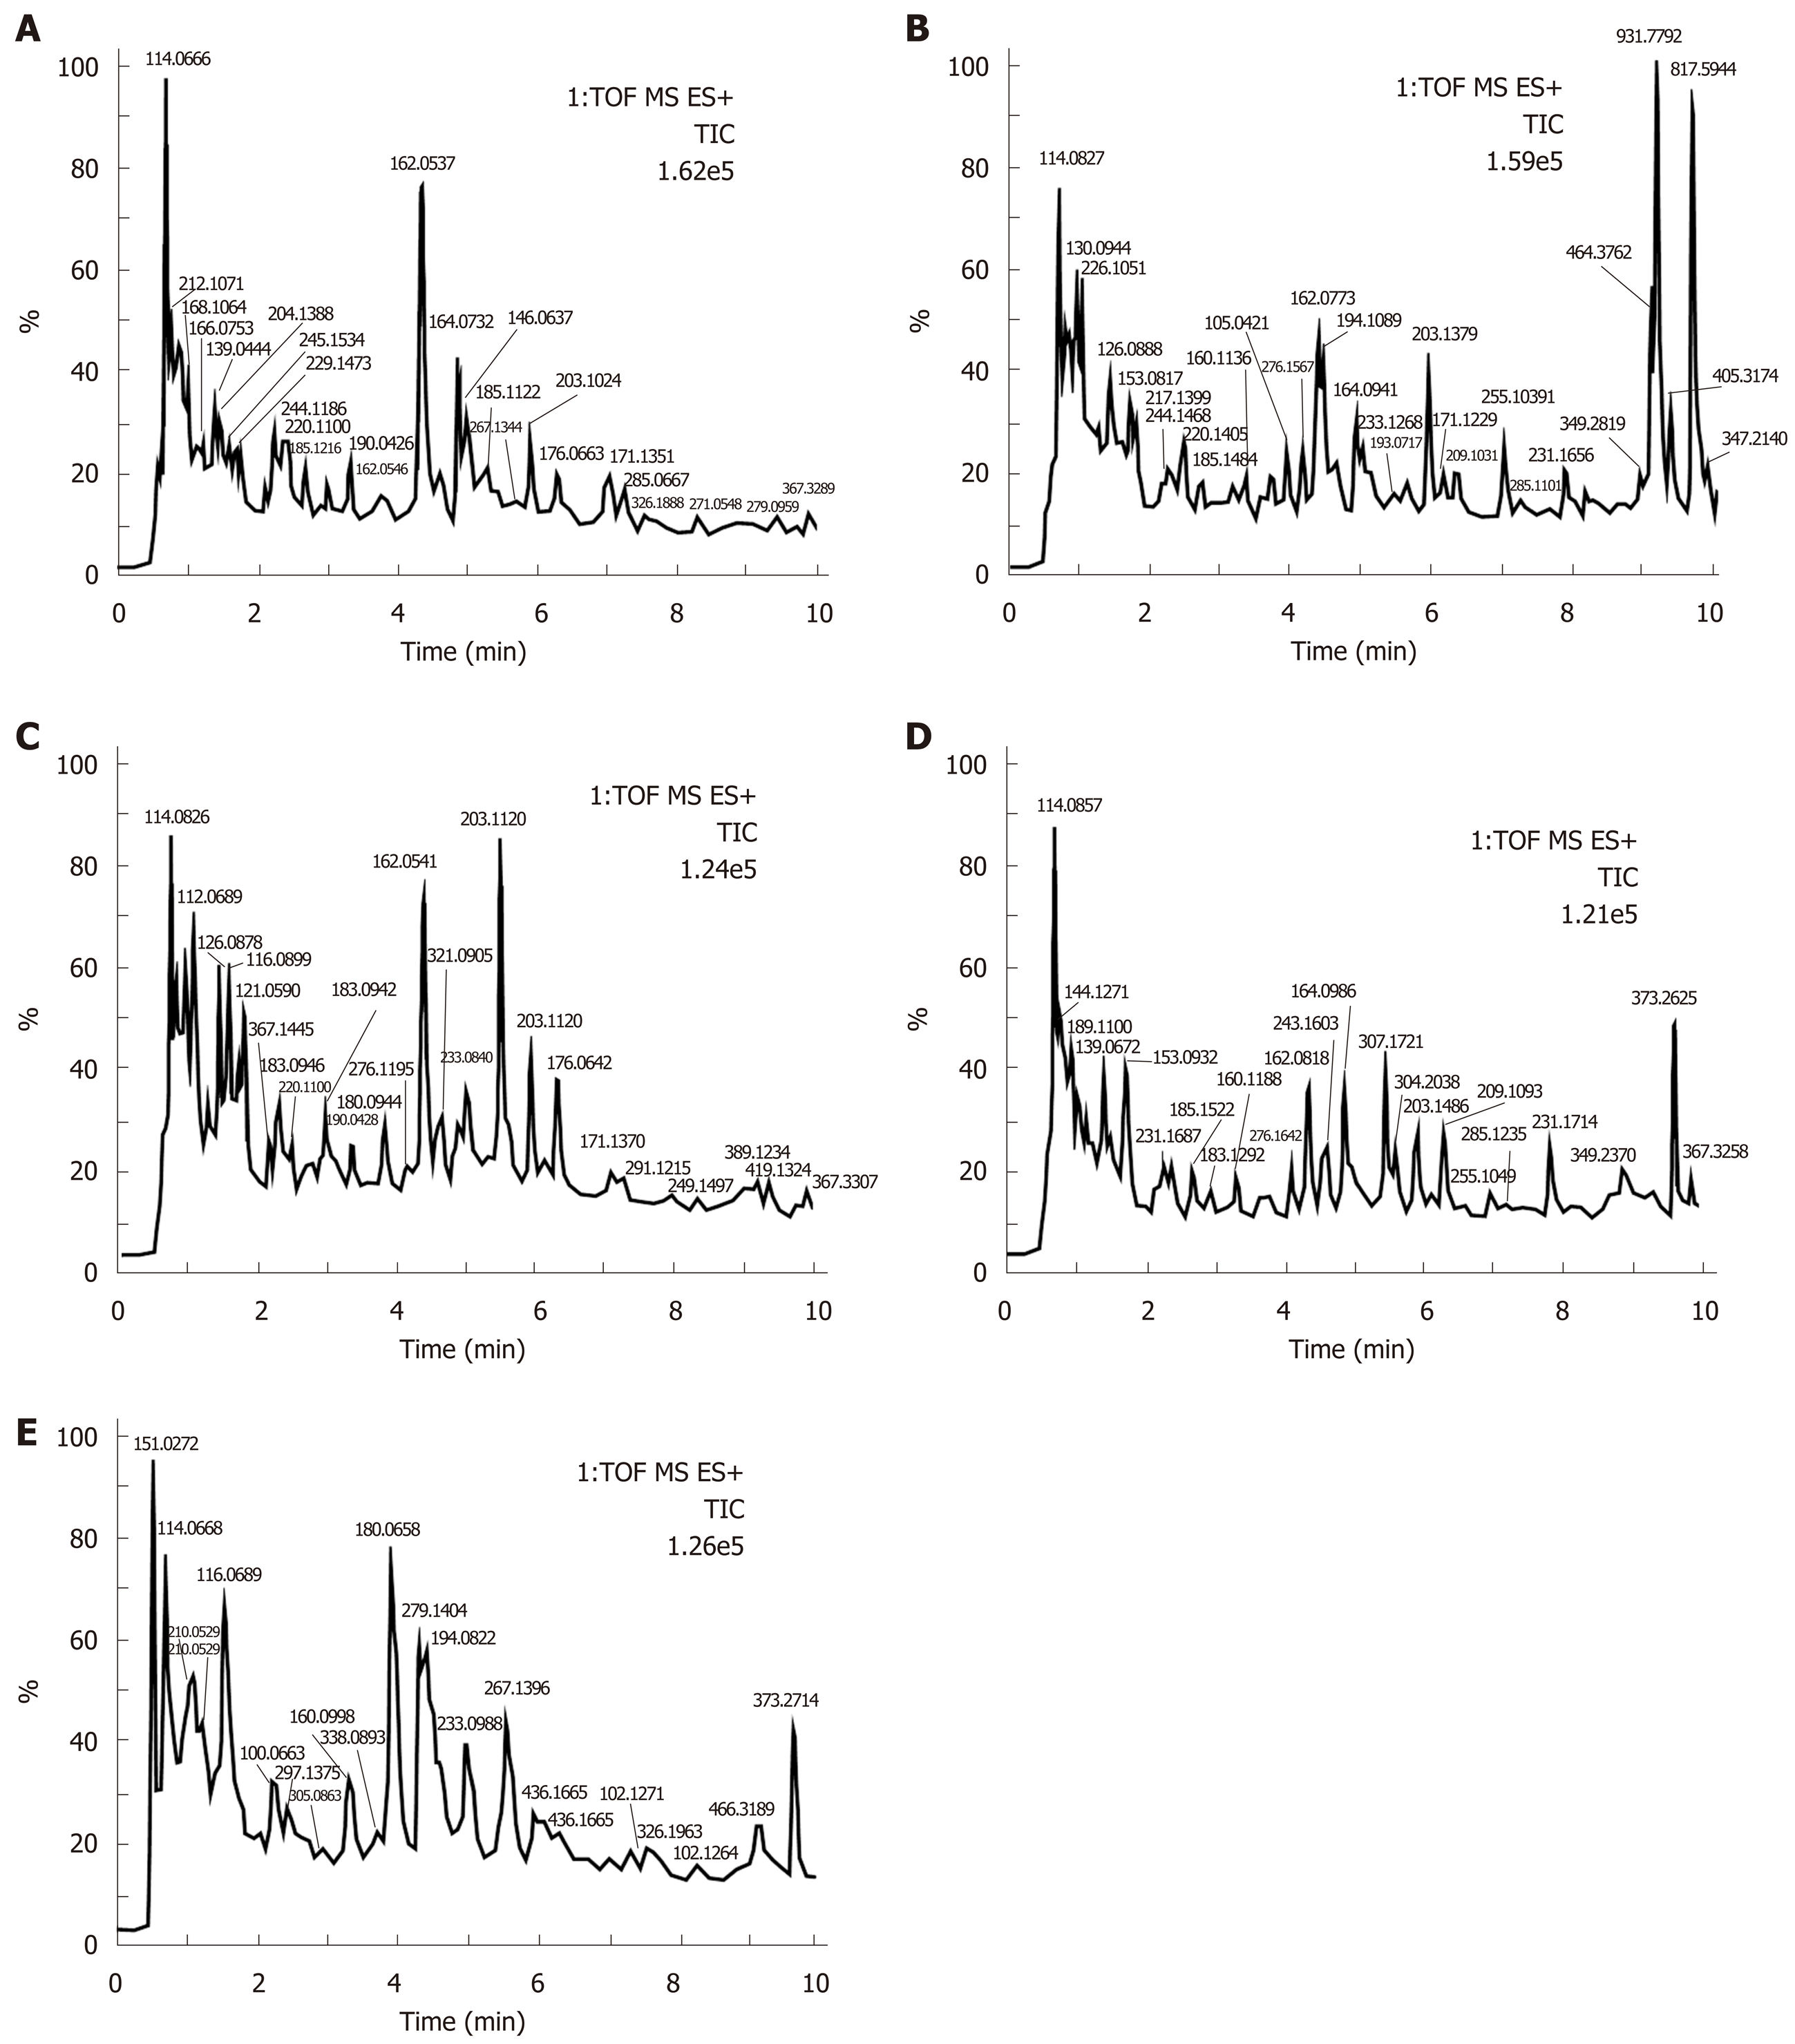
Figure 2 Base peak ion chromatograms in positive ion mode of metabolites in urine of rats treated for 14 d.
A: Normal group (K); B: Model control group (M); C: Tong Xie Yao Fang high dose group (G); D: Tong Xie Yao Fang medium dose group (Z); E: Tong Xie Yao Fang low dose group (D).
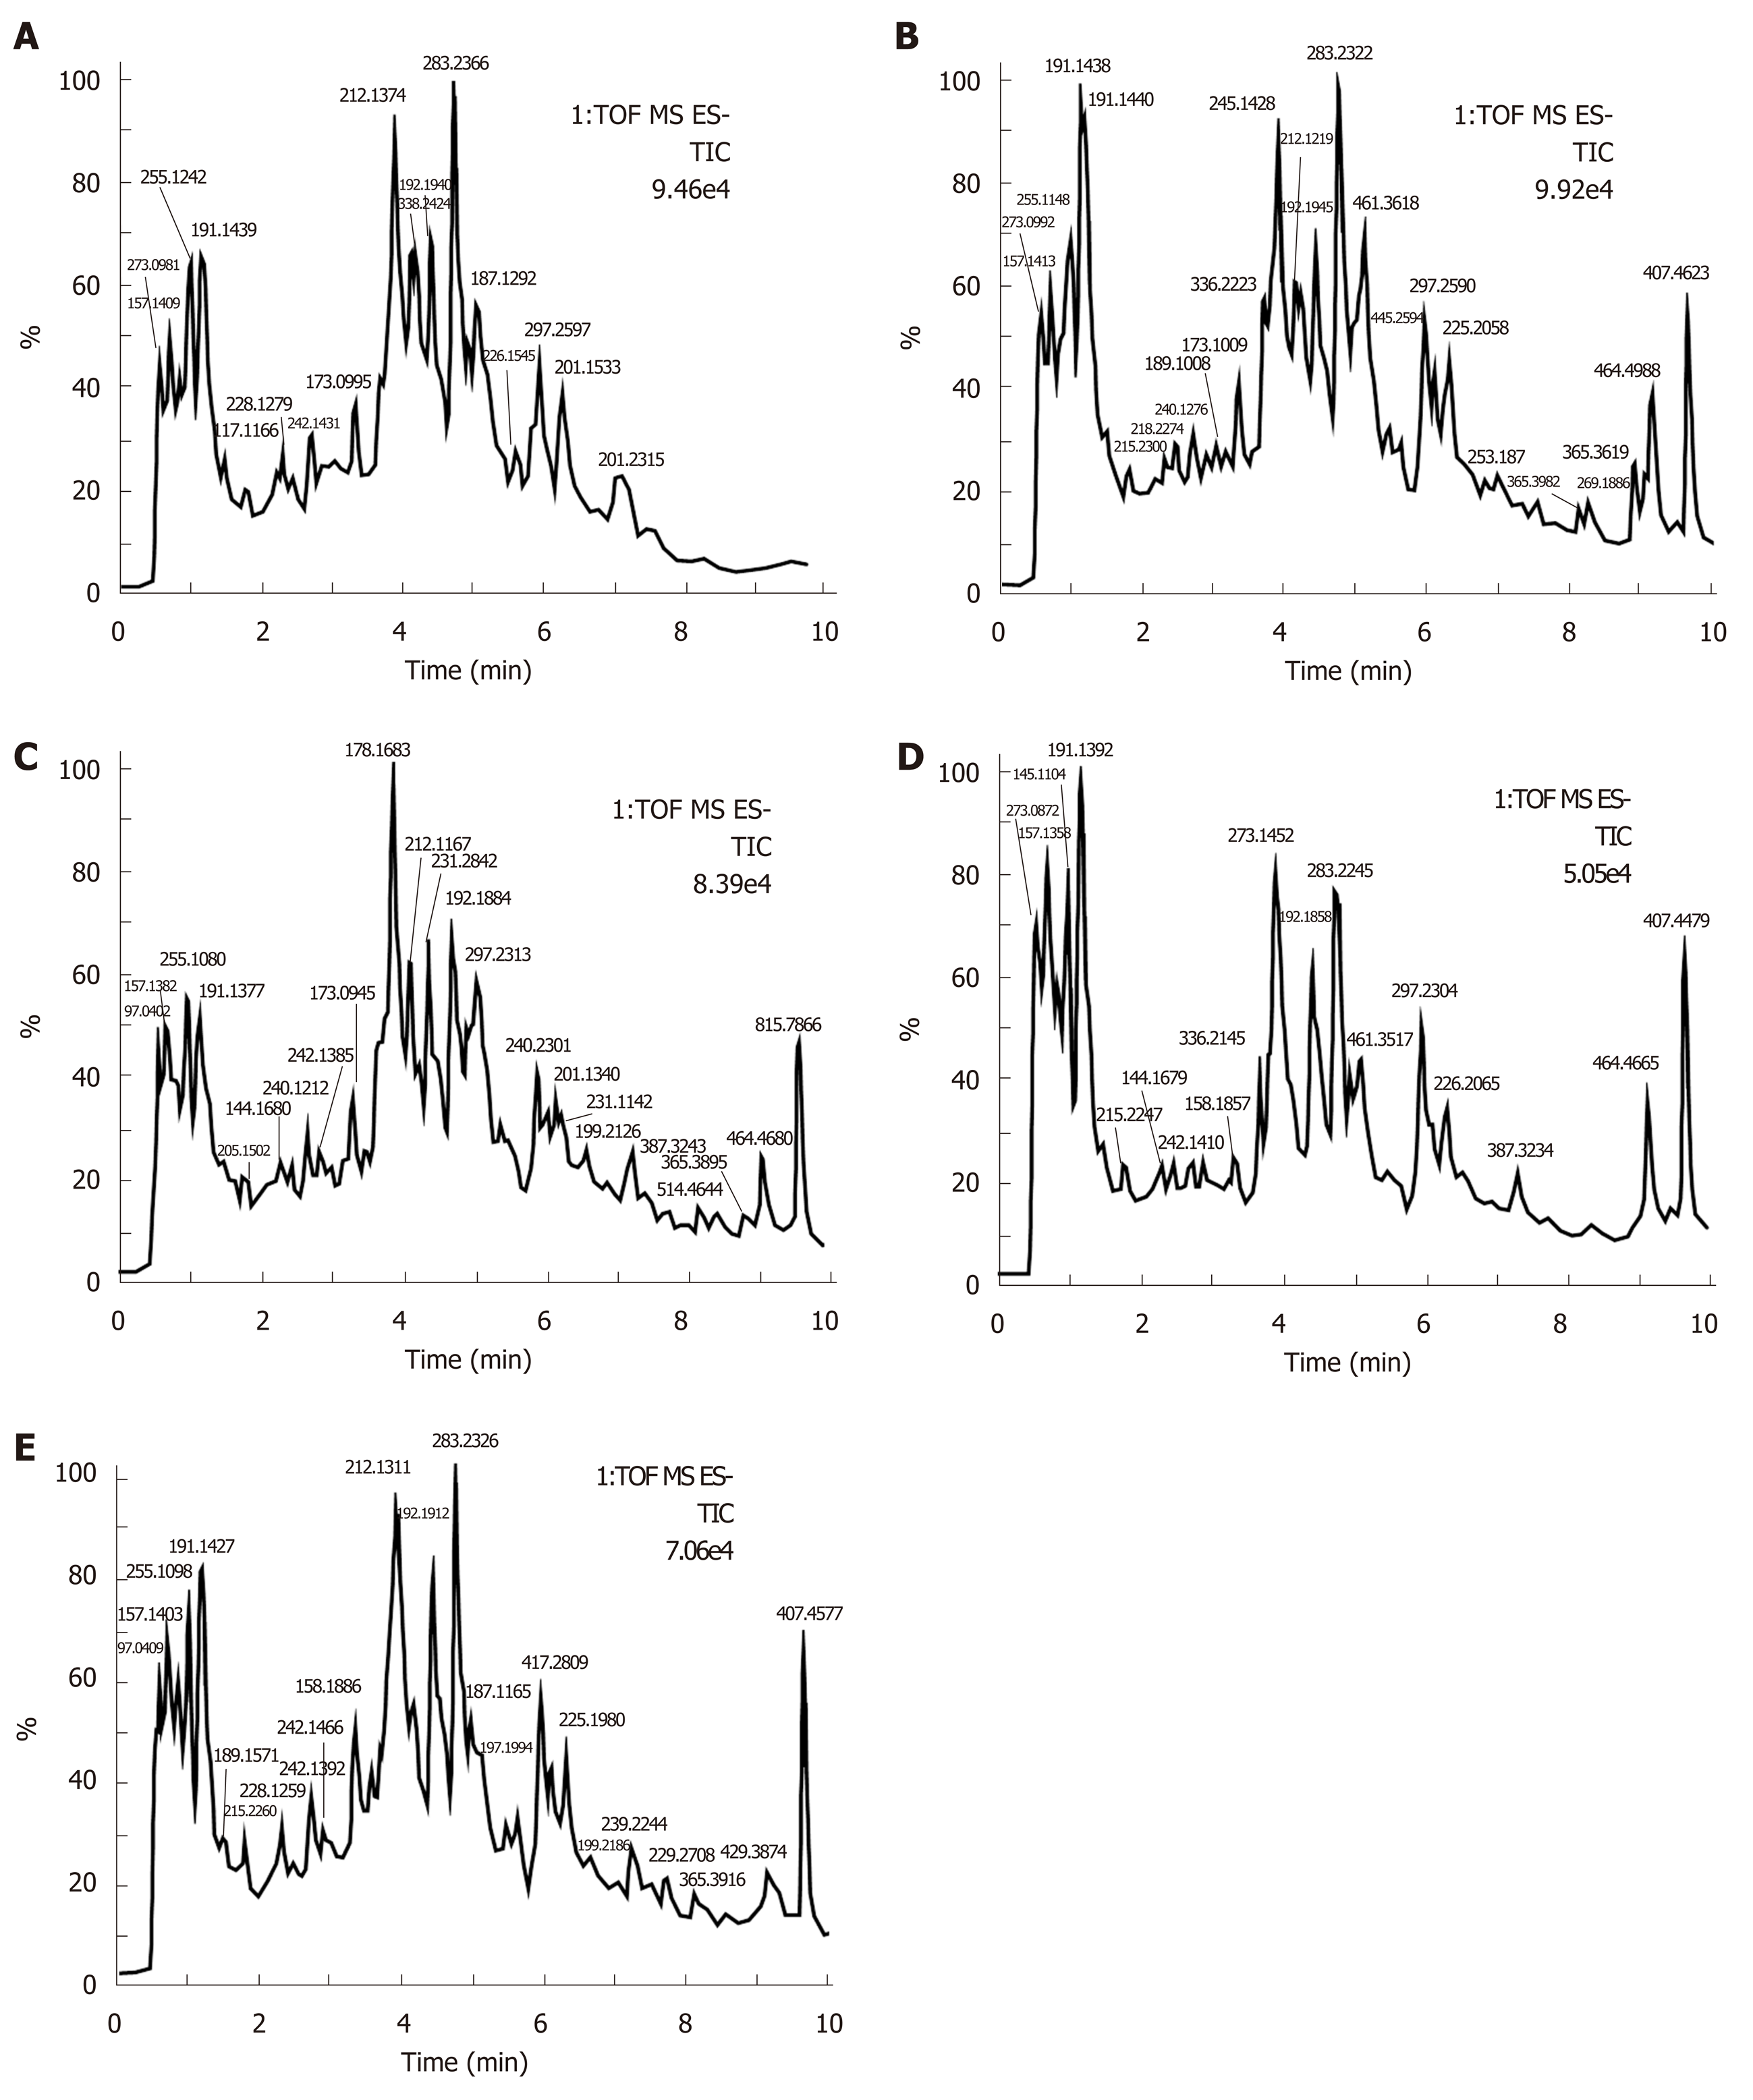
Figure 3 Base peak ion chromatograms in negative ion mode of metabolites in urine of rats treated for 0 d.
A: Normal group (K); B: Model control group (M); C: Tong Xie Yao Fang high dose group (G); D: Tong Xie Yao Fang medium dose group (Z); E: Tong Xie Yao Fang low dose group (D).
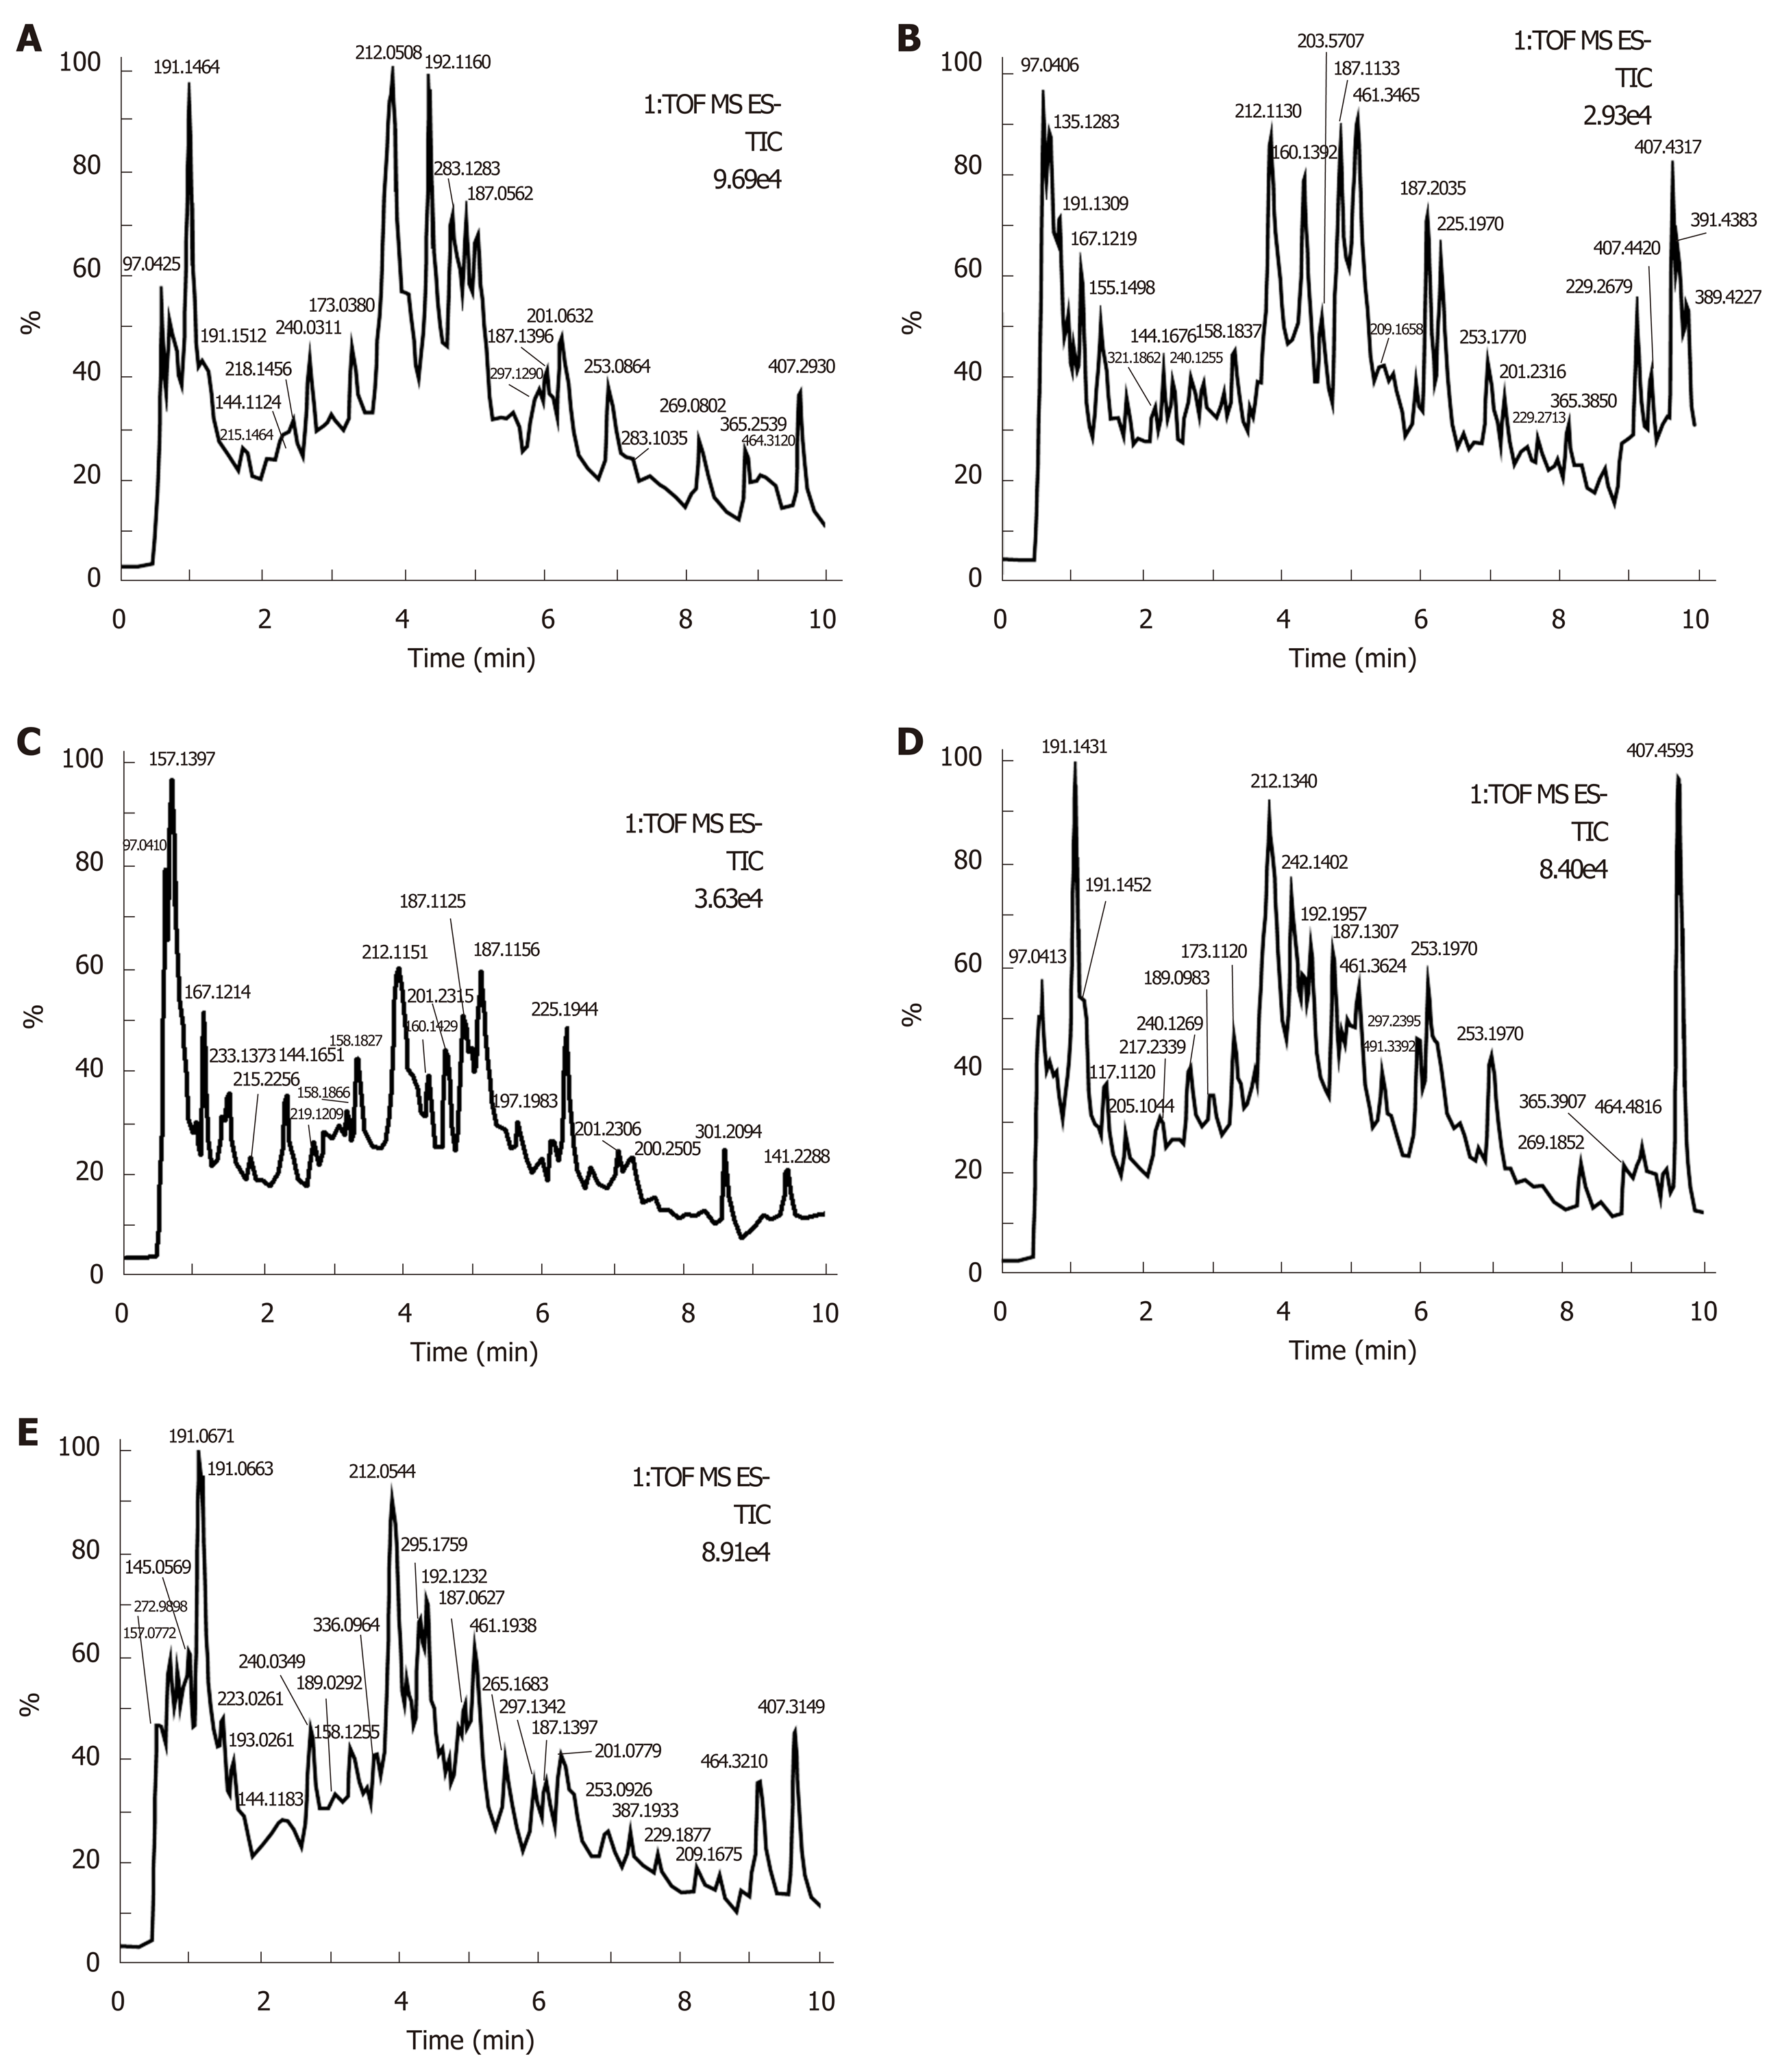
Figure 4 Base peak ion chromatograms in negative ion mode of metabolites in urine of rats treated for 14 d.
A: Normal group (K); B: Model control group (M); C: Tong Xie Yao Fang high dose group (G); D: Tong Xie Yao Fang medium dose group (Z); E: Tong Xie Yao Fang low dose group (D).
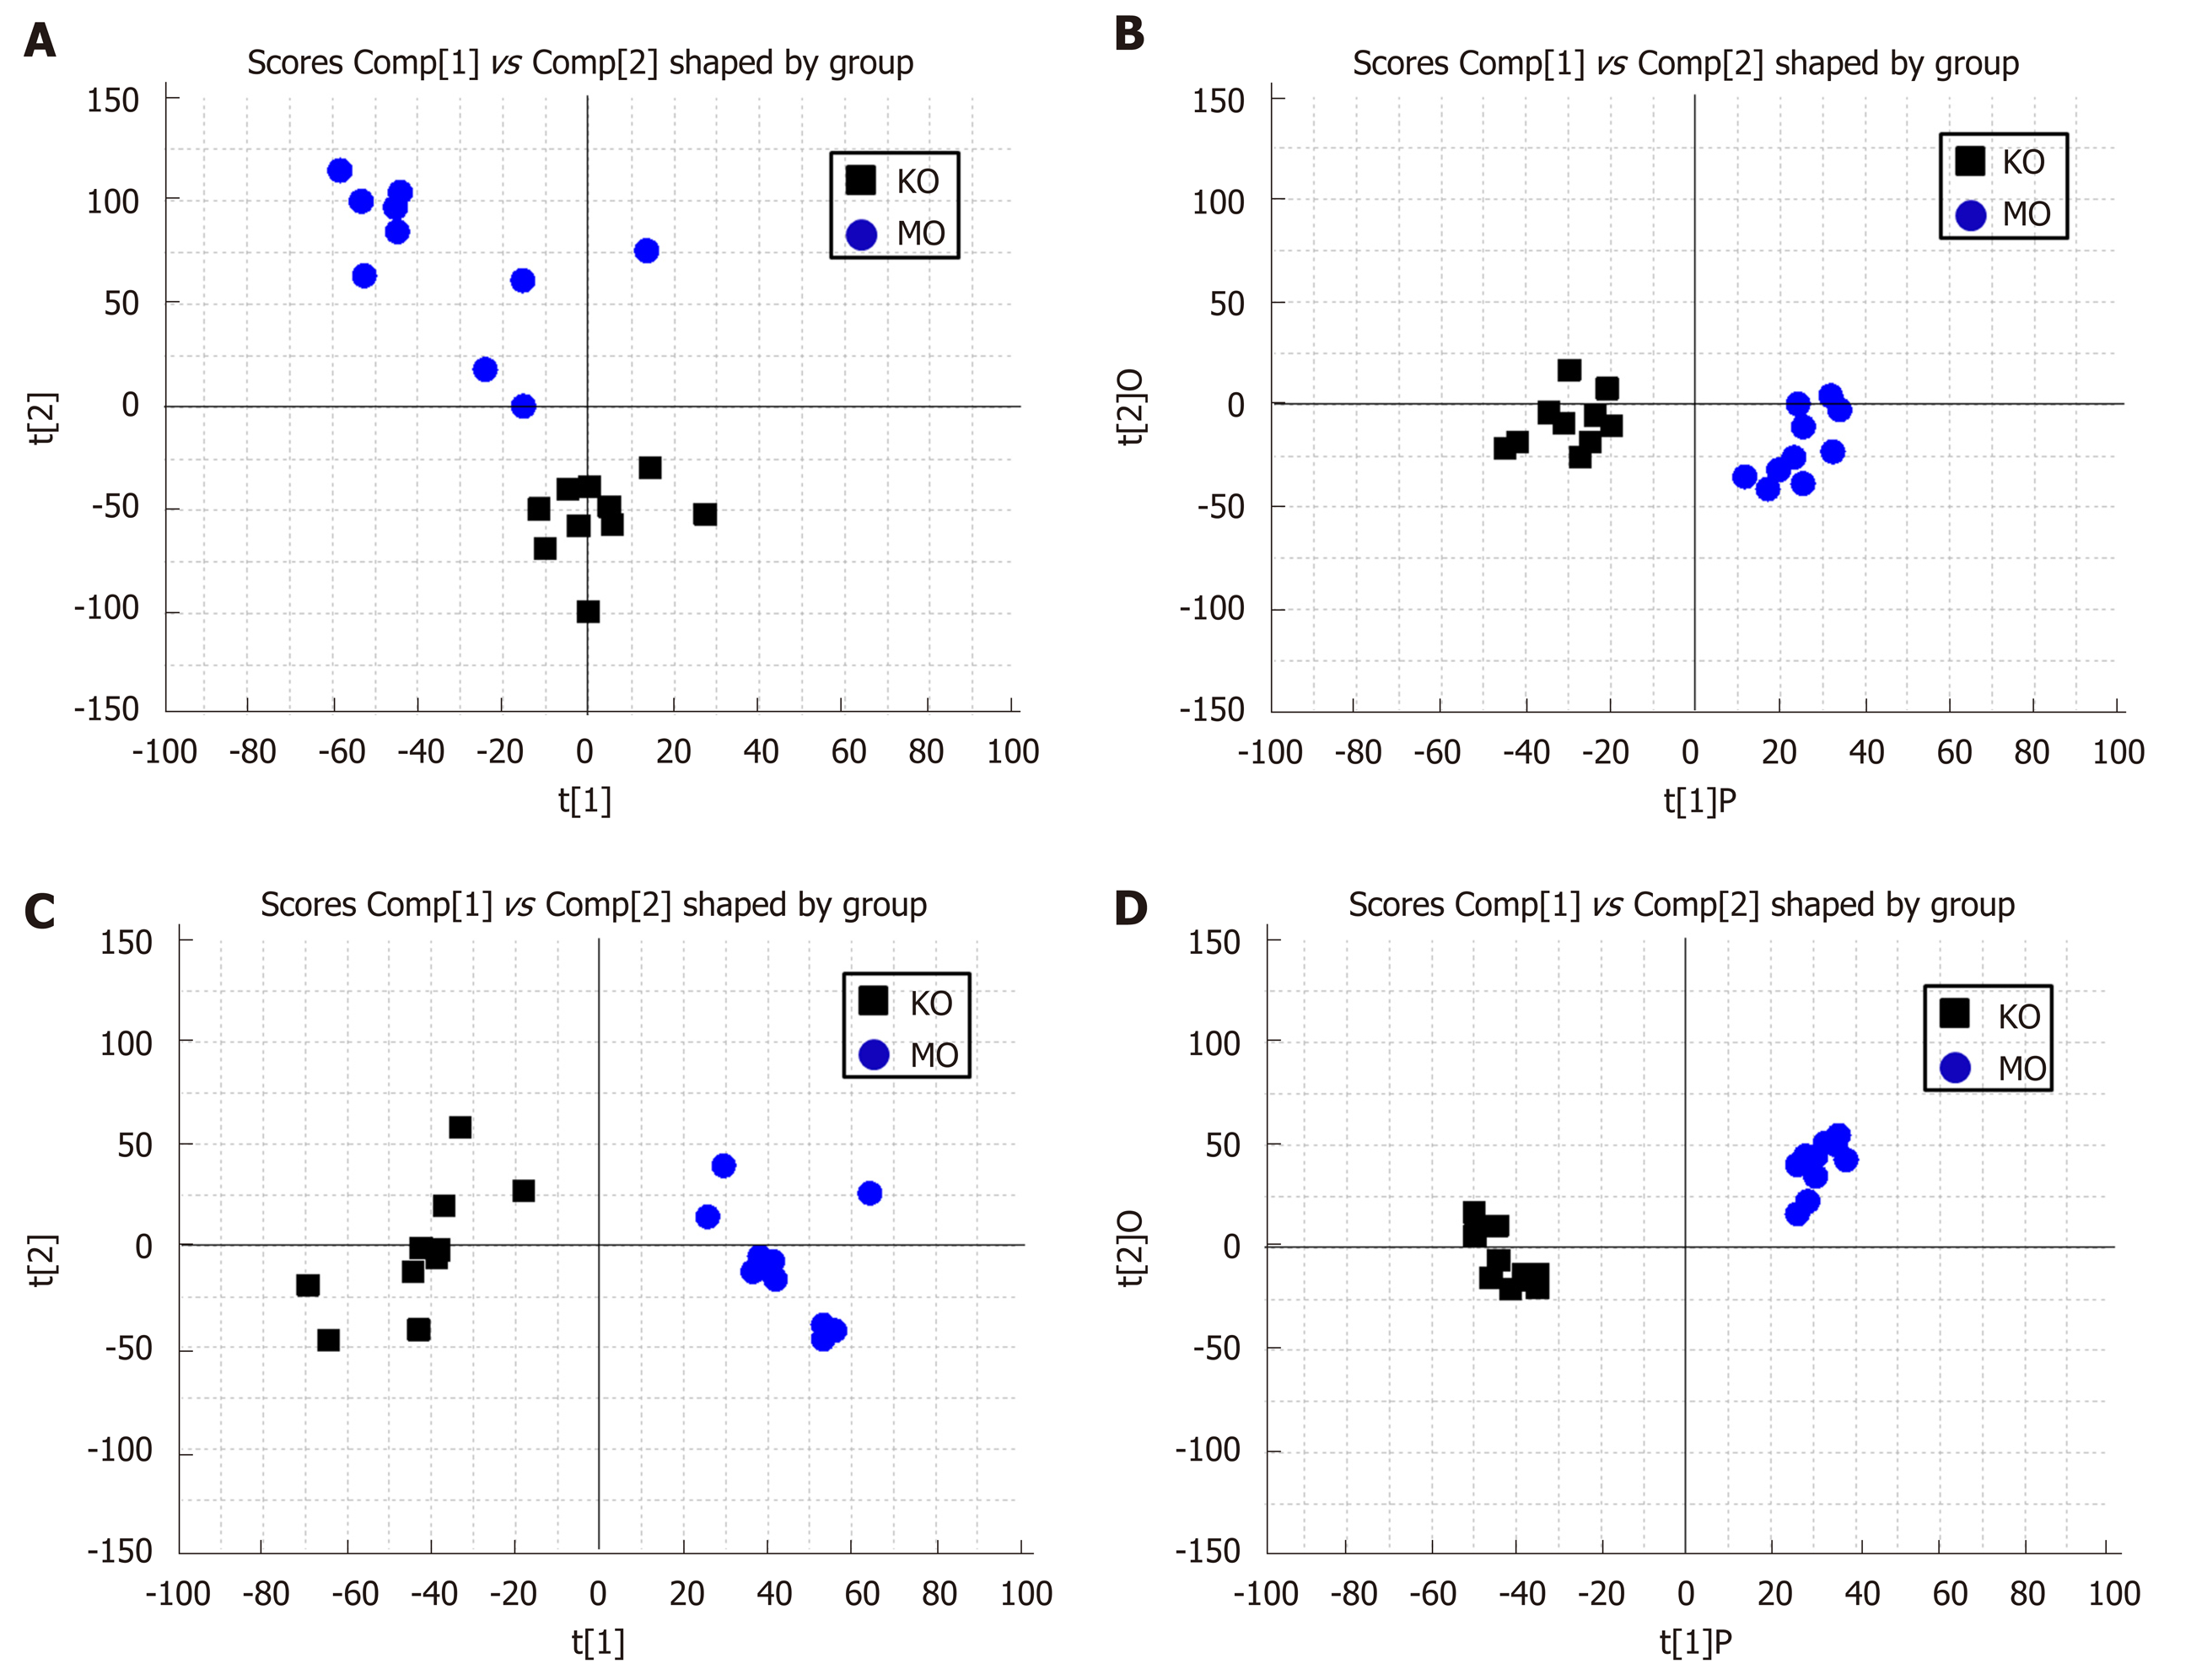
Figure 5 Score plot of metabolites in urine of normal and model rats treated for 0 d.
A: Principal component analysis (PCA) score plot (positive ion); B: Orthogonal partial least squares discriminant analysis score plot (positive ion); C: Principal component analysis score plot (negative ion); D: Orthogonal partial least squares discriminant analysis score plot (negative ion). K: Normal group; M: Model control group.
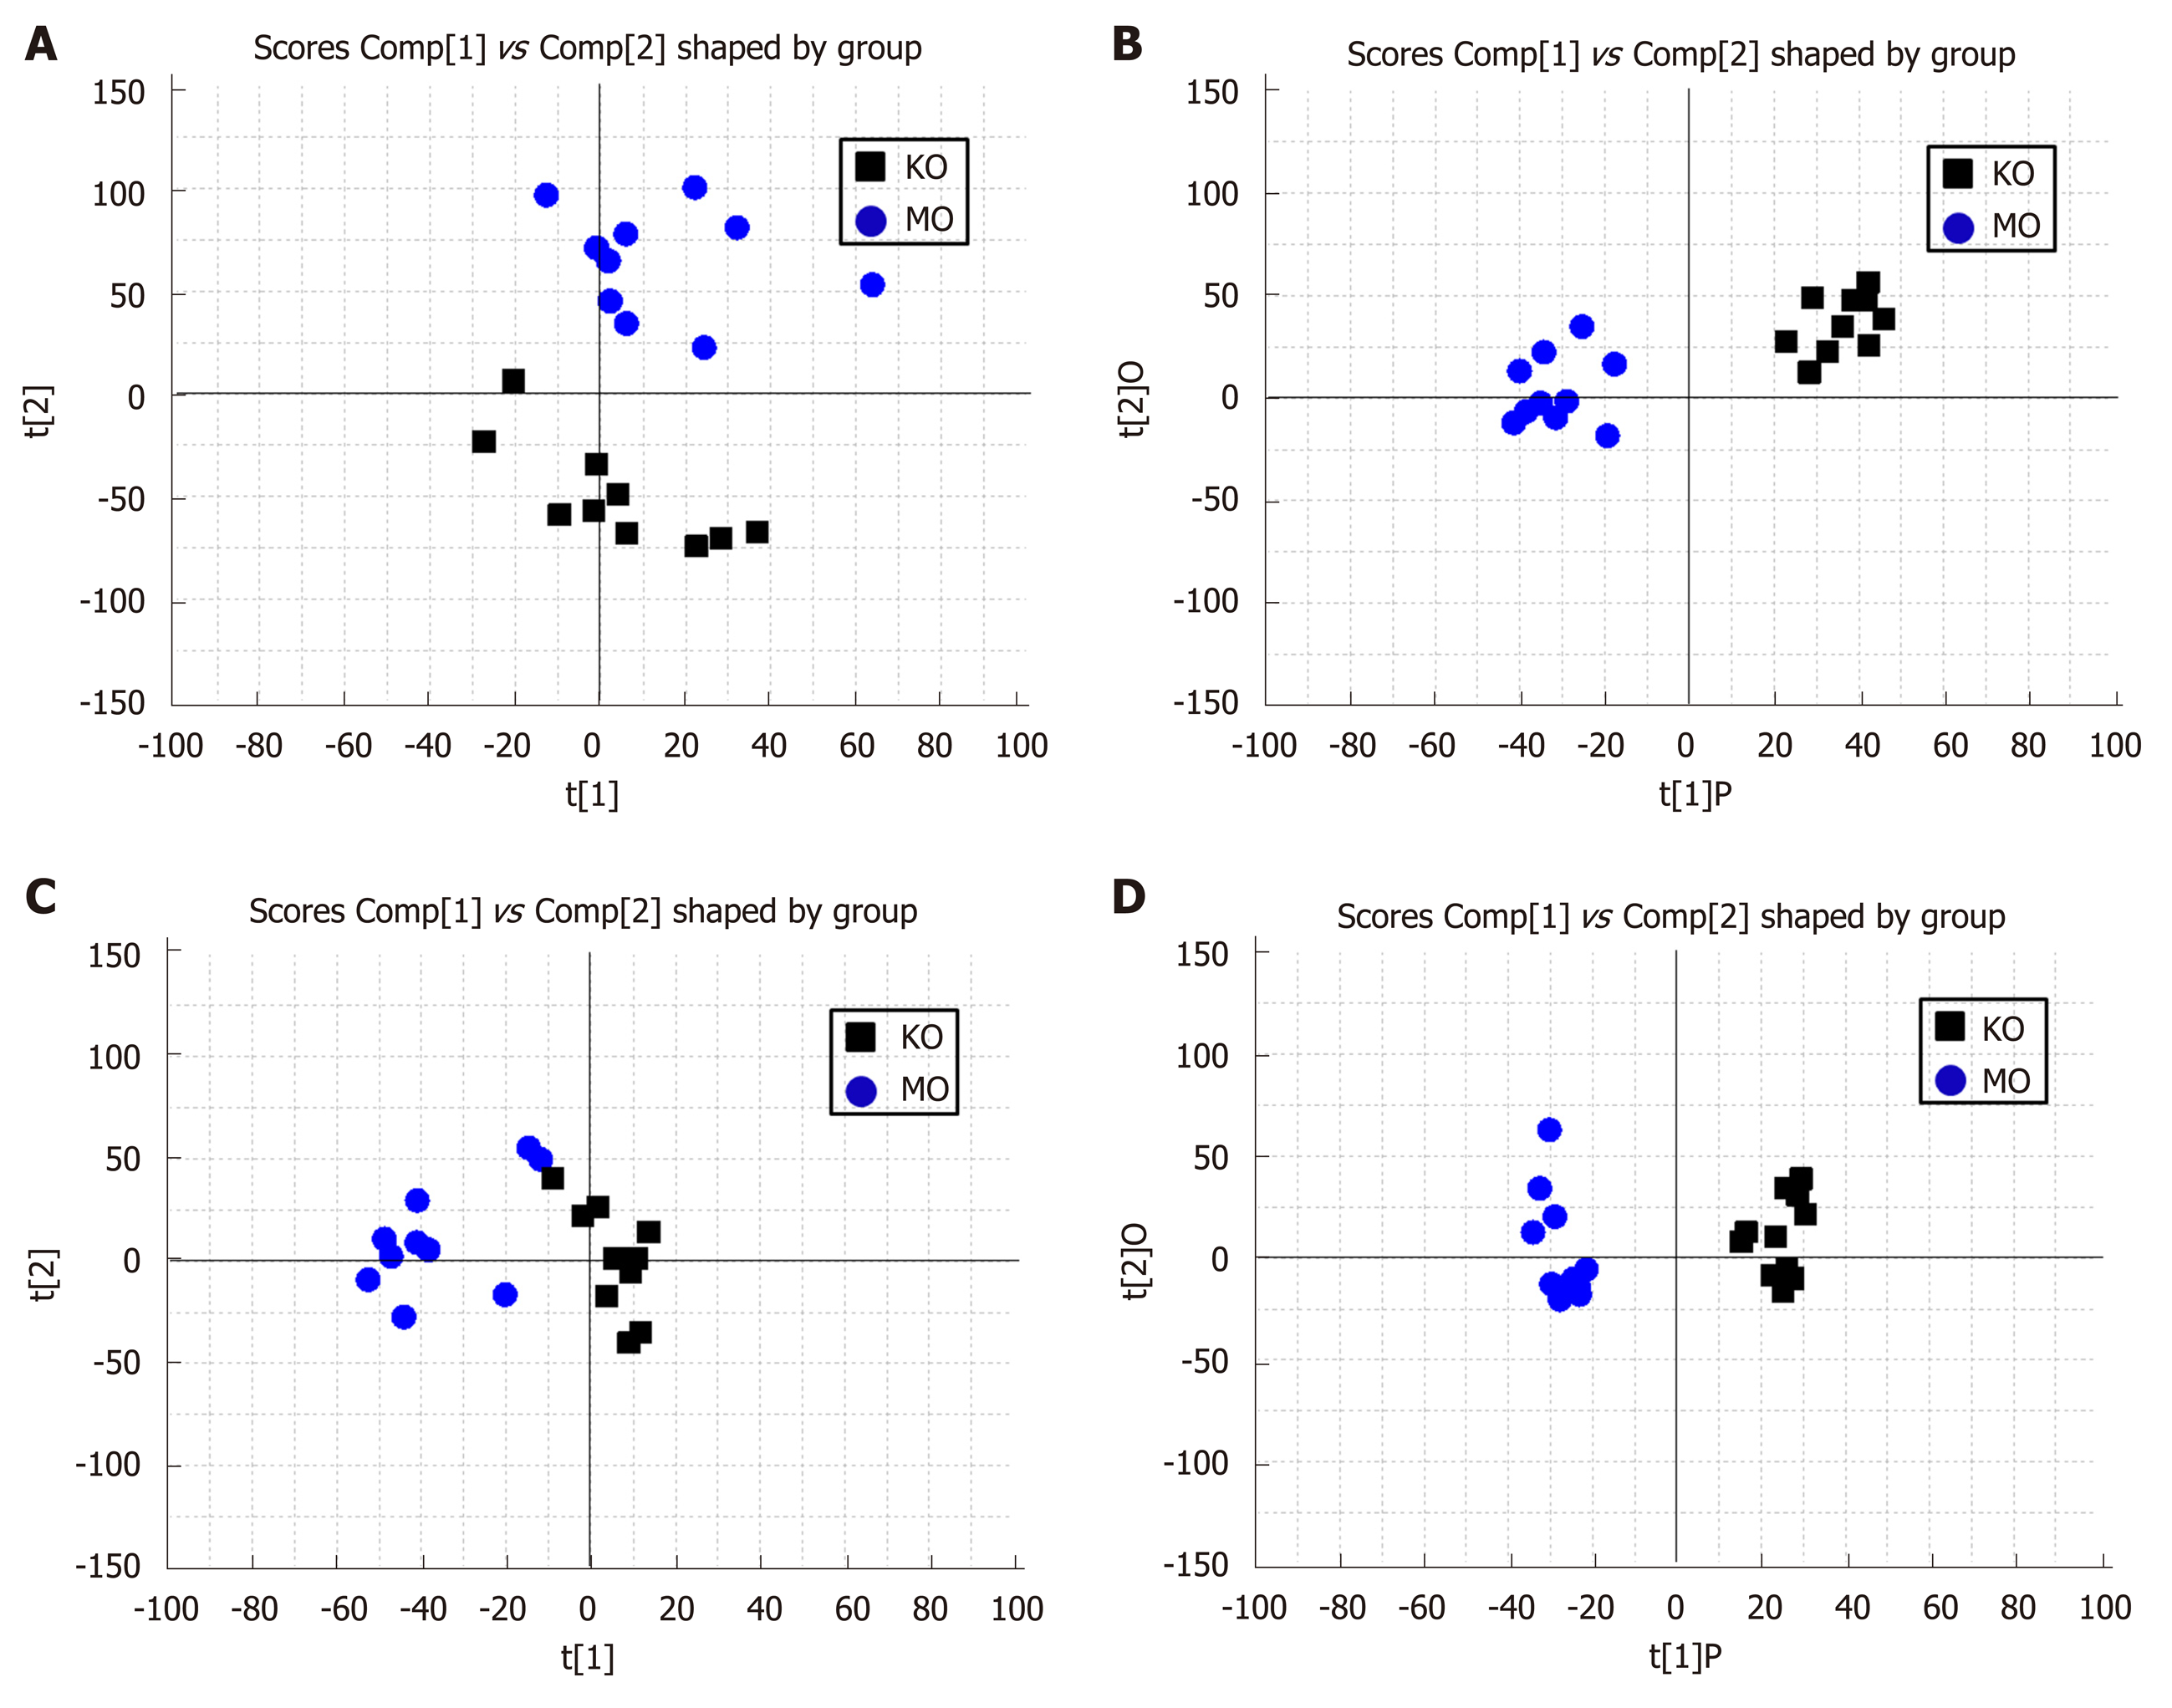
Figure 6 Score plots of metabolites in urine of normal and model rats treated for 14 d.
A: Principal component analysis score plot (positive ion); B: Orthogonal partial least squares discriminant analysis score plot (positive ion); C: Principal component analysis score plot (negative ion); D: Orthogonal partial least squares discriminant analysis score plot (negative ion). K: Normal group; M: Model control group.
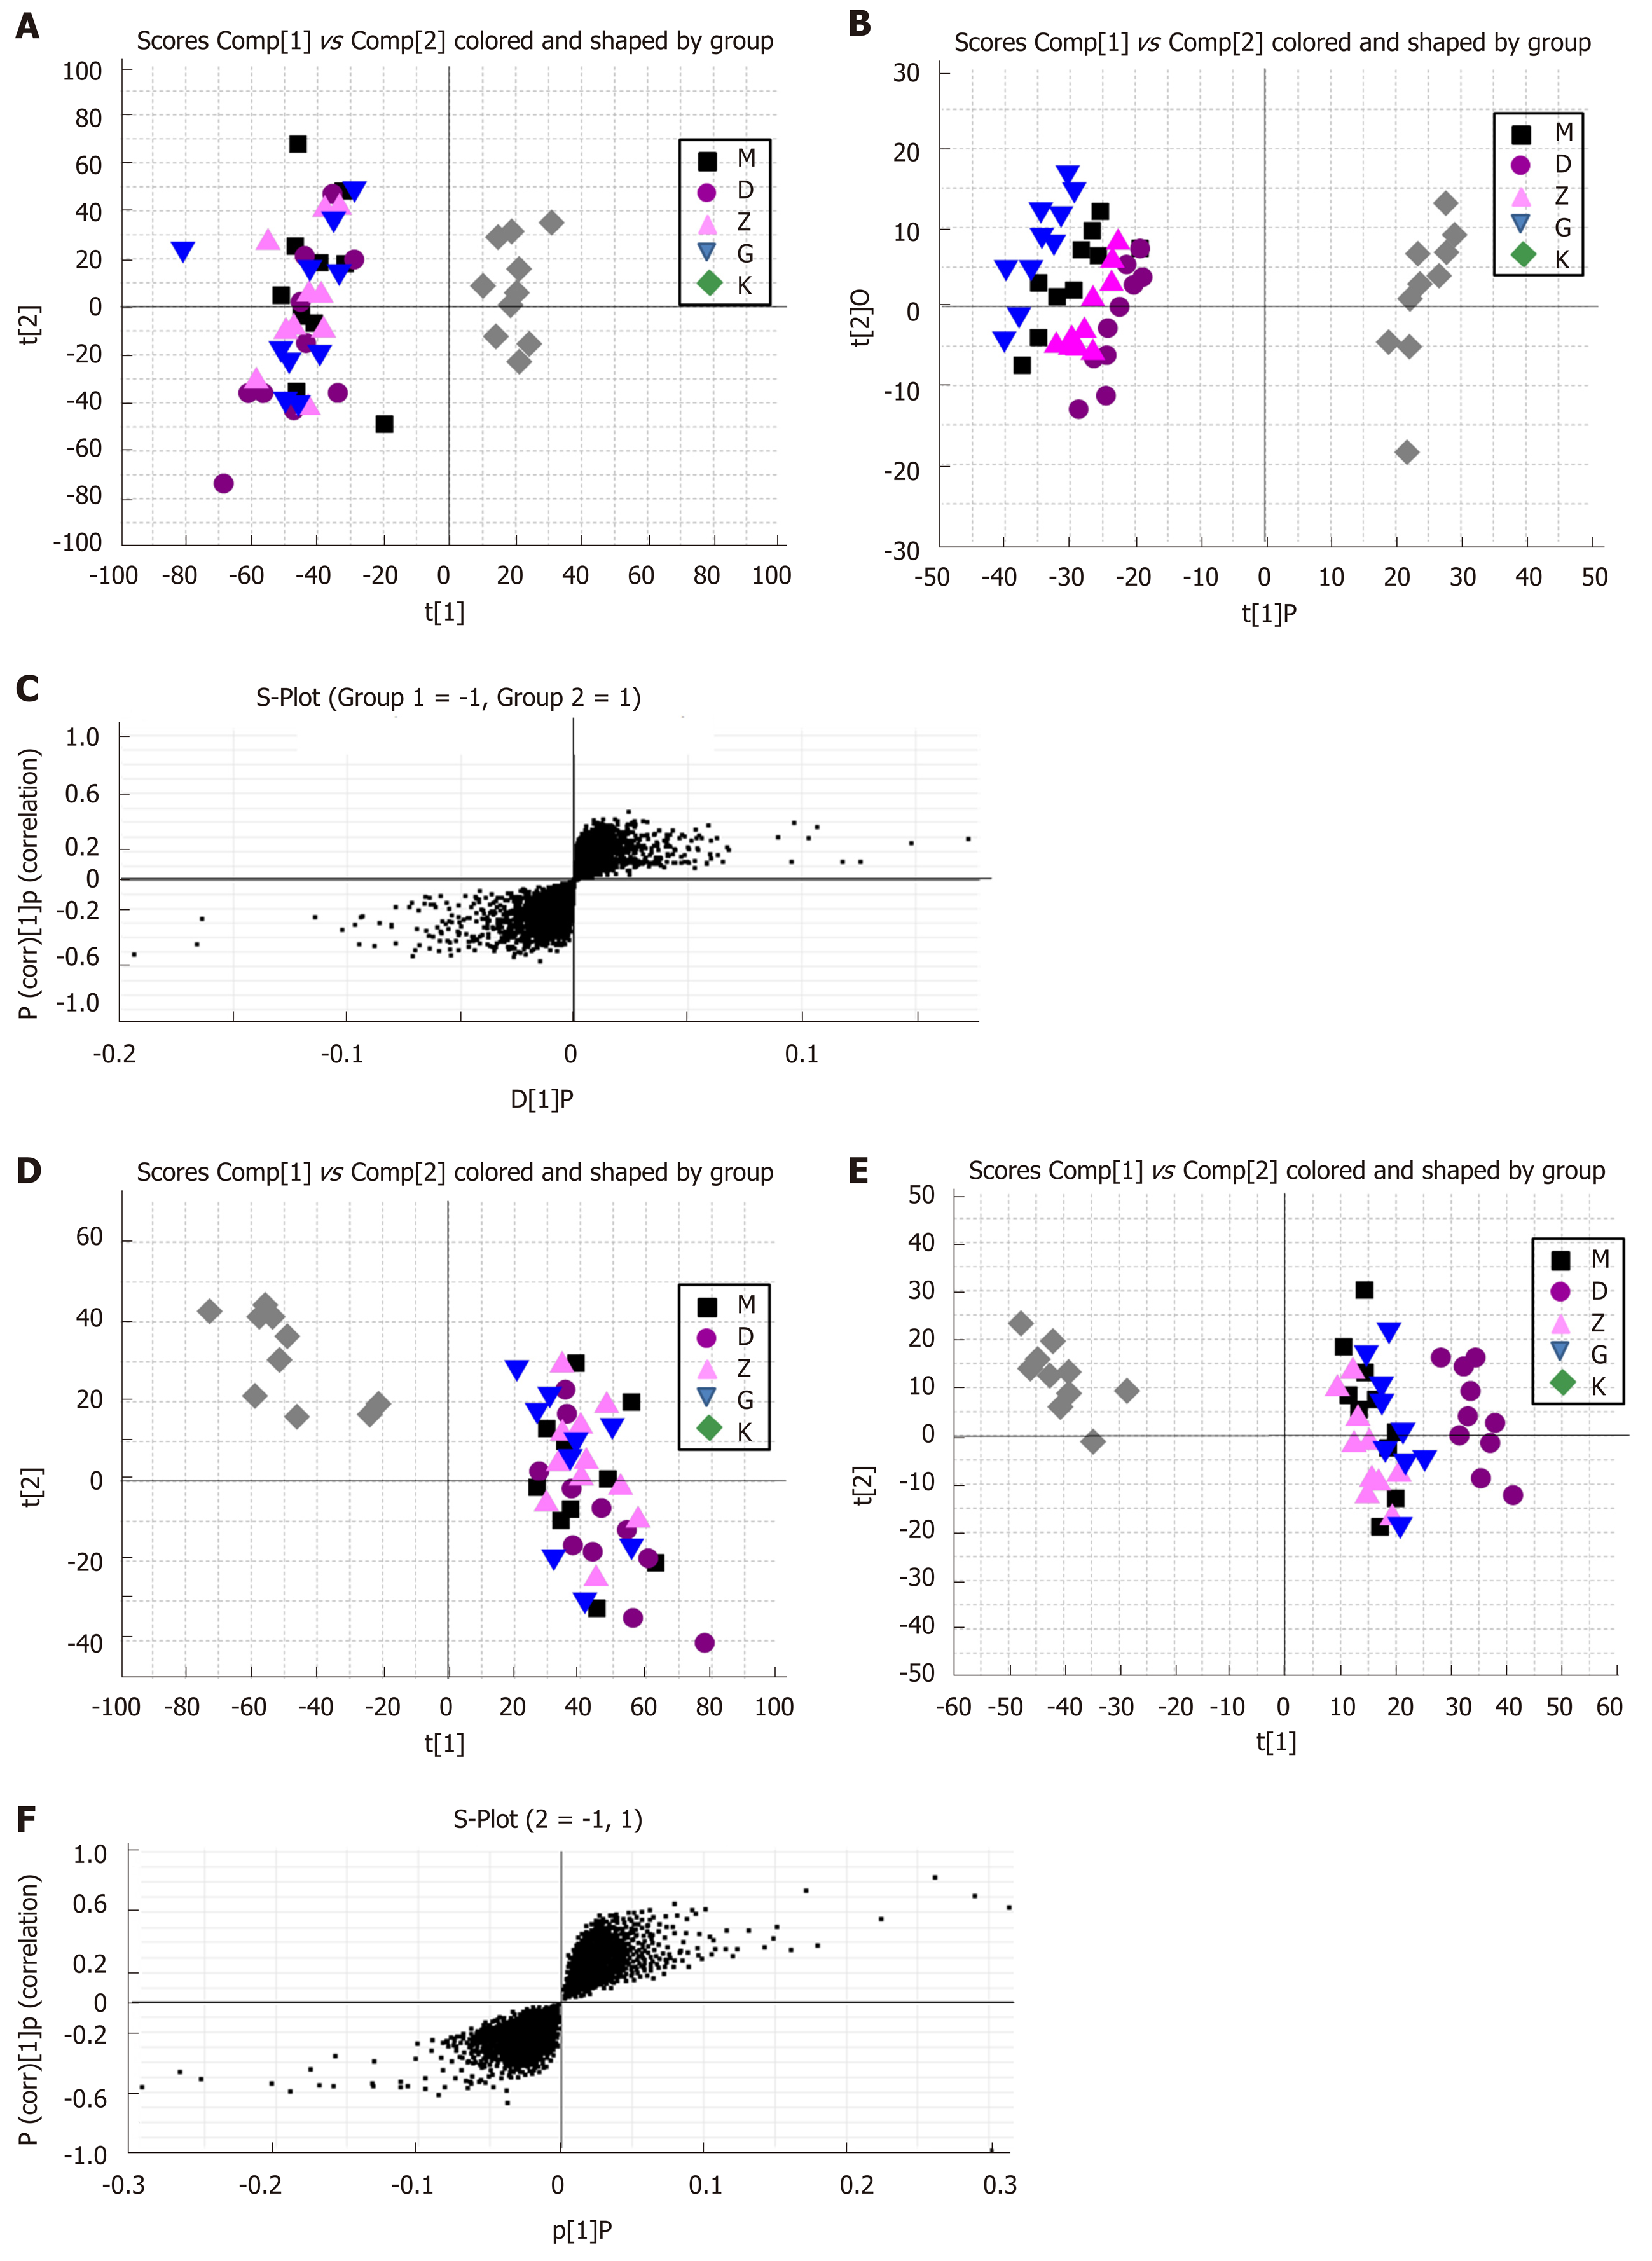
Figure 7 Score plot of metabolites in urine of rats treated for 0 d.
A: Urine principal component analysis score plot (positive ion); B: Urine orthogonal partial least squares discriminant analysis score plot (positive ion); C: Urine score plot (positive ion); D: Principal component analysis score plot (negative ion); E: Orthogonal partial least squares discriminant analysis score plot (negative ion); F: Urine score plot (negative ion). K: Normal group; M: Model group; G: Tong Xie Yao Fang high dose group; Z: Tong Xie Yao Fang medium dose group; D: Tong Xie Yao Fang low dose group.
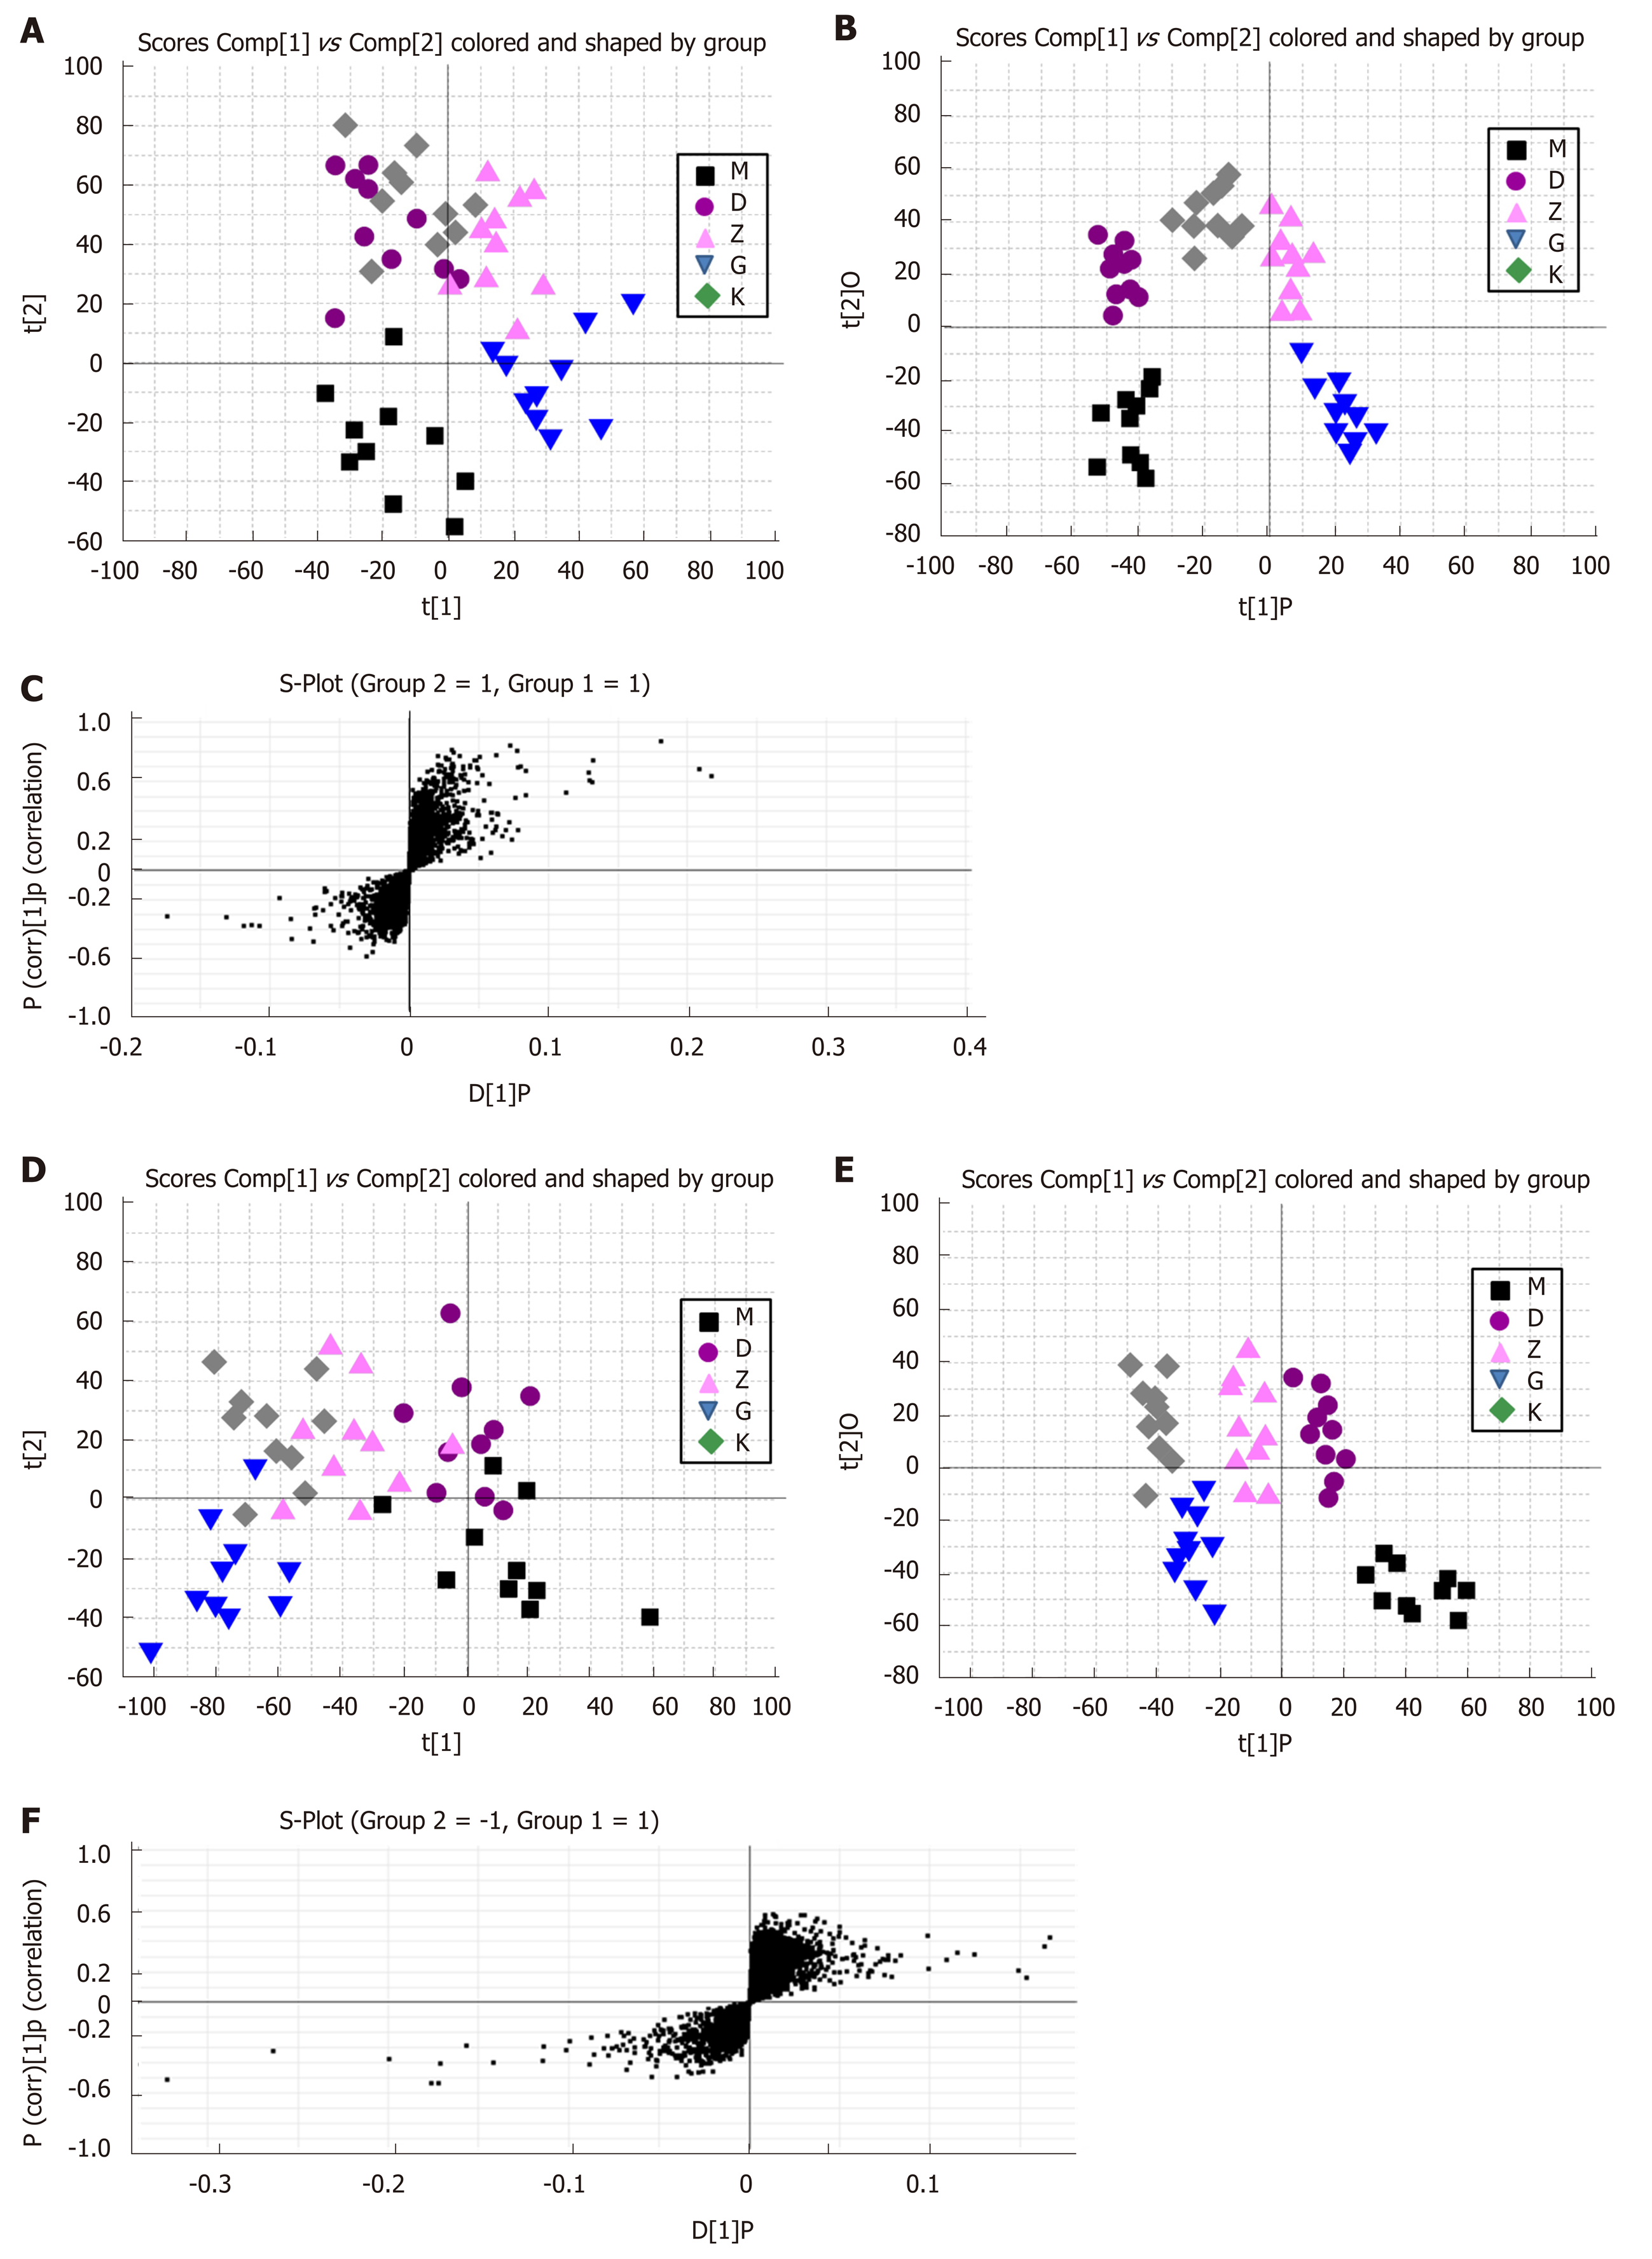
Figure 8 Score plot of metabolites in urine of rats treated for 14 d.
A: Urine principal component analysis score plot (positive ion); B: Urine orthogonal partial least squares discriminant analysis score plot (positive ion); C: Urine score plot (positive ion); D: Principal component analysis score plot (negative ion); E: Orthogonal partial least squares discriminant analysis score plot (negative ion); F: Urine score plot (negative ion). K: Normal group; M: Model control group; G: Tong Xie Yao Fang high dose group; Z: Tong Xie Yao Fang medium dose group; D: Tong Xie Yao Fang low dose group.
- Citation: Zhao XY, Wang JW, Yin Y, Li K, Zhang M, Yan FP. Effect of Tong Xie Yao Fang on endogenous metabolites in urine of irritable bowel syndrome model rats. World J Gastroenterol 2019; 25(34): 5134-5151
- URL: https://www.wjgnet.com/1007-9327/full/v25/i34/5134.htm
- DOI: https://dx.doi.org/10.3748/wjg.v25.i34.5134


