Copyright
©The Author(s) 2019.
World J Gastroenterol. Jul 21, 2019; 25(27): 3572-3589
Published online Jul 21, 2019. doi: 10.3748/wjg.v25.i27.3572
Published online Jul 21, 2019. doi: 10.3748/wjg.v25.i27.3572
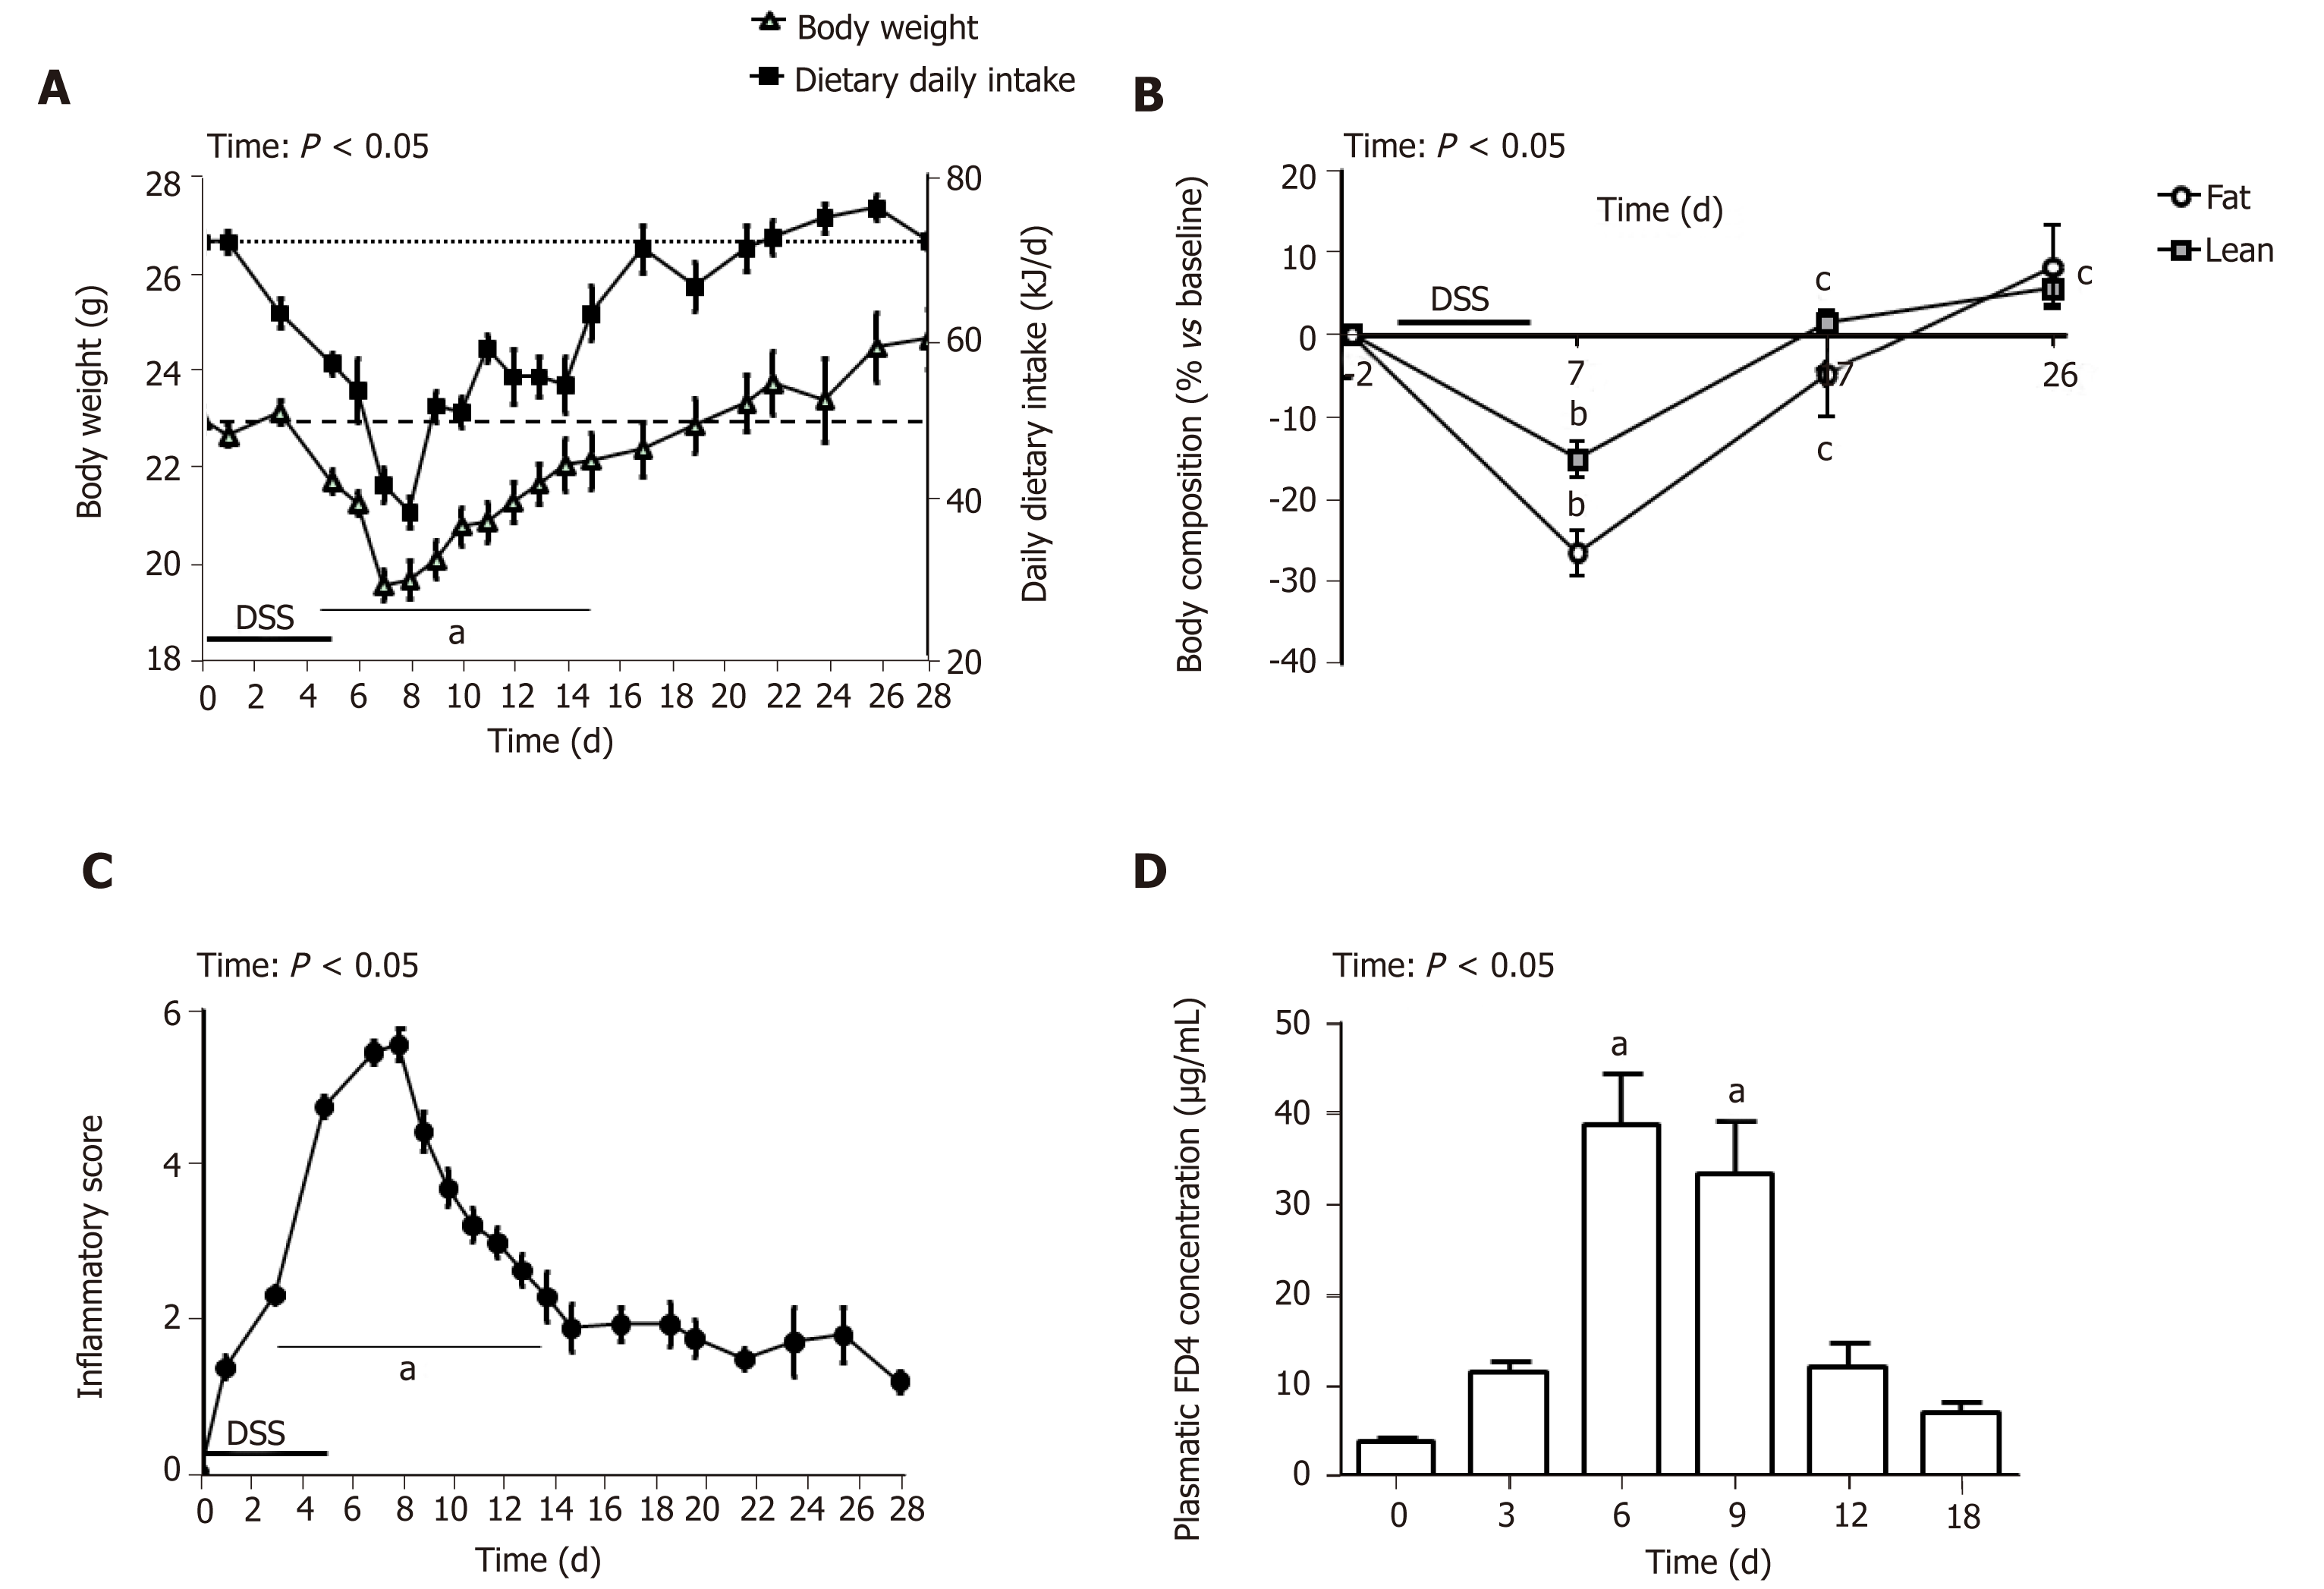
Figure 1 Follow-up parameters of dextran sodium sulfate-treated mice.
A: Evolution of daily dietary intake and body weight; B: Evolution of lean and fat mass versus baseline; C: Evolution of the macroscopic inflammatory score; D: In vivo fluorescein isothiocyanate-dextran permeability measurement. Values are means ± SE (n = 8-12). aP < 0.05 vs day 0; bP < 0.05 vs day -2; cP < 0.05 vs day 7. FD4: Fluorescein Isothiocyanate-dextran; DSS: Dextran sodium sulfate.
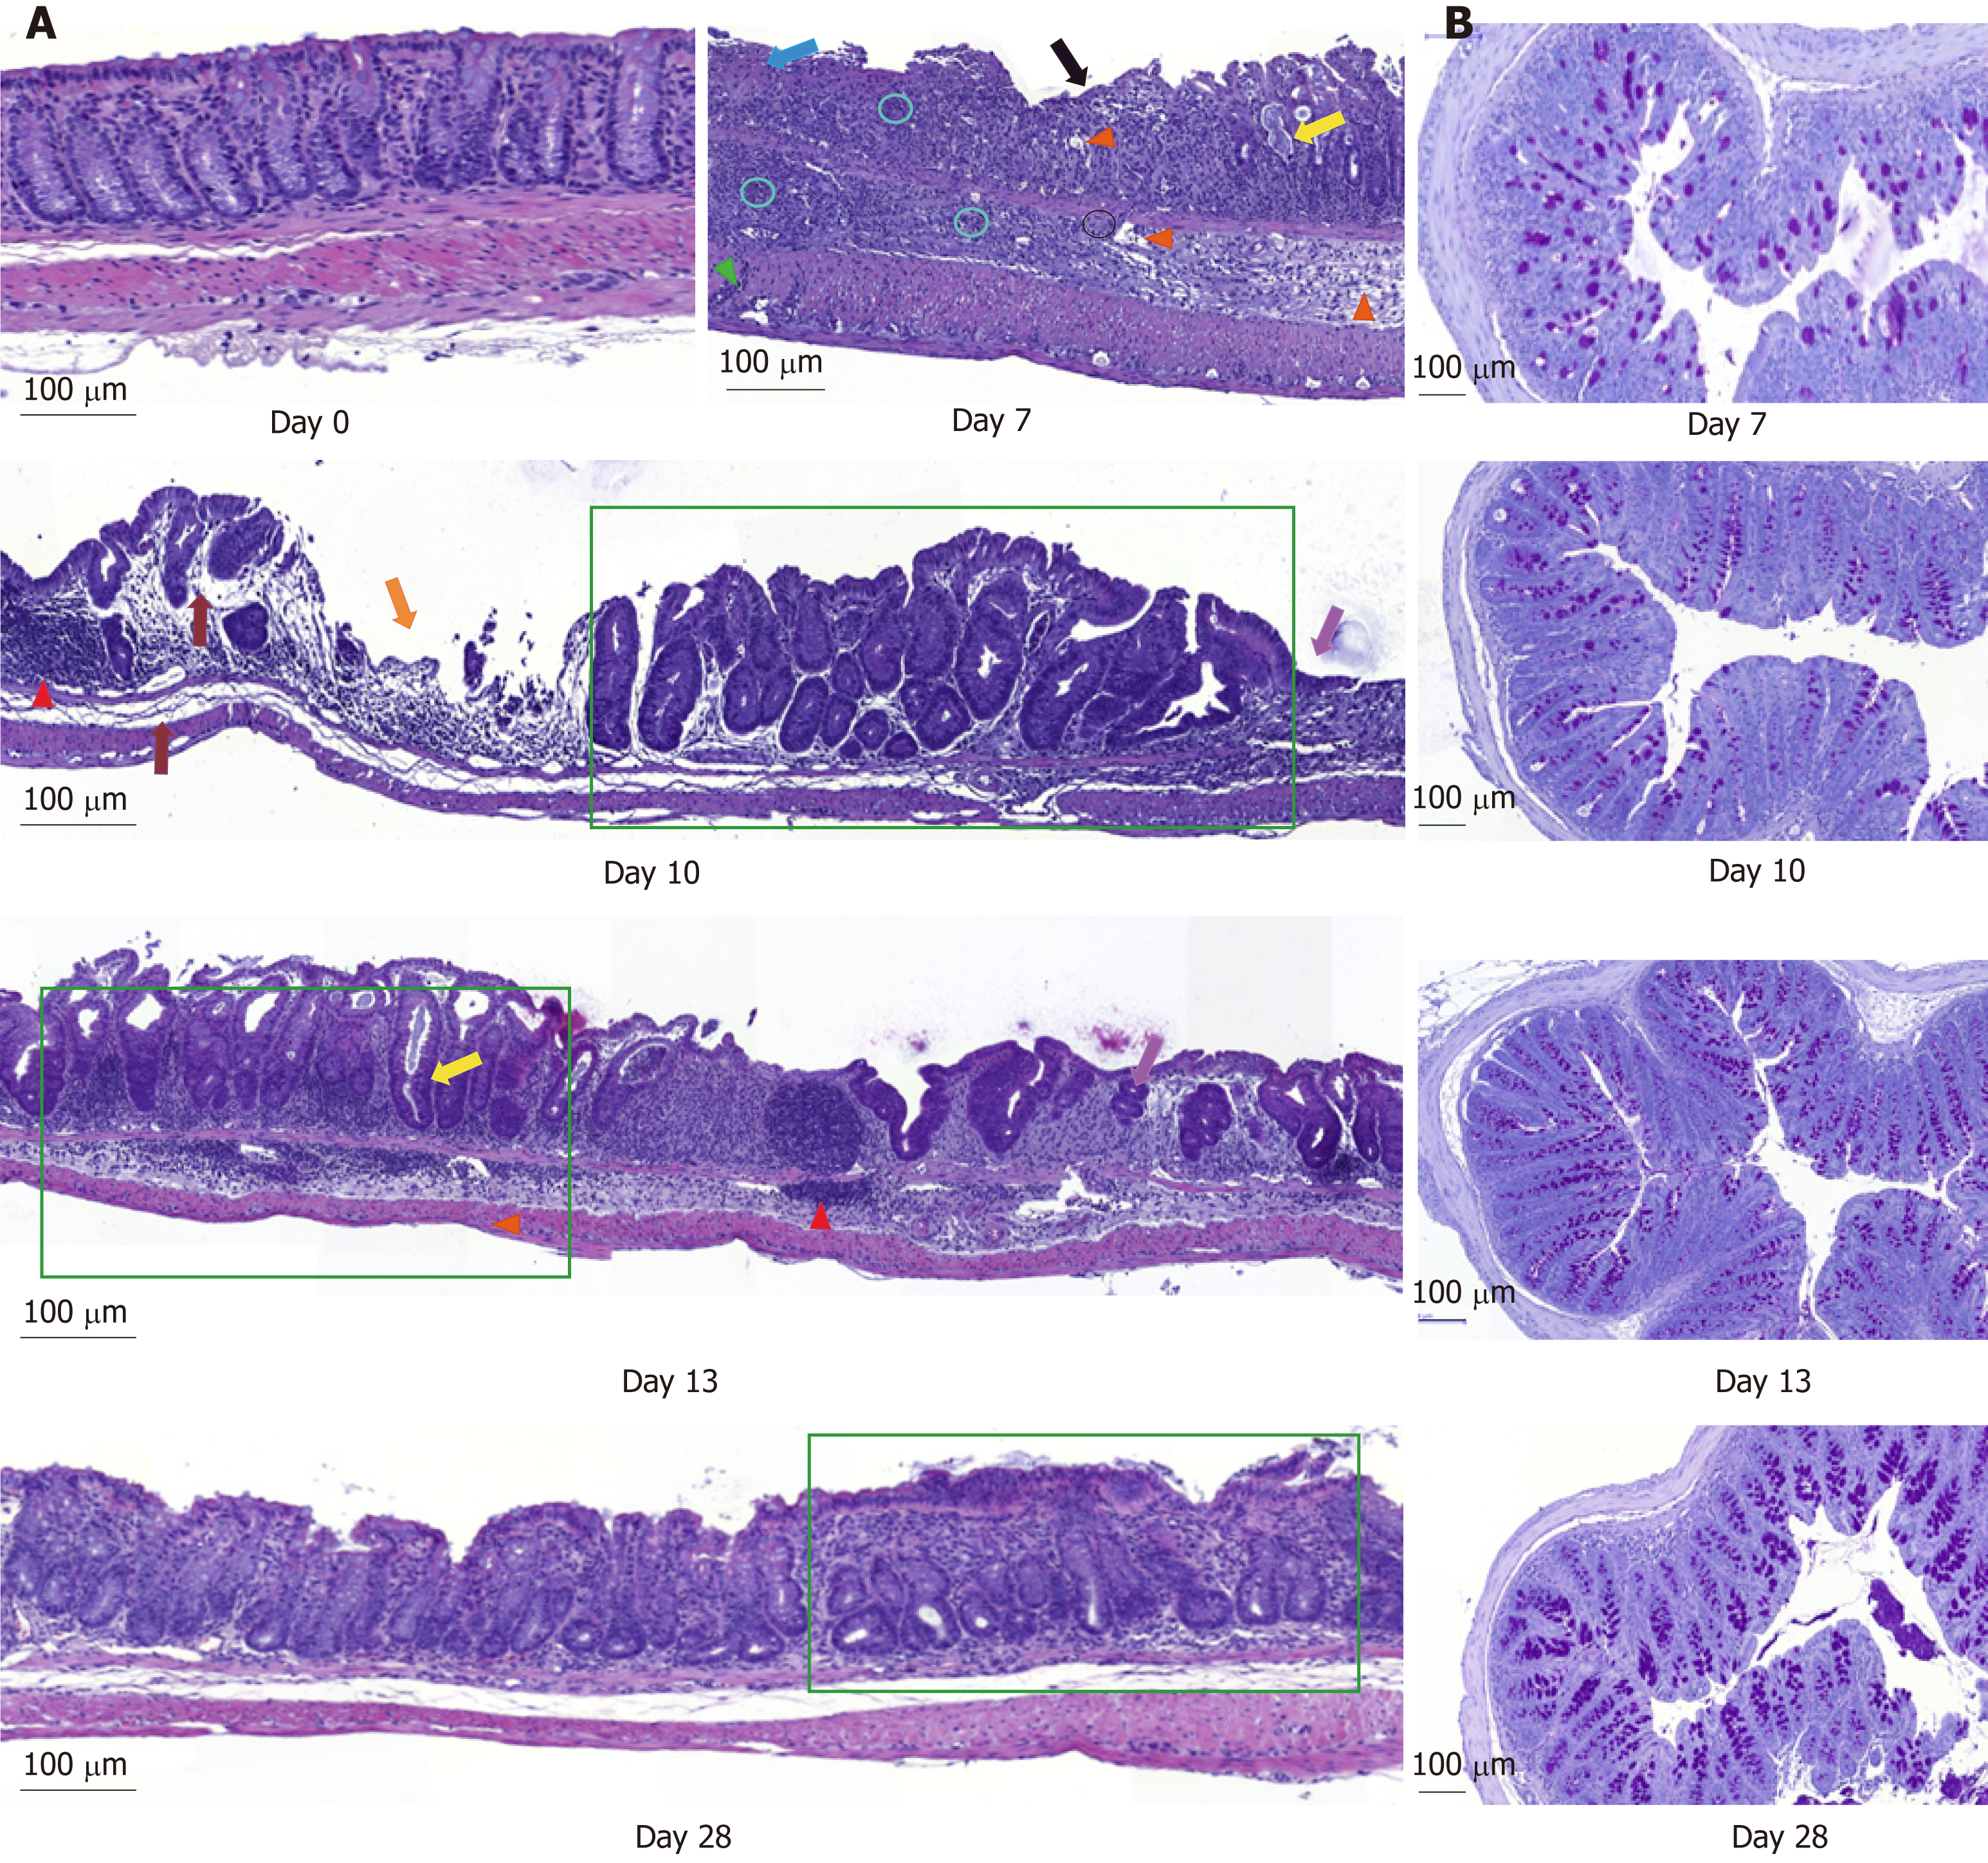
Figure 2 Histological examination of longitudinal and transversal colonic sections stained either with hematoxylin-and-eosin or with Periodic-acid Schiff.
Magnification: 10 ×. A: Colon sections of the control mice at day 0 and dextran sodium sulfate-treated mice at days 7, 10, 13 and 28 (Blue arrow: Focal ulceration accompanied by fibrin; Circle: Clusters of neutrophils within mucosa and submucosa; Green arrow: Transmural increase of mononuclear cells; Pink arrow: Clear space due to of edema; Yellow arrow: Cyst formation; Red arrow: Mucosal lymphocytosis; Green rectangle: Crypt architectural disarray and crypt abscess; Grey arrow: Edema; Orange arrow: Multifocal ulceration; Violet arrow: Focal re-epithelization); B: Histological illustration of Periodic-acid Schiff staining during time. Scale bar: 100 µm.
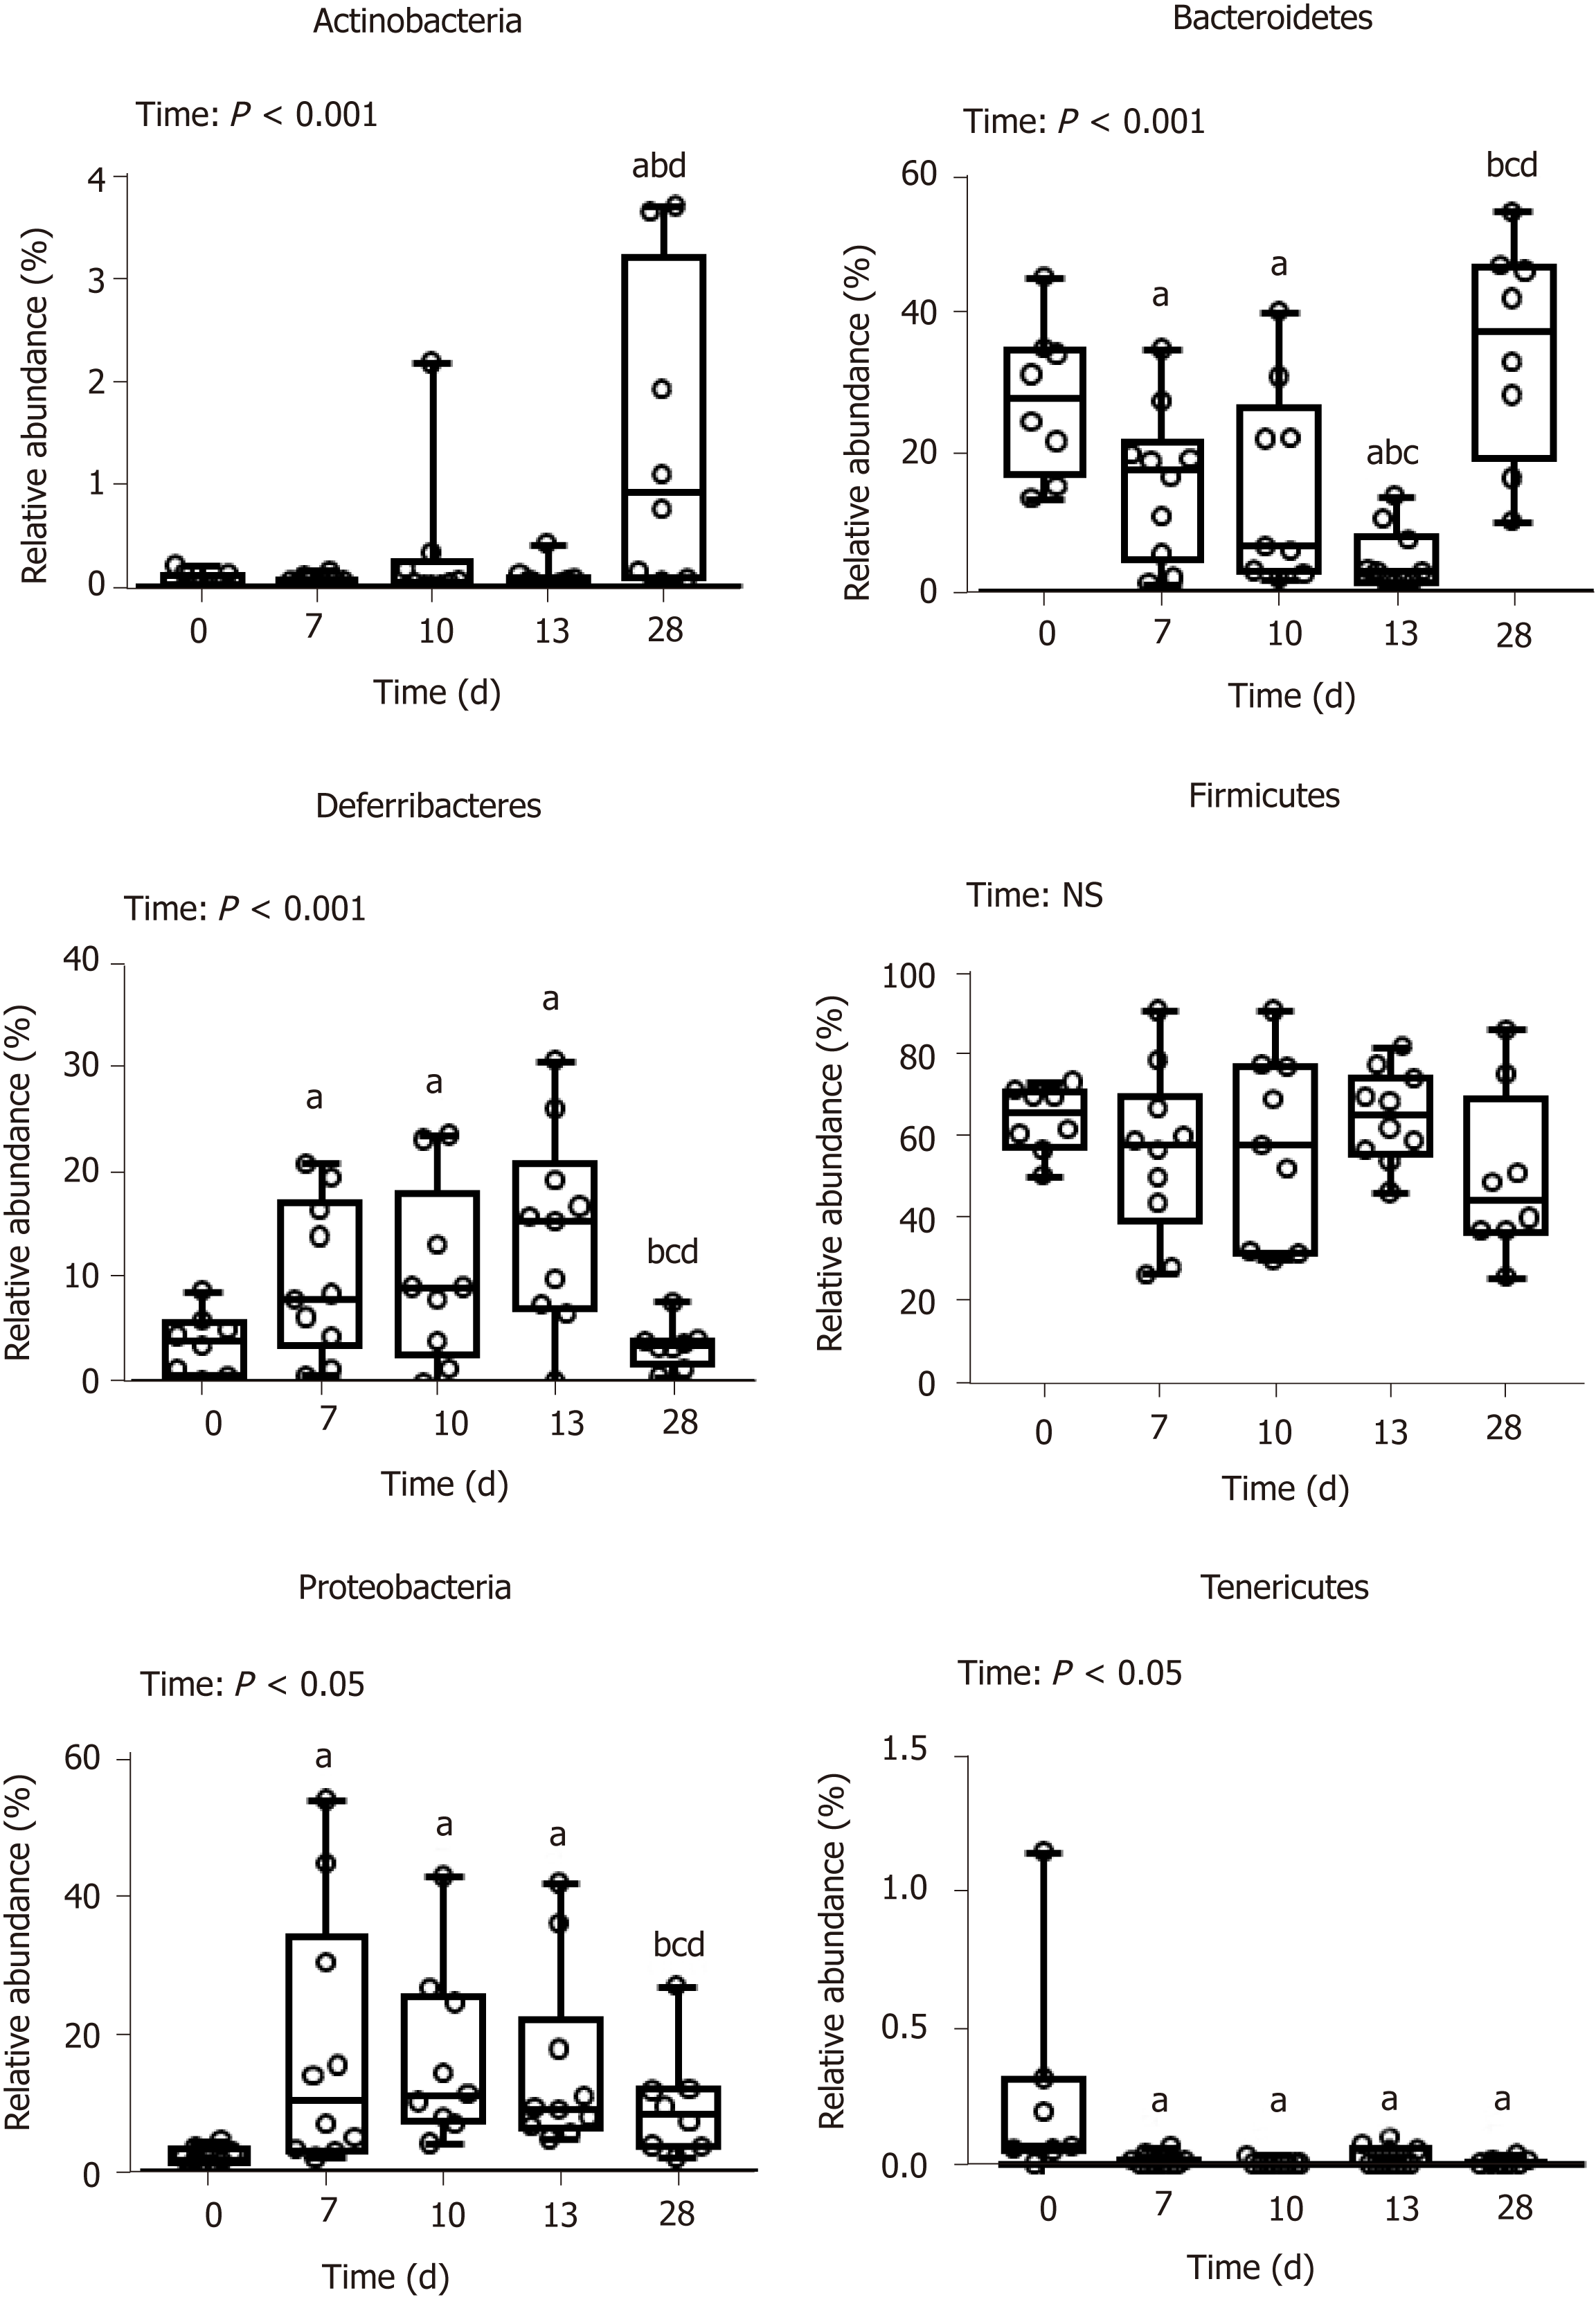
Figure 3 Phylum-relative abundance of mucosa-adherent microbiota.
Values are means ± SE (n = 8-12). Means with different superscripts are significantly different. aP < 0.05 vs day 0; bP < 0.05 vs day 7, cP < 0.05 vs day 10; dP < 0.05 vs day 13. SE: Standard error; NS: Non-significant difference.
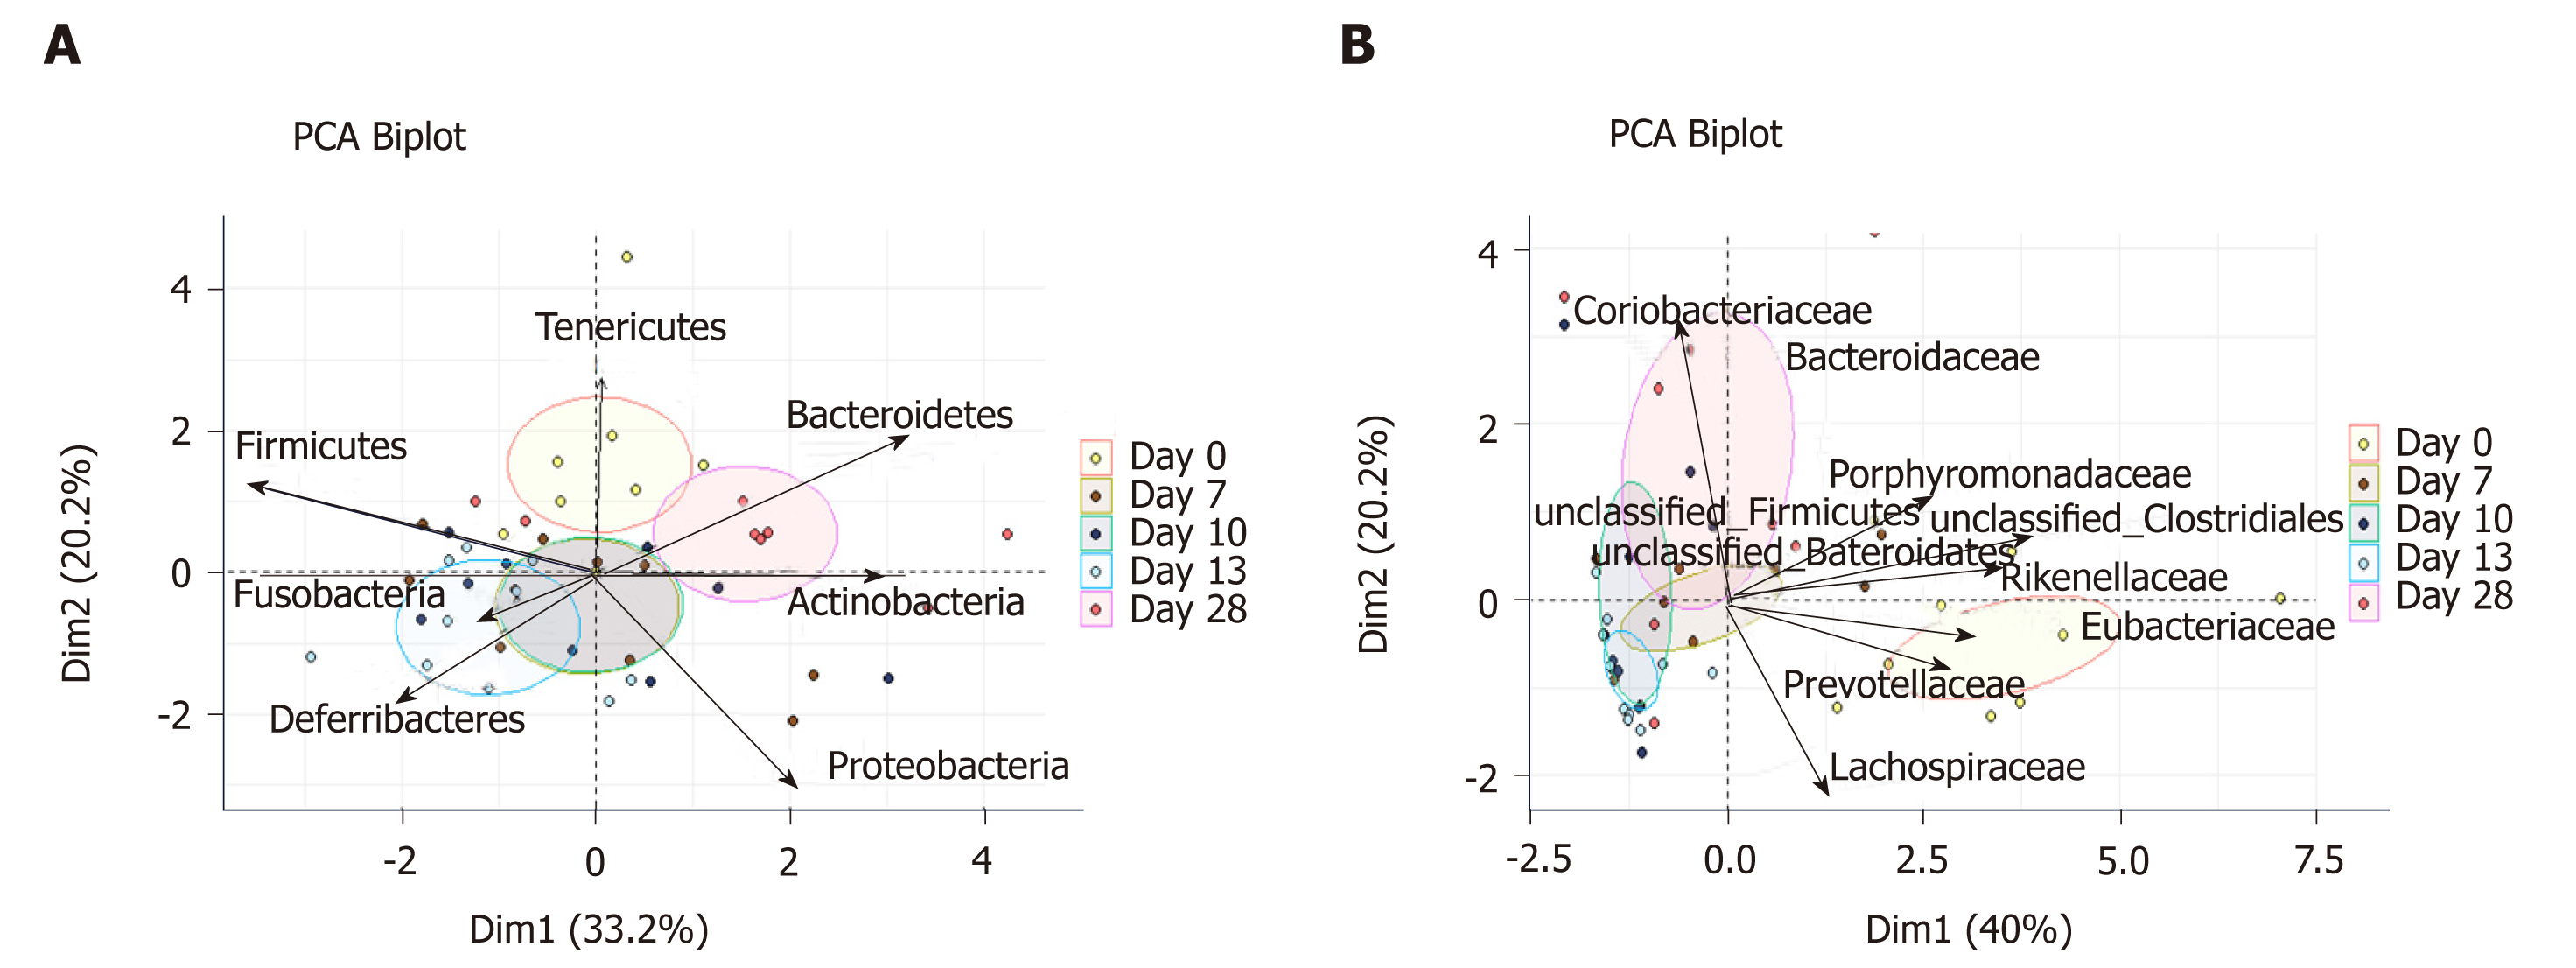
Figure 4 Principal component analysis of relative abundances of mucosa-adherent microbiota.
A: Phylum level; B: Family level. Partial sample clustering by time was observed. PCA: Principal component analysis.
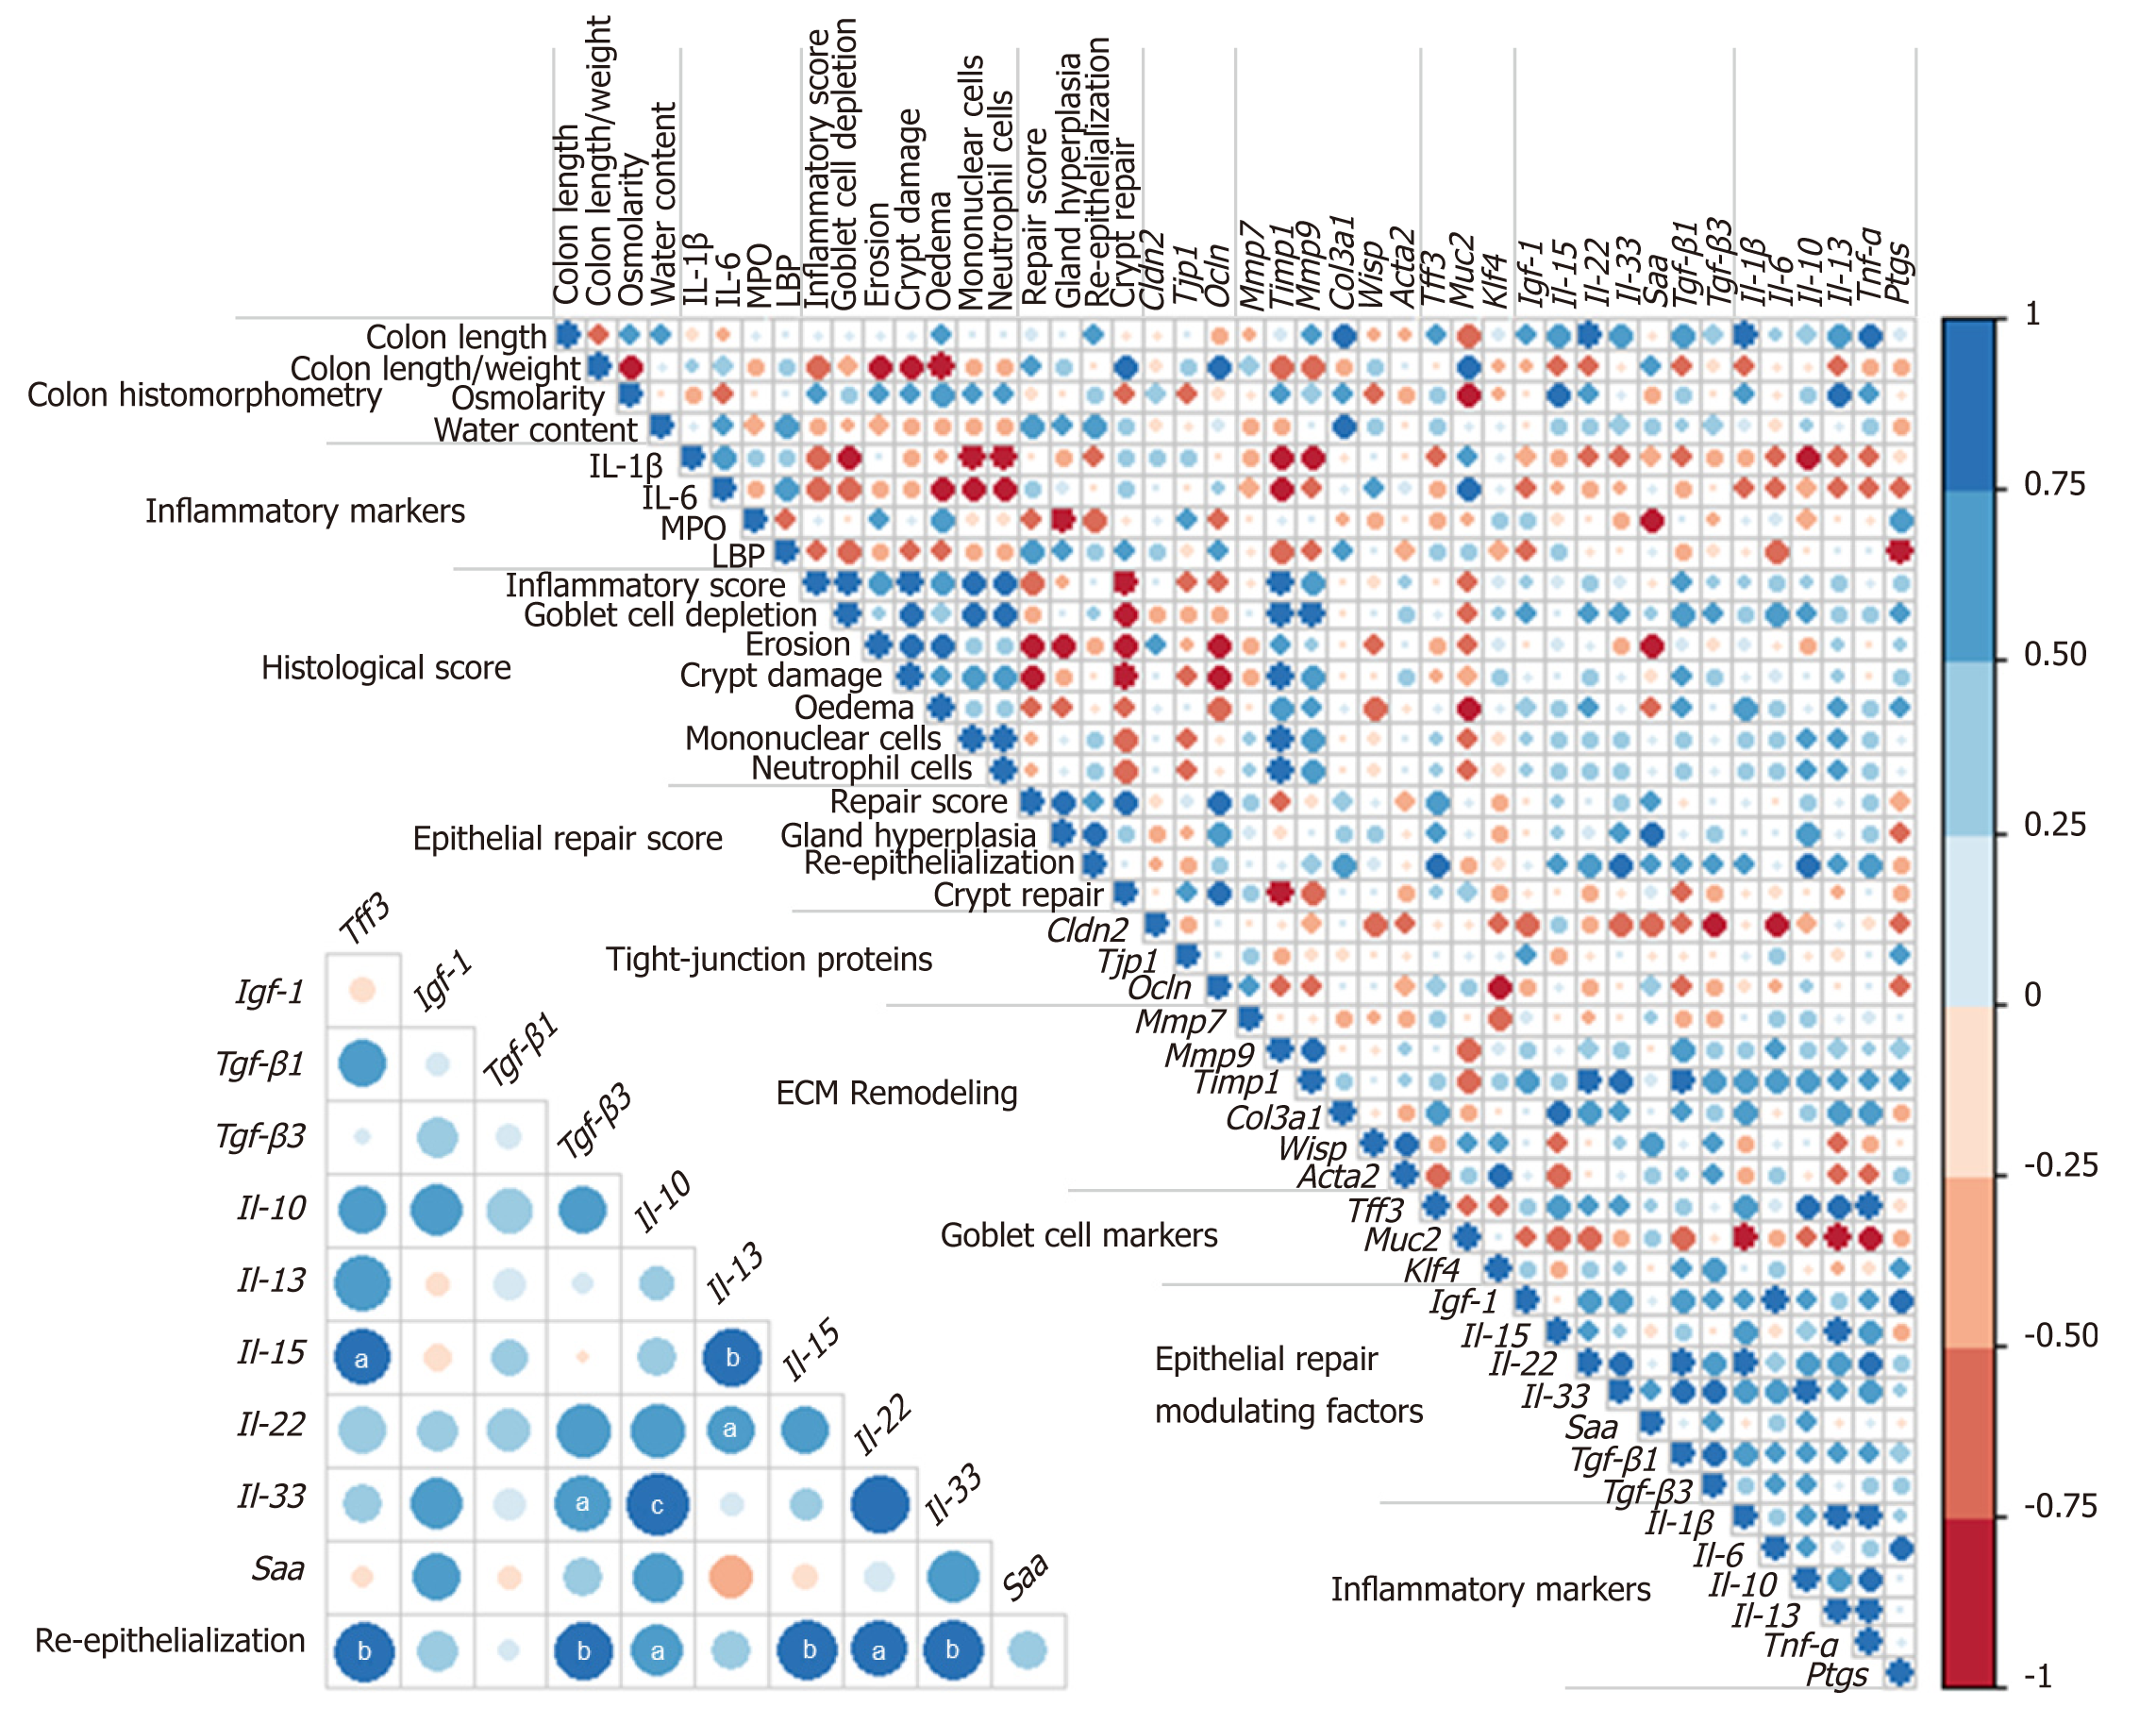
Figure 5 Correlation matrix of analytical parameters involved in inflammation and repair at day 13.
Color intensity represents the degree of association between the parameters as measured by Spearman’s correlations. Blue color indicates positive association and red color negative association. Lower triangular matrix corresponds to associations between histological re-epithelialization score and gene expression value of mucosal repairing factors. Statistically significant correlations are indicated with aP < 0.05, bP < 0.01 cP < 0.001. (n = 8-12). ECM: Extracellular matrix; LBP: Lipopolysaccharide-binding protein; MPO: Myeloperoxidase activity.
- Citation: Vidal-Lletjós S, Andriamihaja M, Blais A, Grauso M, Lepage P, Davila AM, Gaudichon C, Leclerc M, Blachier F, Lan A. Mucosal healing progression after acute colitis in mice. World J Gastroenterol 2019; 25(27): 3572-3589
- URL: https://www.wjgnet.com/1007-9327/full/v25/i27/3572.htm
- DOI: https://dx.doi.org/10.3748/wjg.v25.i27.3572


