Copyright
©The Author(s) 2019.
World J Gastroenterol. Jun 21, 2019; 25(23): 2947-2960
Published online Jun 21, 2019. doi: 10.3748/wjg.v25.i23.2947
Published online Jun 21, 2019. doi: 10.3748/wjg.v25.i23.2947
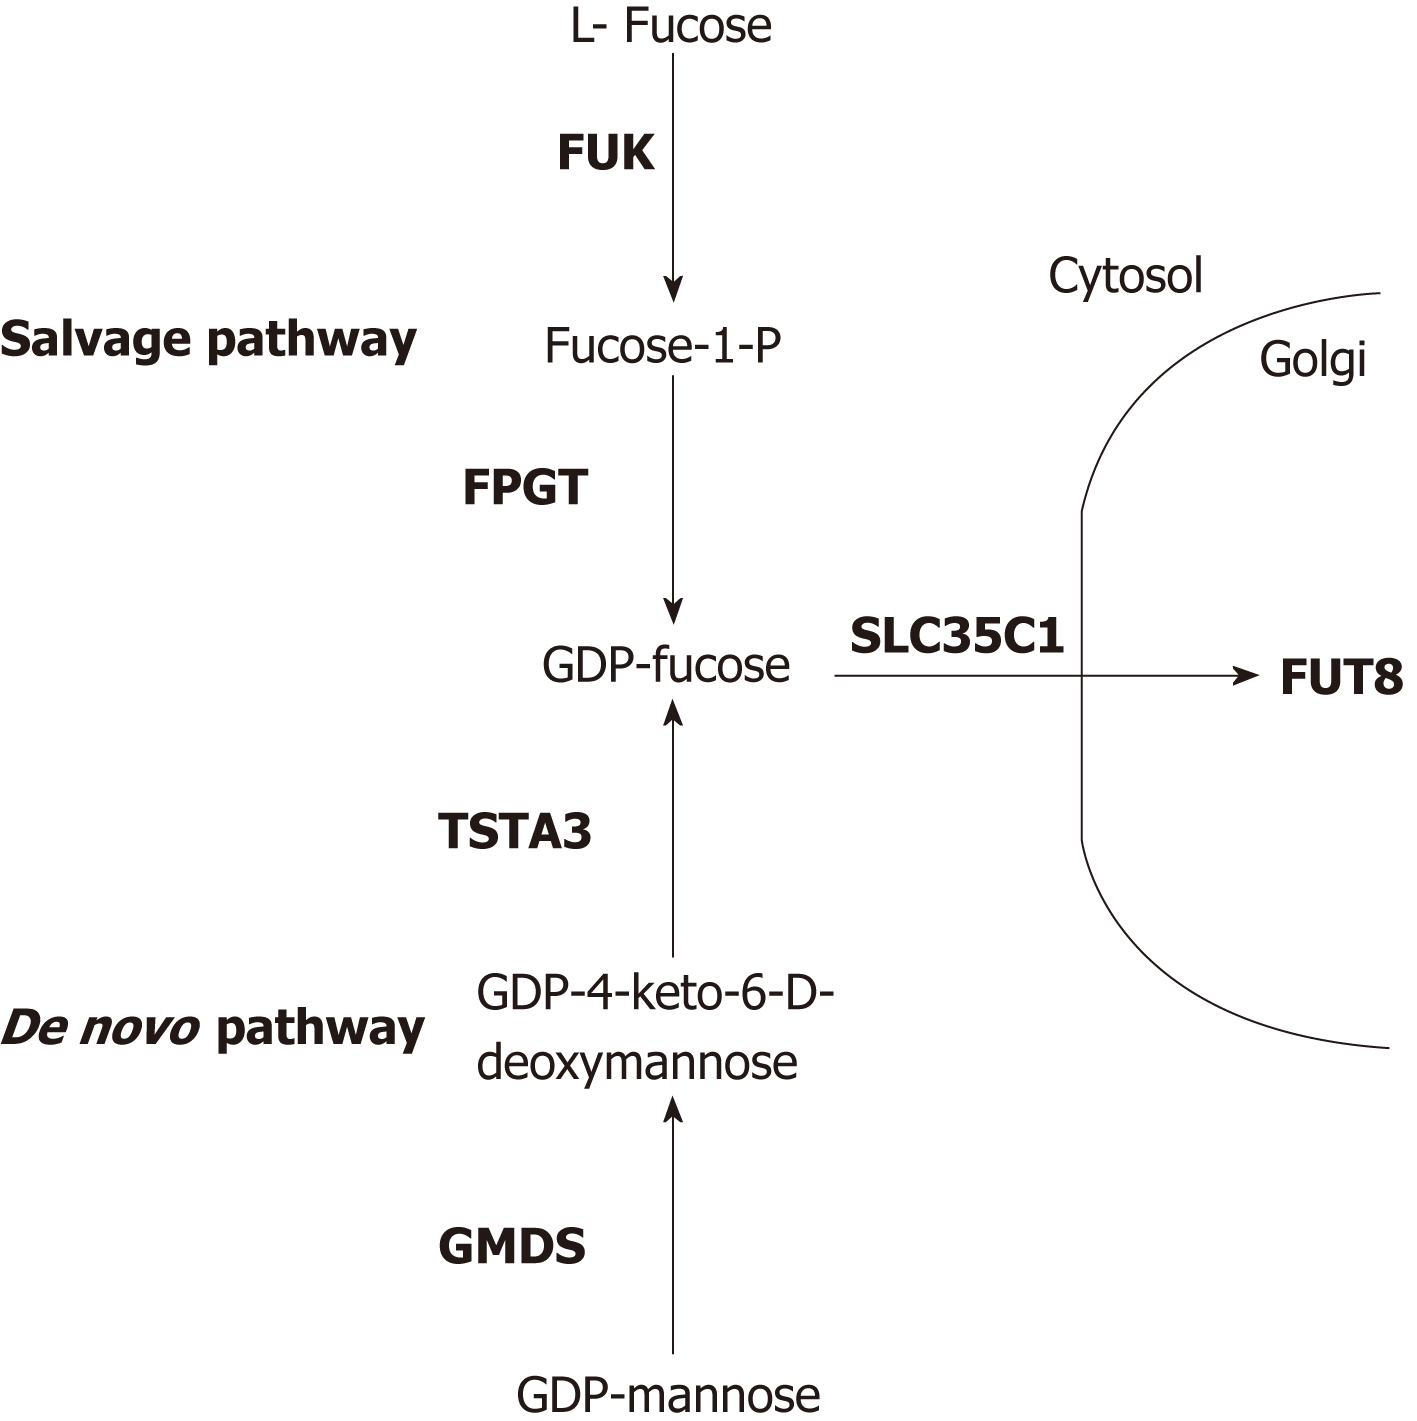
Figure 1 Diagram of the proteins and precursor/product sugars involved with guanosine diphosphate-fucose synthesis, Golgi transport and attachment of core fucose to N-linked glycoproteins.
Proteins are designated by the symbols of the genes that encode them (bold). The more dominant de novo synthesis pathway is shown at the bottom, the salvage pathway is at the top. Diagram is based on previous studies[5,13]. GDP: Guanosine diphosphate.
Figure 2 Oncoprint display of genetic events and gene expression changes in liver hepatocellular carcinoma samples for the six genes involved in generating core fucose.
Alterations for each gene are indicated in each horizontal row, with the order of the genes in the display chosen randomly. Data for each individual patient sample is aligned vertically. Only the 185 affected samples are displayed; the other 188 showed no changes above thresholds. The types of alterations detected are indicated by the key at the bottom. Data was generated as described in the materials and methods.
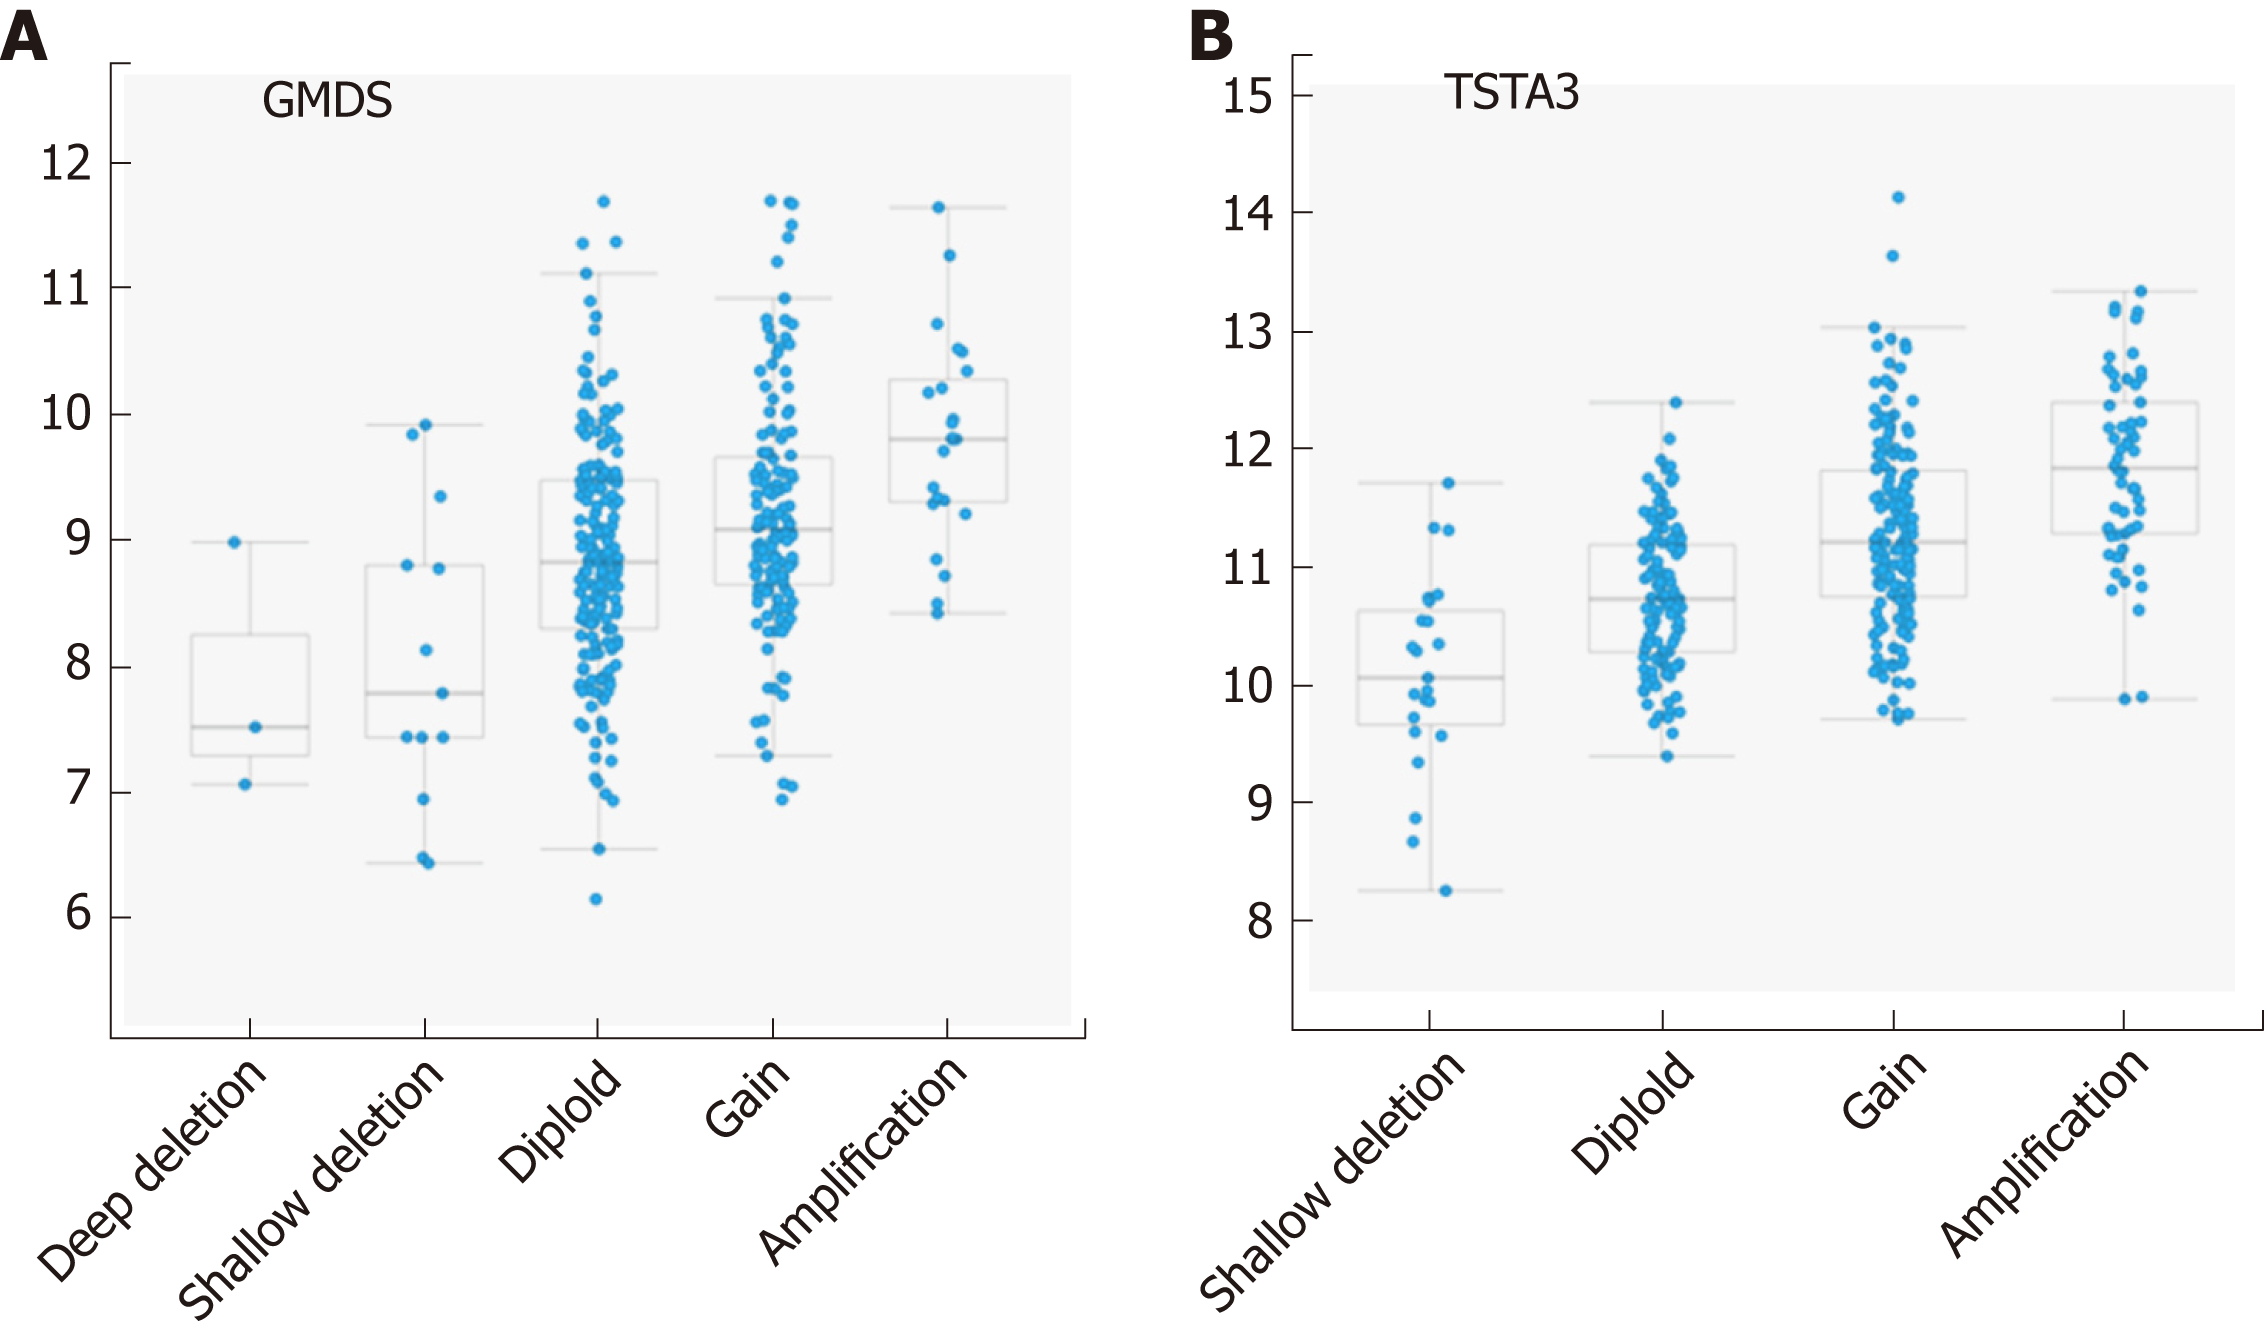
Figure 3 Correlation plots illustrating the relationship between mRNA expression levels for GMDS and TSTA3 on the Y axes (log base 2) and putative copy number changes (GISTIC2 calls, see materials and methods[26]) on the X axes.
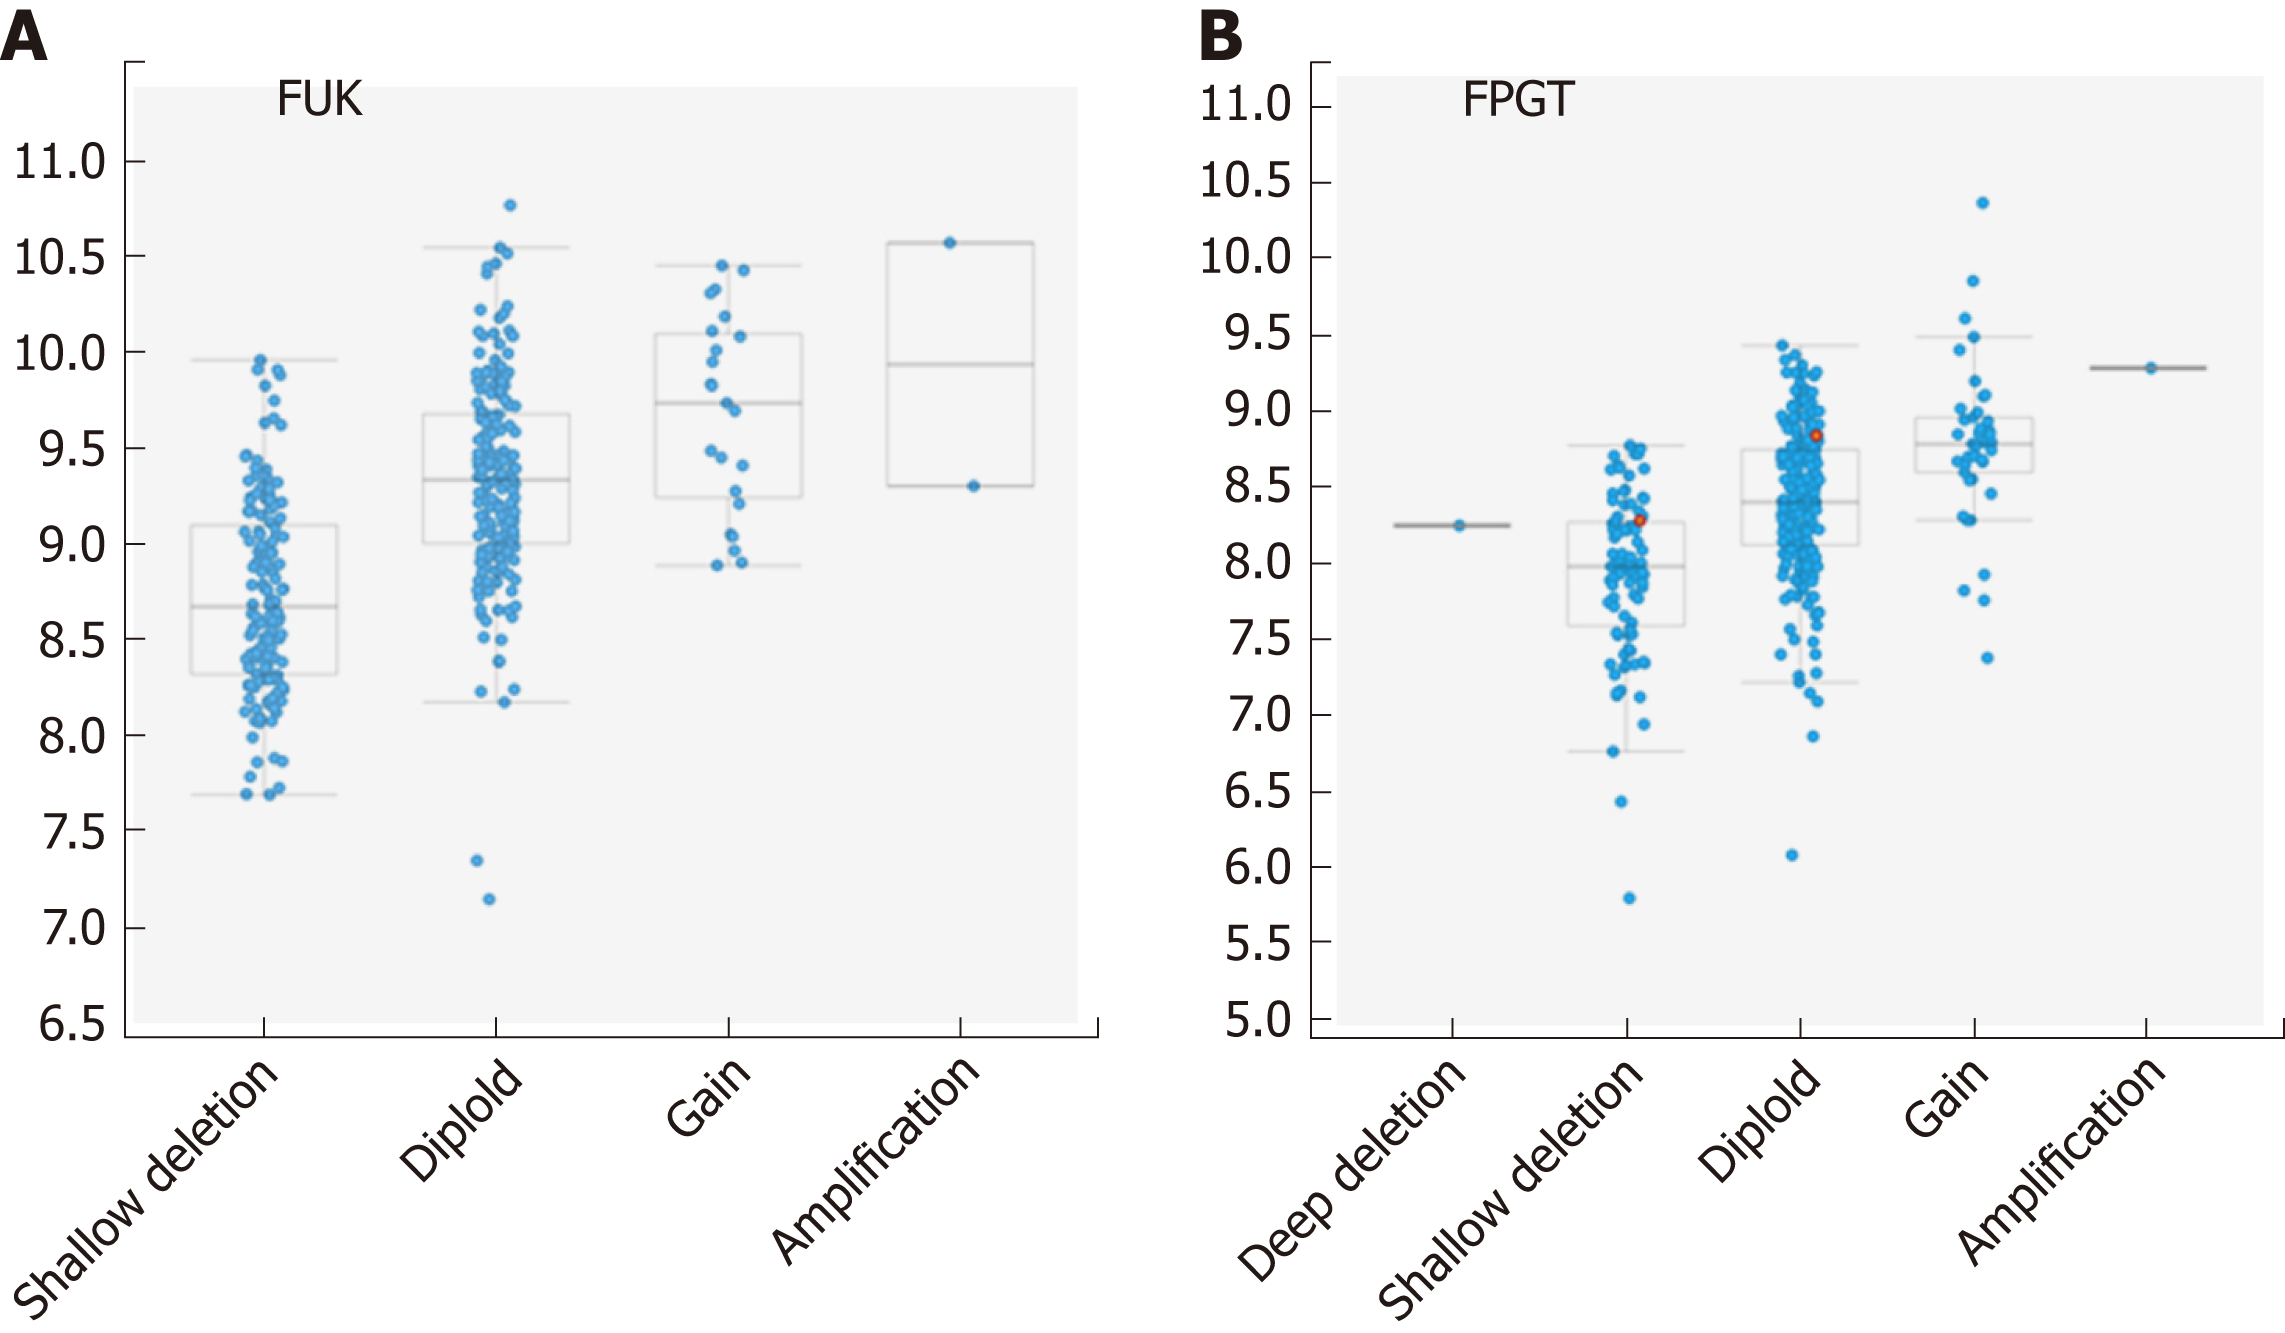
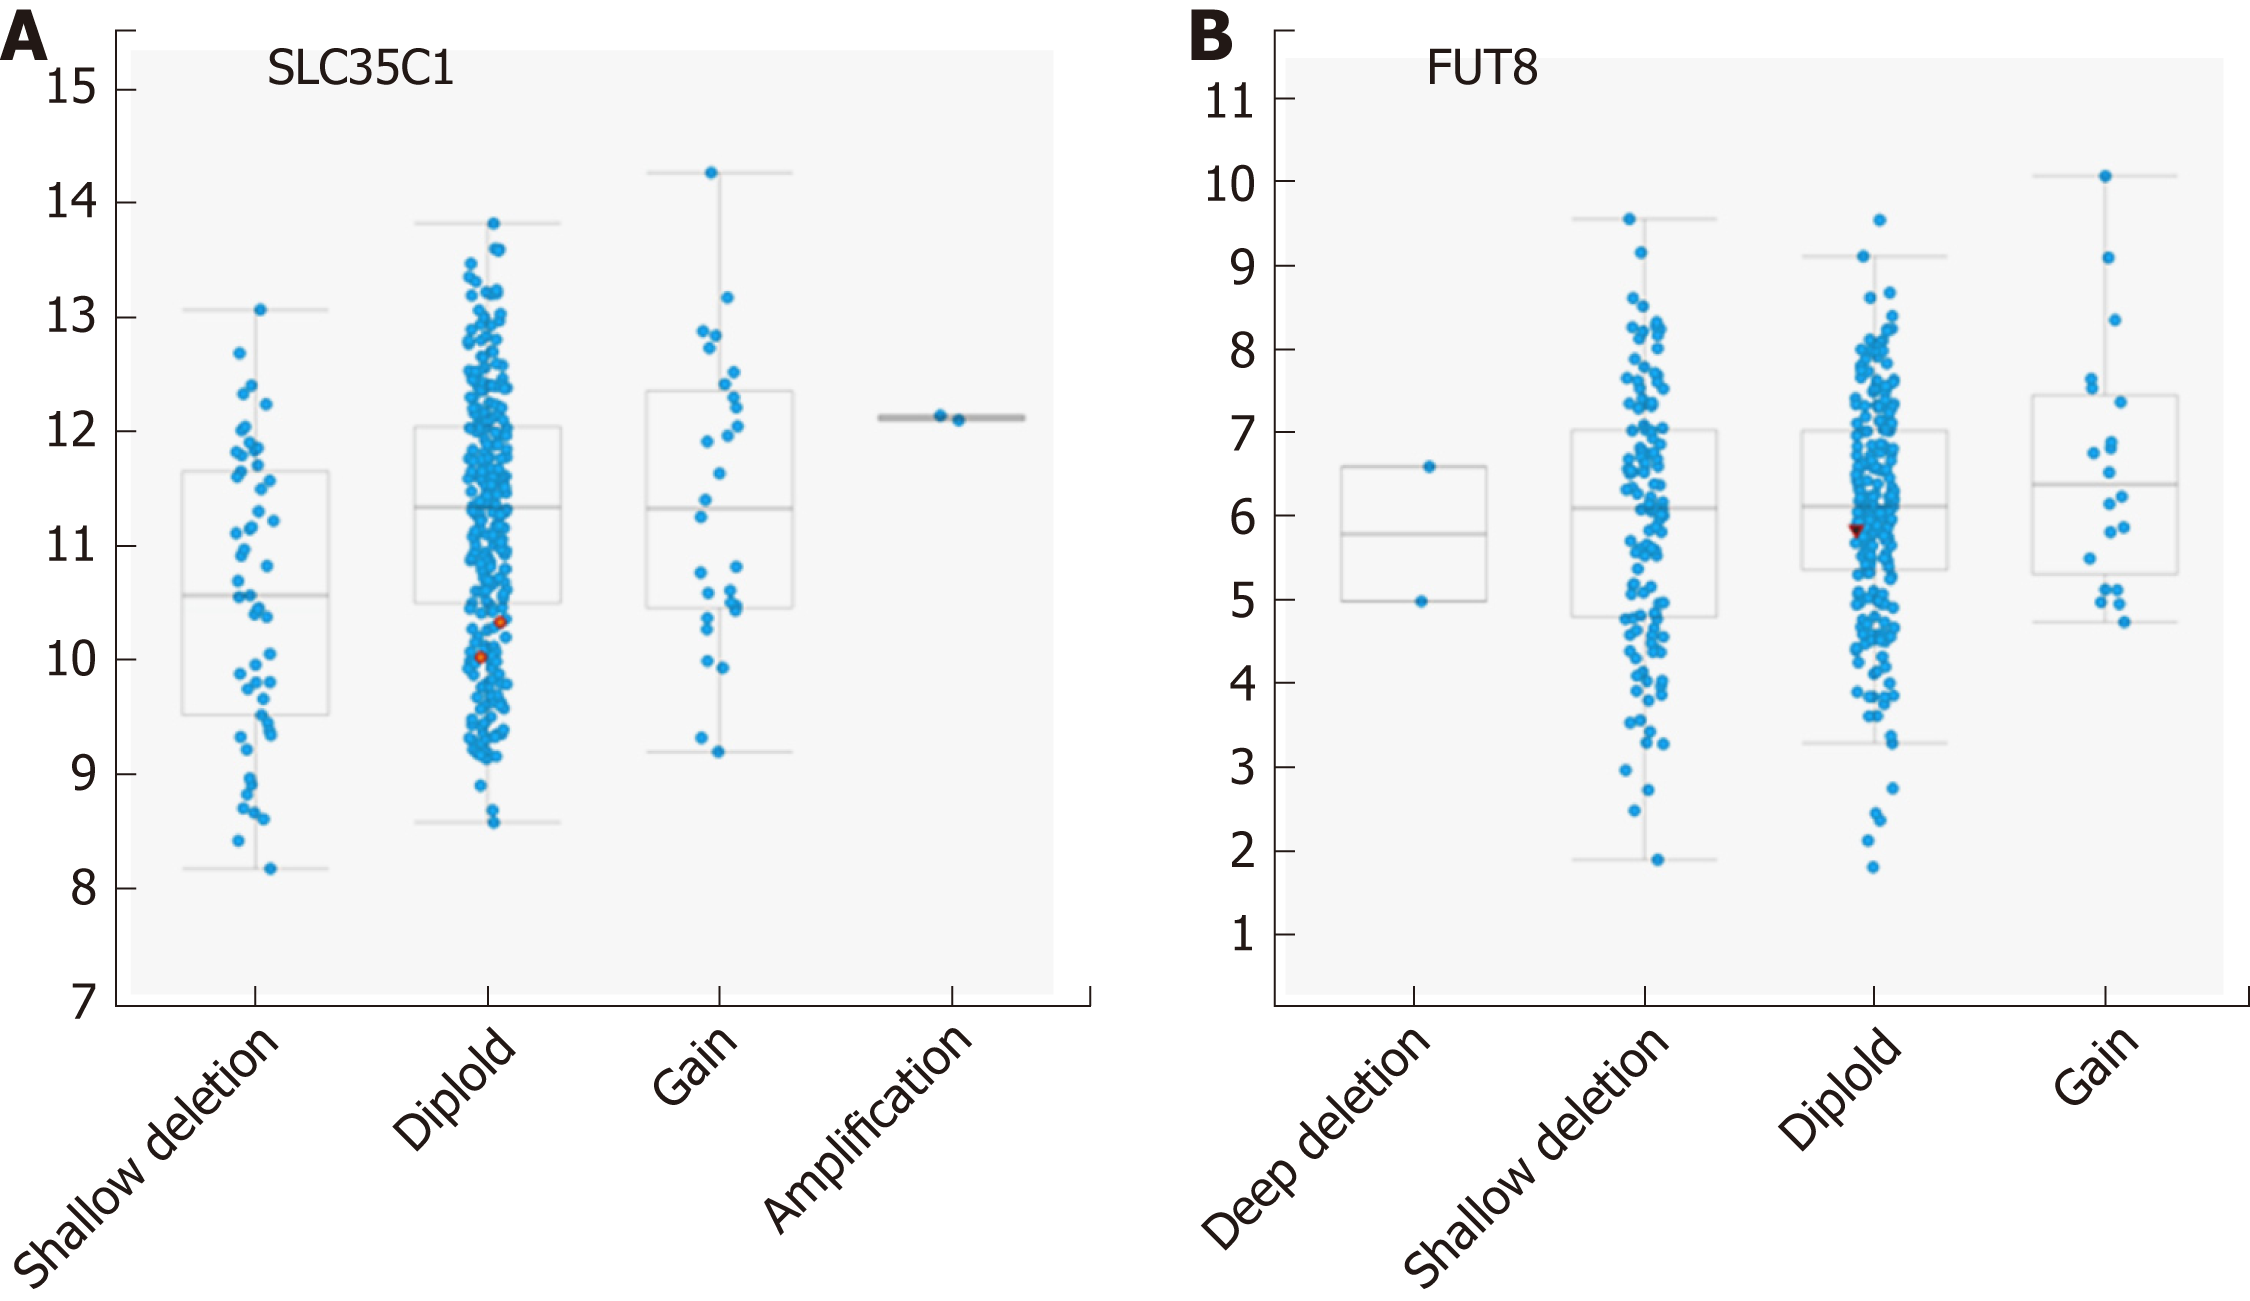
Possible GISTIC2 scores are -2 = Deep (homozygous) deletion; -1 = Shallow (hemizygous) deletion; 0 = neutral/diploid; 1 = gain (low copy); 2 = high level amplification.
Figure 4 Correlation plots illustrating the relationship between mRNA expression levels for FUK and FPGT.
Axes and scoring scale are as for Figure 3.
Figure 5 Correlation plots illustrating the relationship between mRNA expression levels for FUT8 and SLC35C1.
Axes and scoring scale are as for Figure 3.
- Citation: Norton PA, Mehta AS. Expression of genes that control core fucosylation in hepatocellular carcinoma: Systematic review. World J Gastroenterol 2019; 25(23): 2947-2960
- URL: https://www.wjgnet.com/1007-9327/full/v25/i23/2947.htm
- DOI: https://dx.doi.org/10.3748/wjg.v25.i23.2947


