Copyright
©The Author(s) 2019.
World J Gastroenterol. Jun 21, 2019; 25(23): 2911-2923
Published online Jun 21, 2019. doi: 10.3748/wjg.v25.i23.2911
Published online Jun 21, 2019. doi: 10.3748/wjg.v25.i23.2911
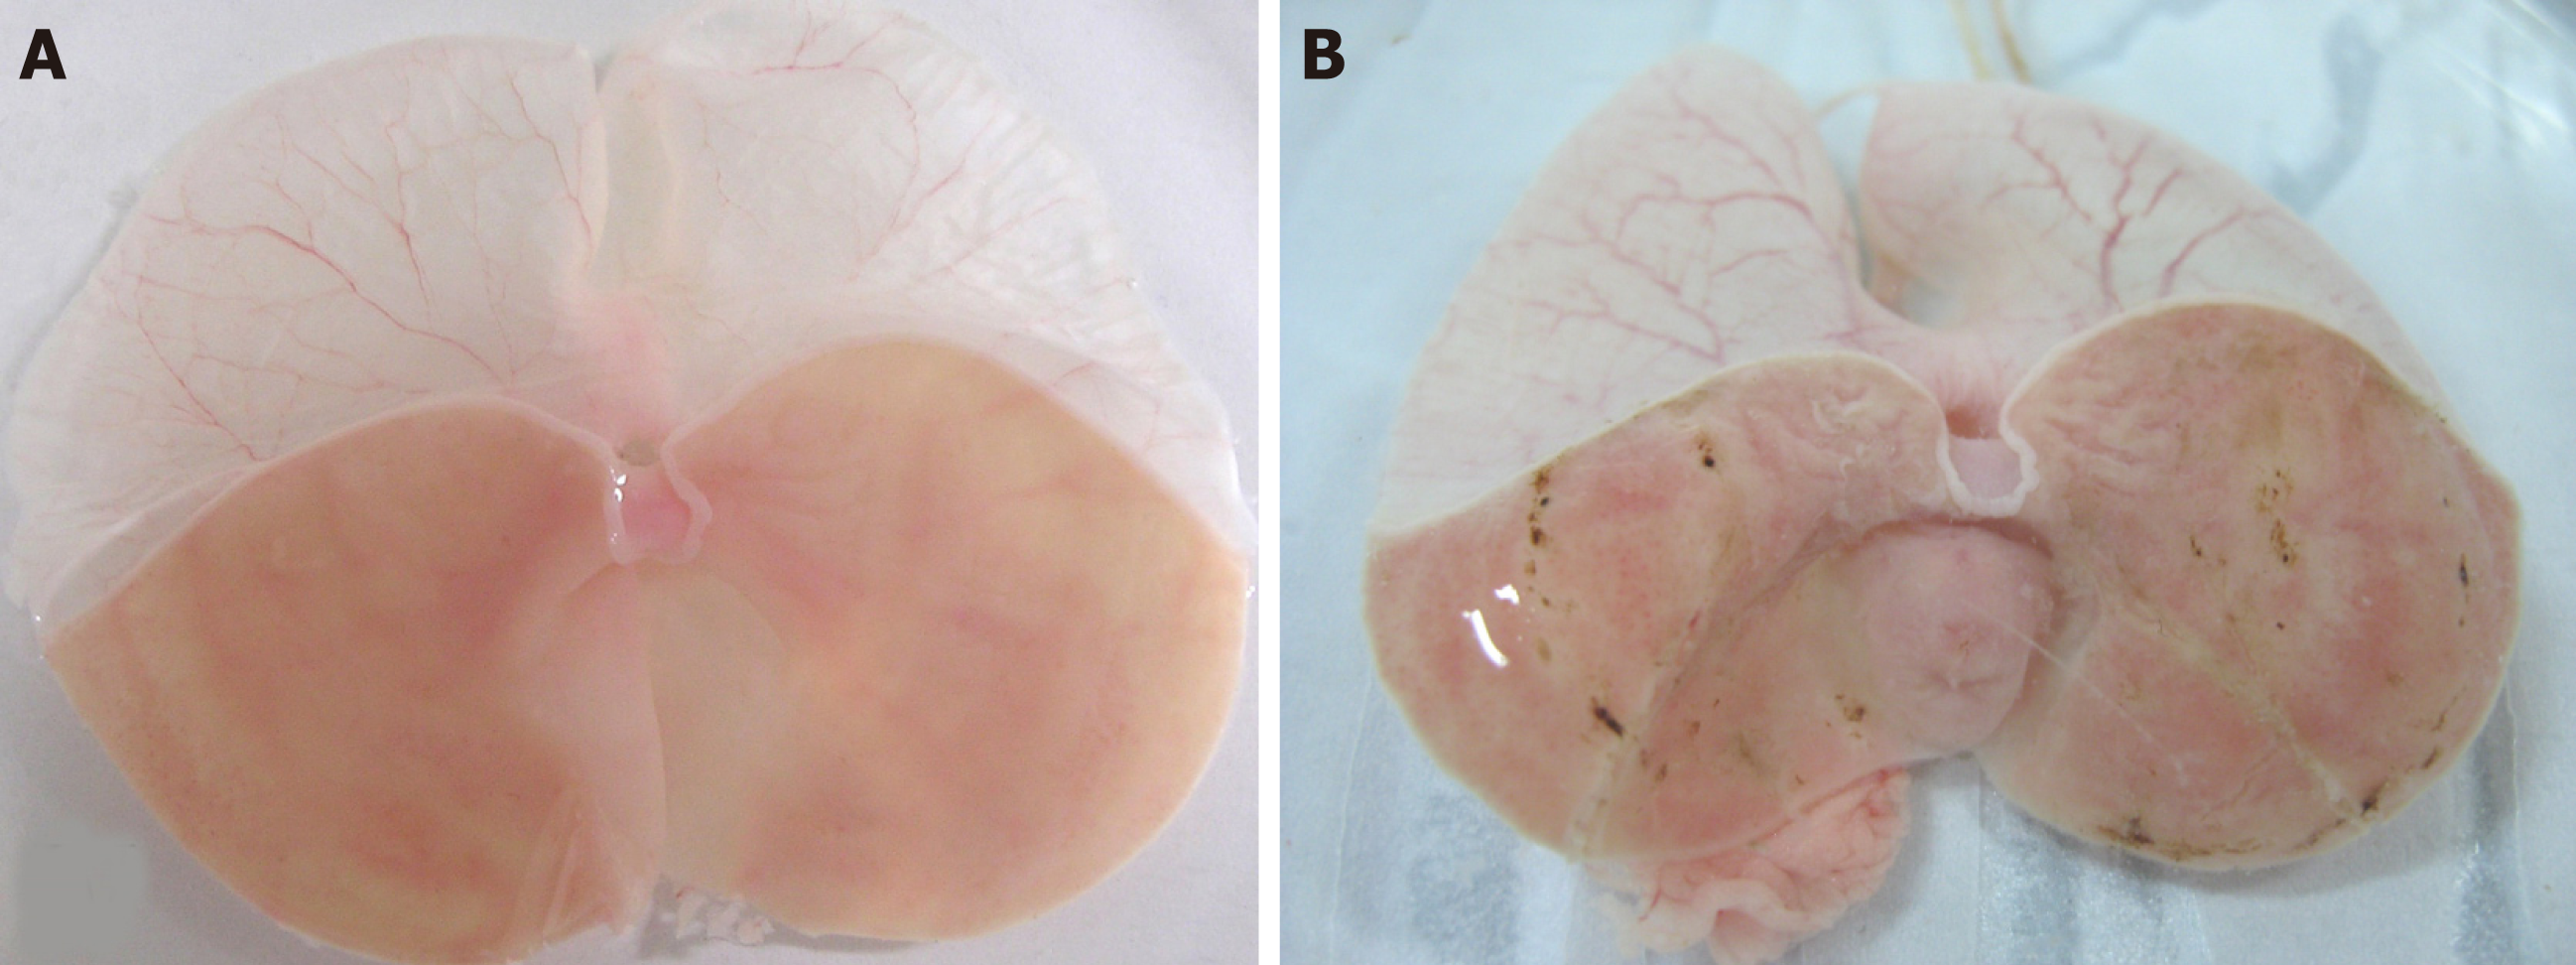
Figure 1 Gastric mucosal damage induced by restraint water-immersion stress.
A: Control group. The gastric mucosal surface was intact and smooth; B: Stressed group. The gastric mucosal surface showed spotty and linear haemorrhages after 4 h of restraint water-immersion stress.
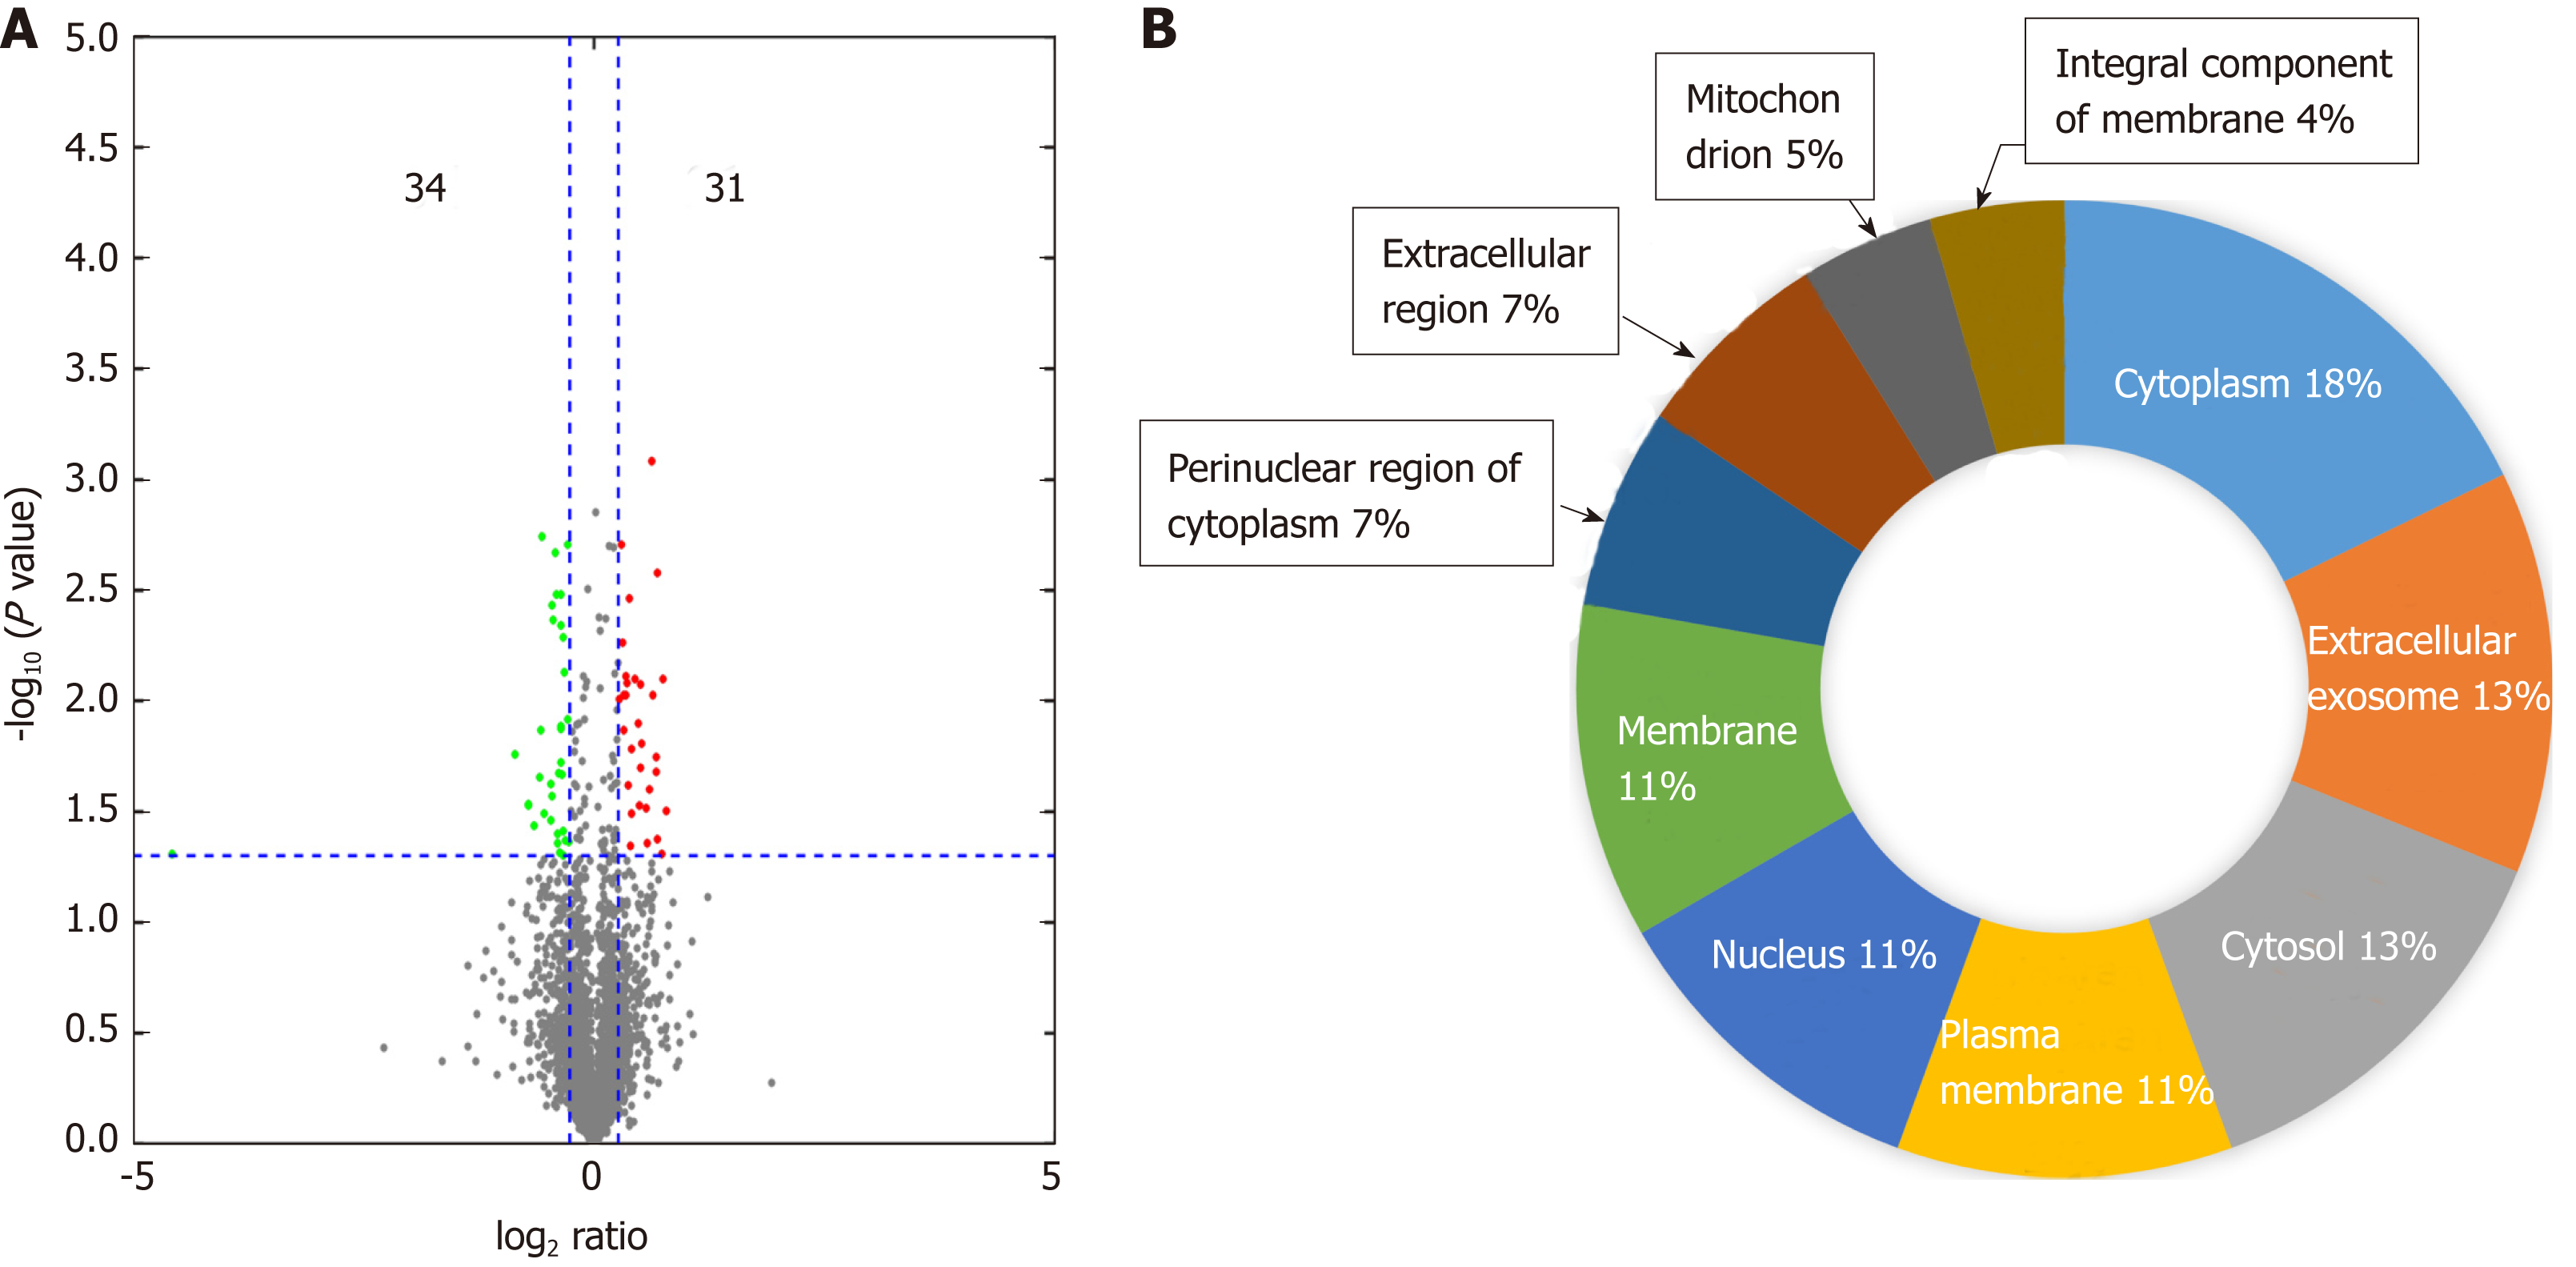
Figure 2 Features of the proteomic data from rats subjected to restraint water-immersion stress for 0 h and 4 h.
The data were obtained by isobaric tags for relative and absolute quantitation shotgun analysis. A: Volcano plot indicating the changes in protein abundance in the mediodorsal thalamic nucleus between the control and stressed rats. A total of 65 dysregulated proteins with at least a ±1.2-fold change and P < 0.05 were identified. Orange dots indicate the upregulated proteins, and blue dots indicate the downregulated proteins; B: Subcellular localizations of the identified proteins.
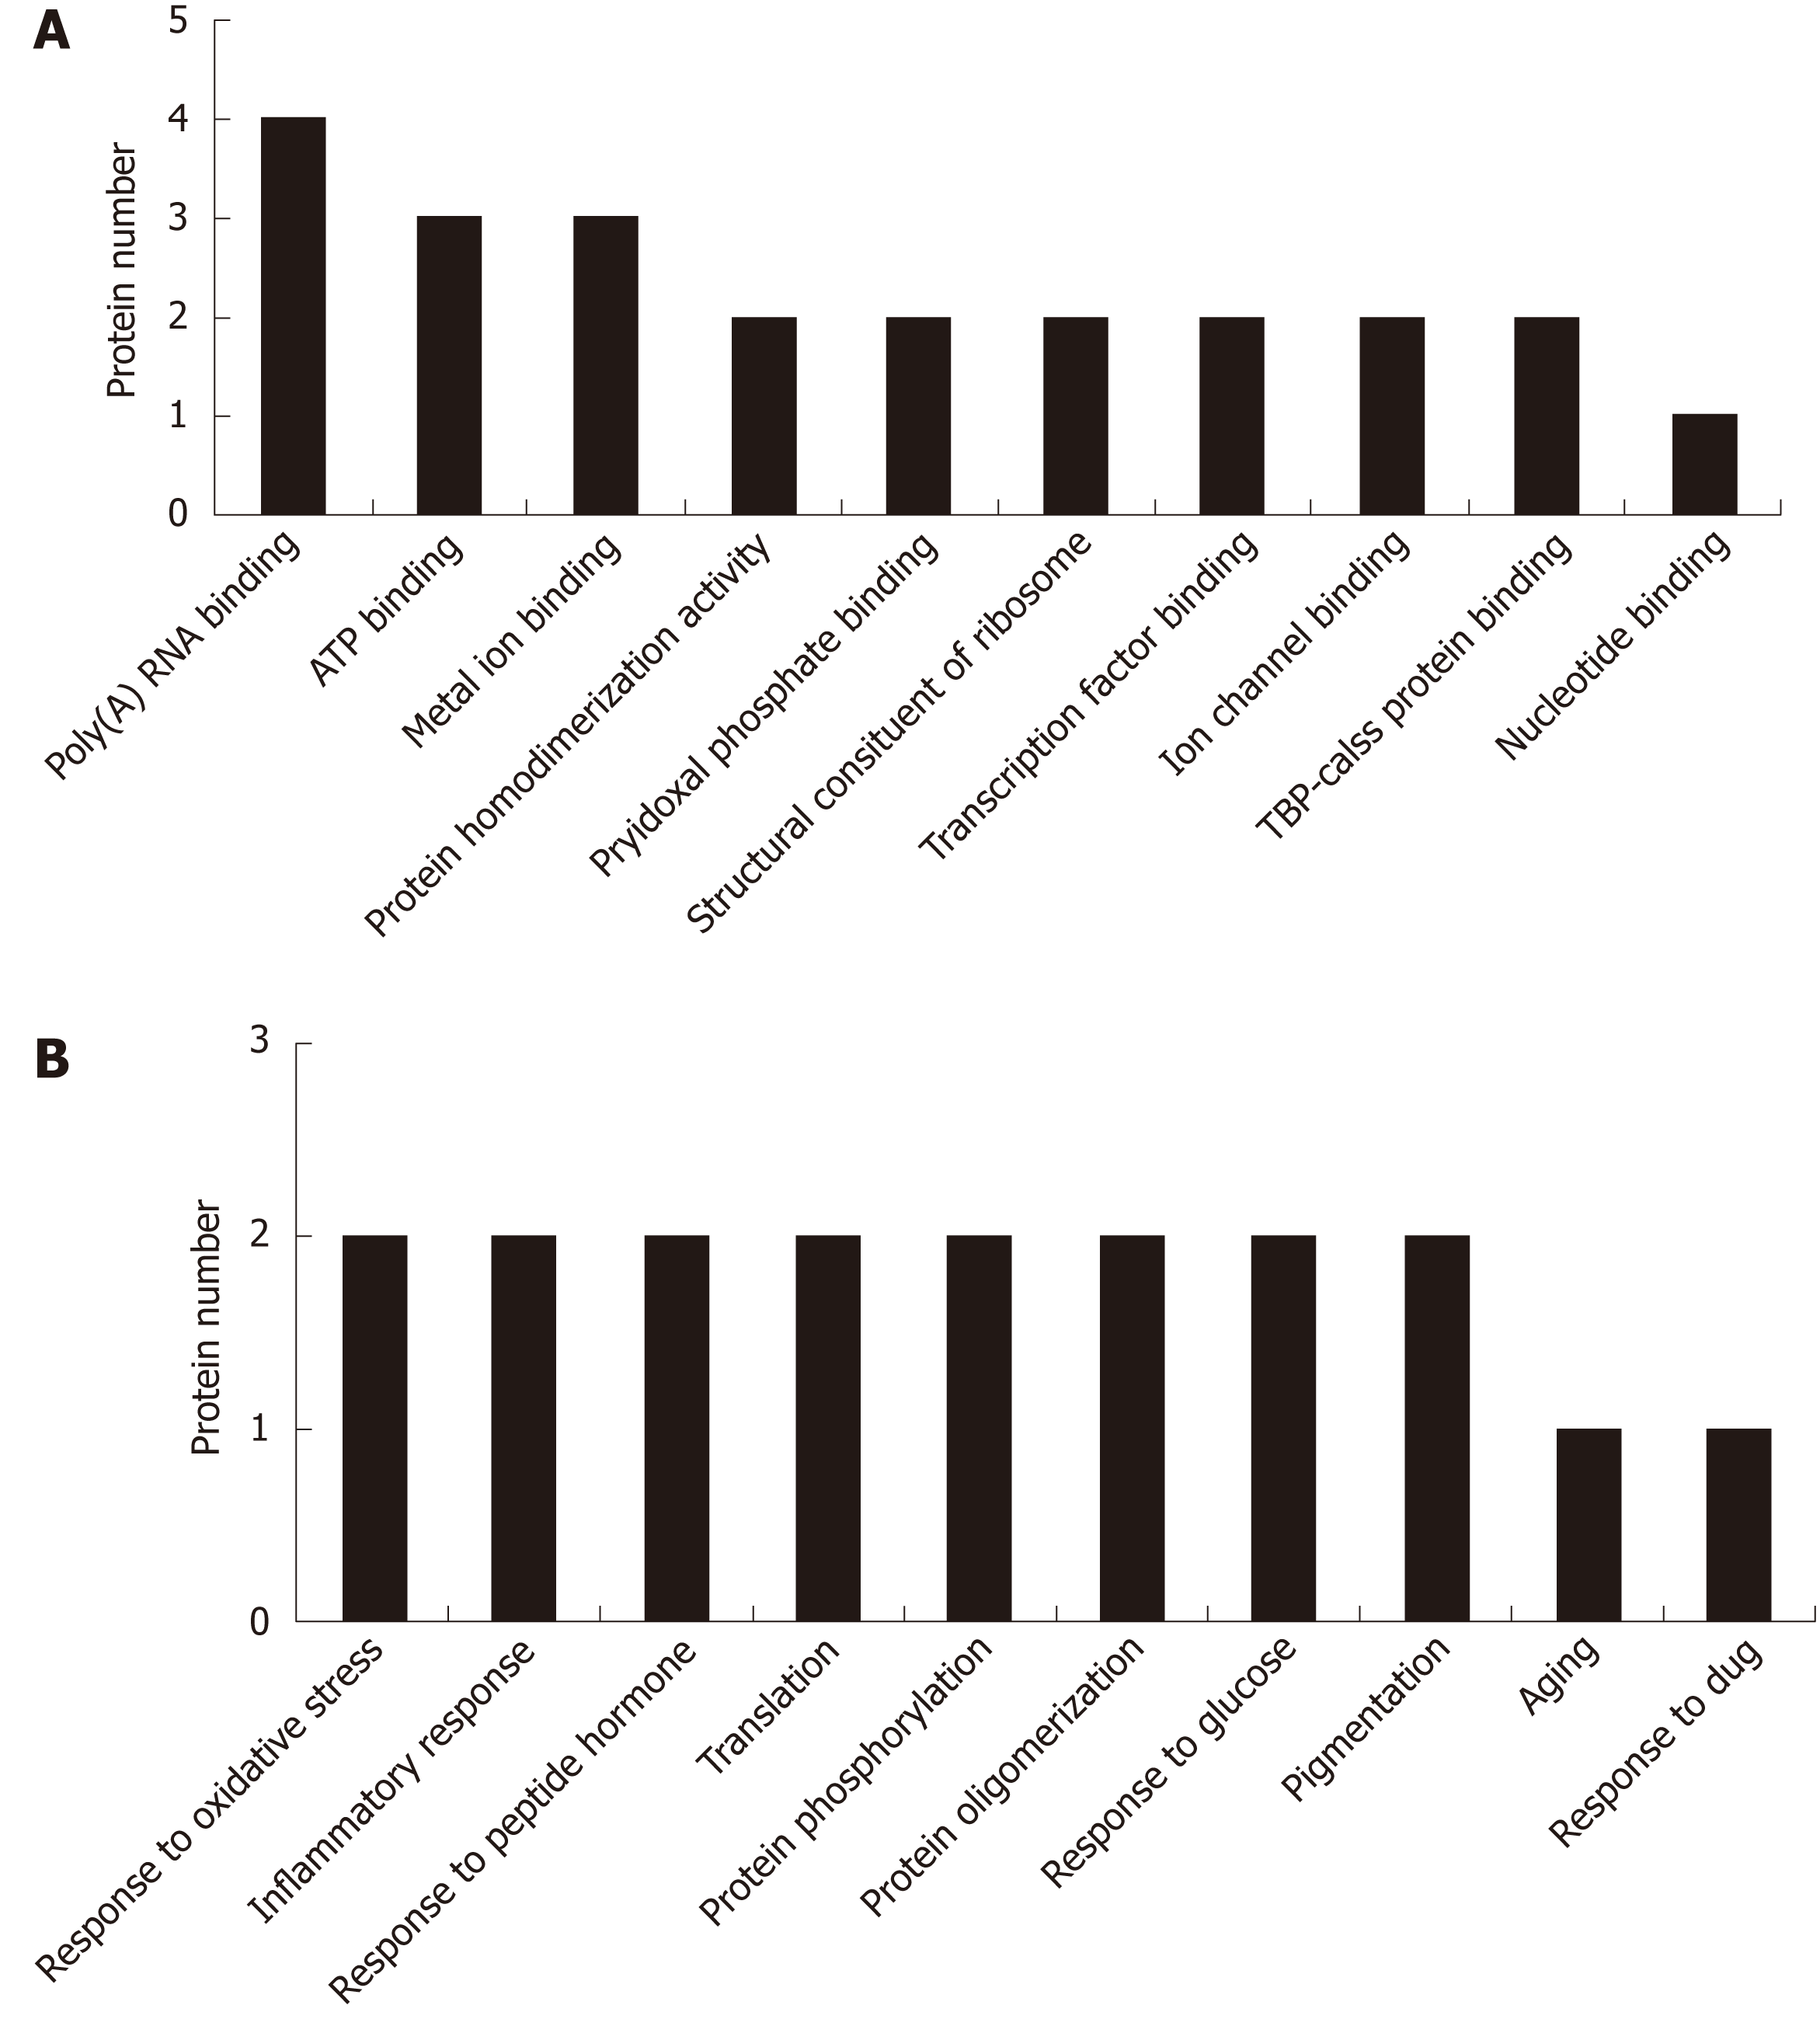
Figure 3 Features of the proteomic data from the mediodorsal thalamic nucleus of rats exposed to restraint-water-immersion-stress.
The data were obtained by isobaric tags for relative and absolute quantitation shotgun analysis. A: Gene ontology (GO) analysis of the involved molecular functions; B: GO analysis of the involved biological processes. Only the top ten terms are shown.
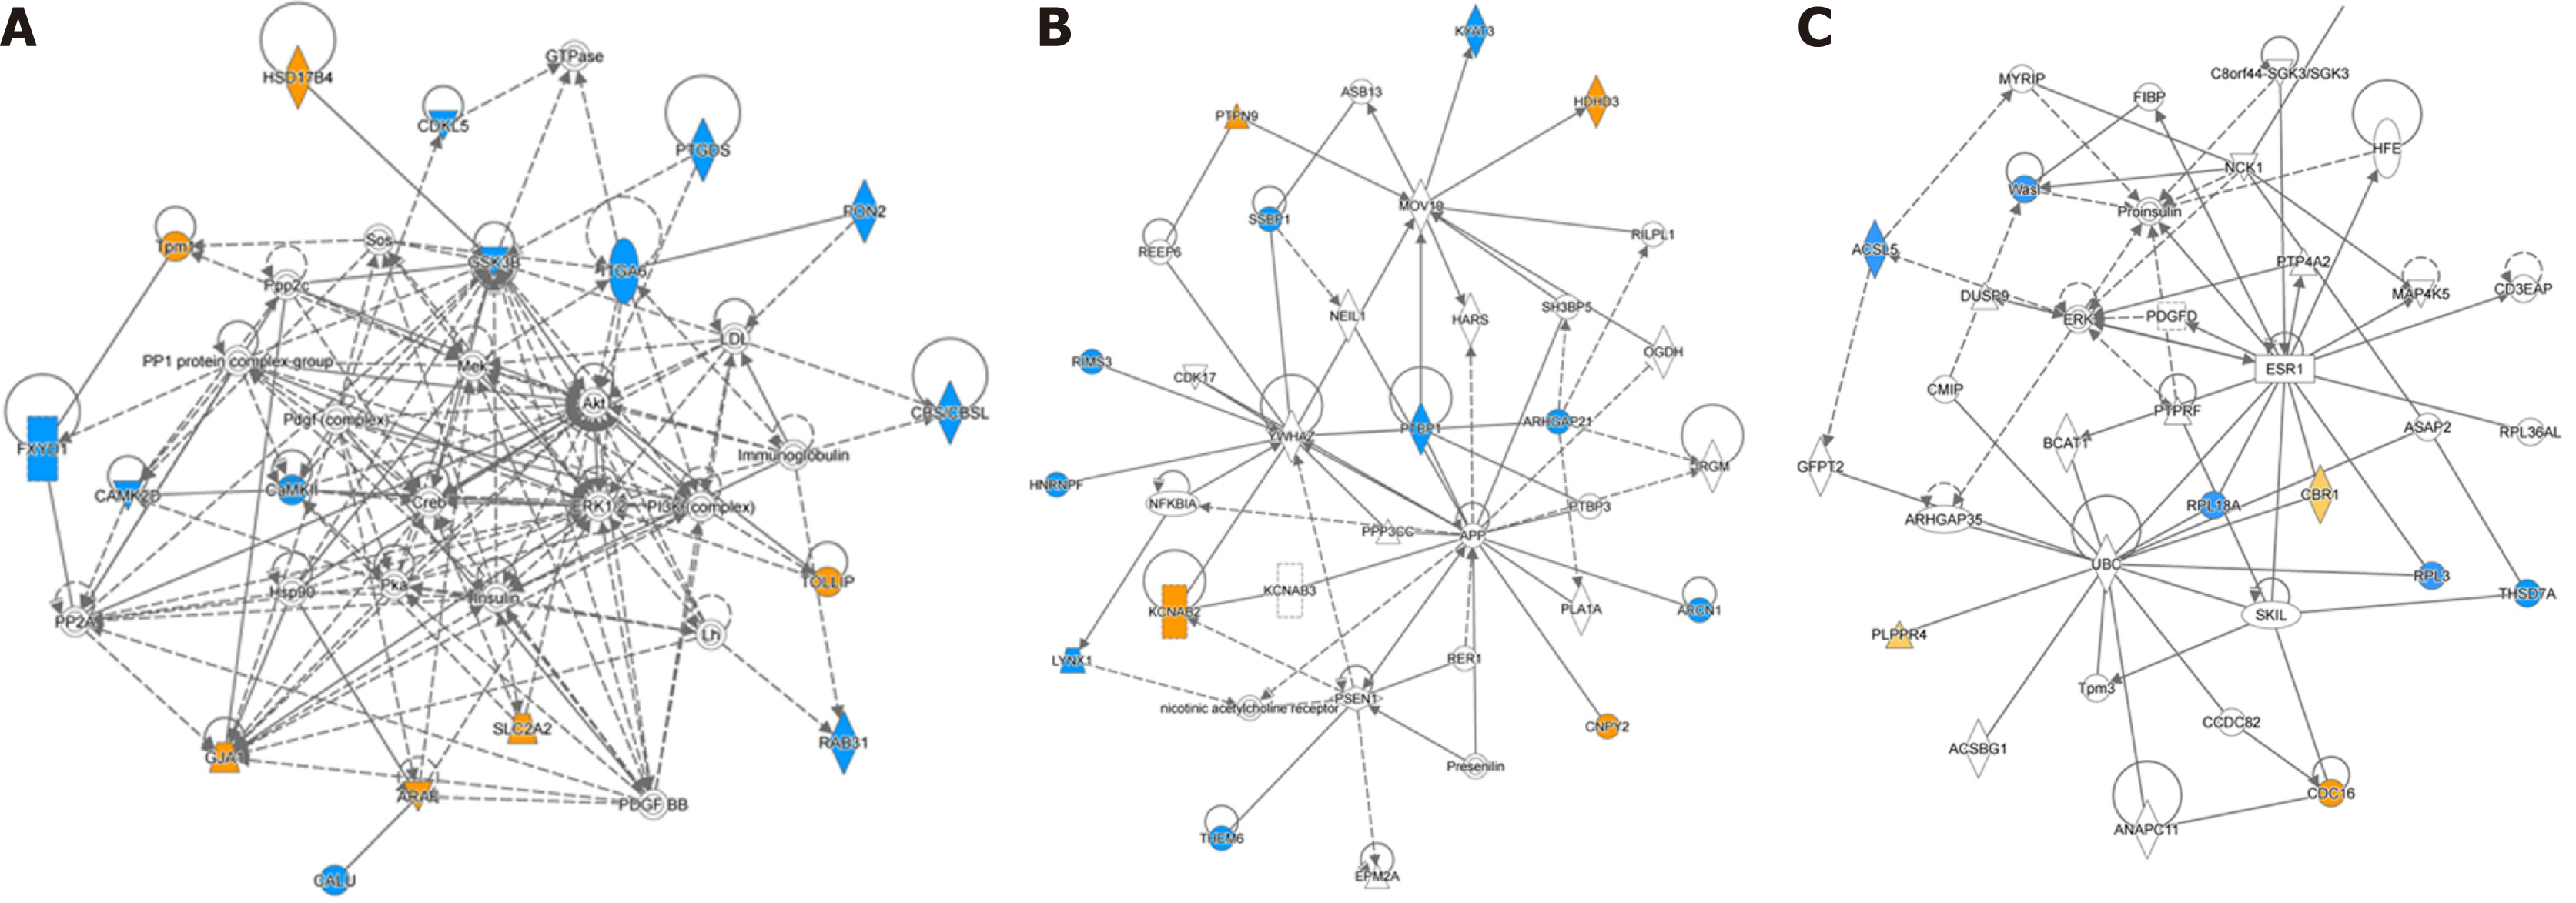
Figure 4 Key signalling pathways involving the proteins that were differentially expressed in the mediodorsal thalamic nucleu of rats exposed to restraint water-immersion stress.
A: Cardiovascular system development and function, organ morphology, and neurological disease; B: Cellular assembly and organization, nervous system development and function, and tissue morphology; C: Cellular development, cellular growth and proliferation, and nervous system development and function. Orange labels indicate the upregulated proteins, and blue labels indicate the downregulated proteins.
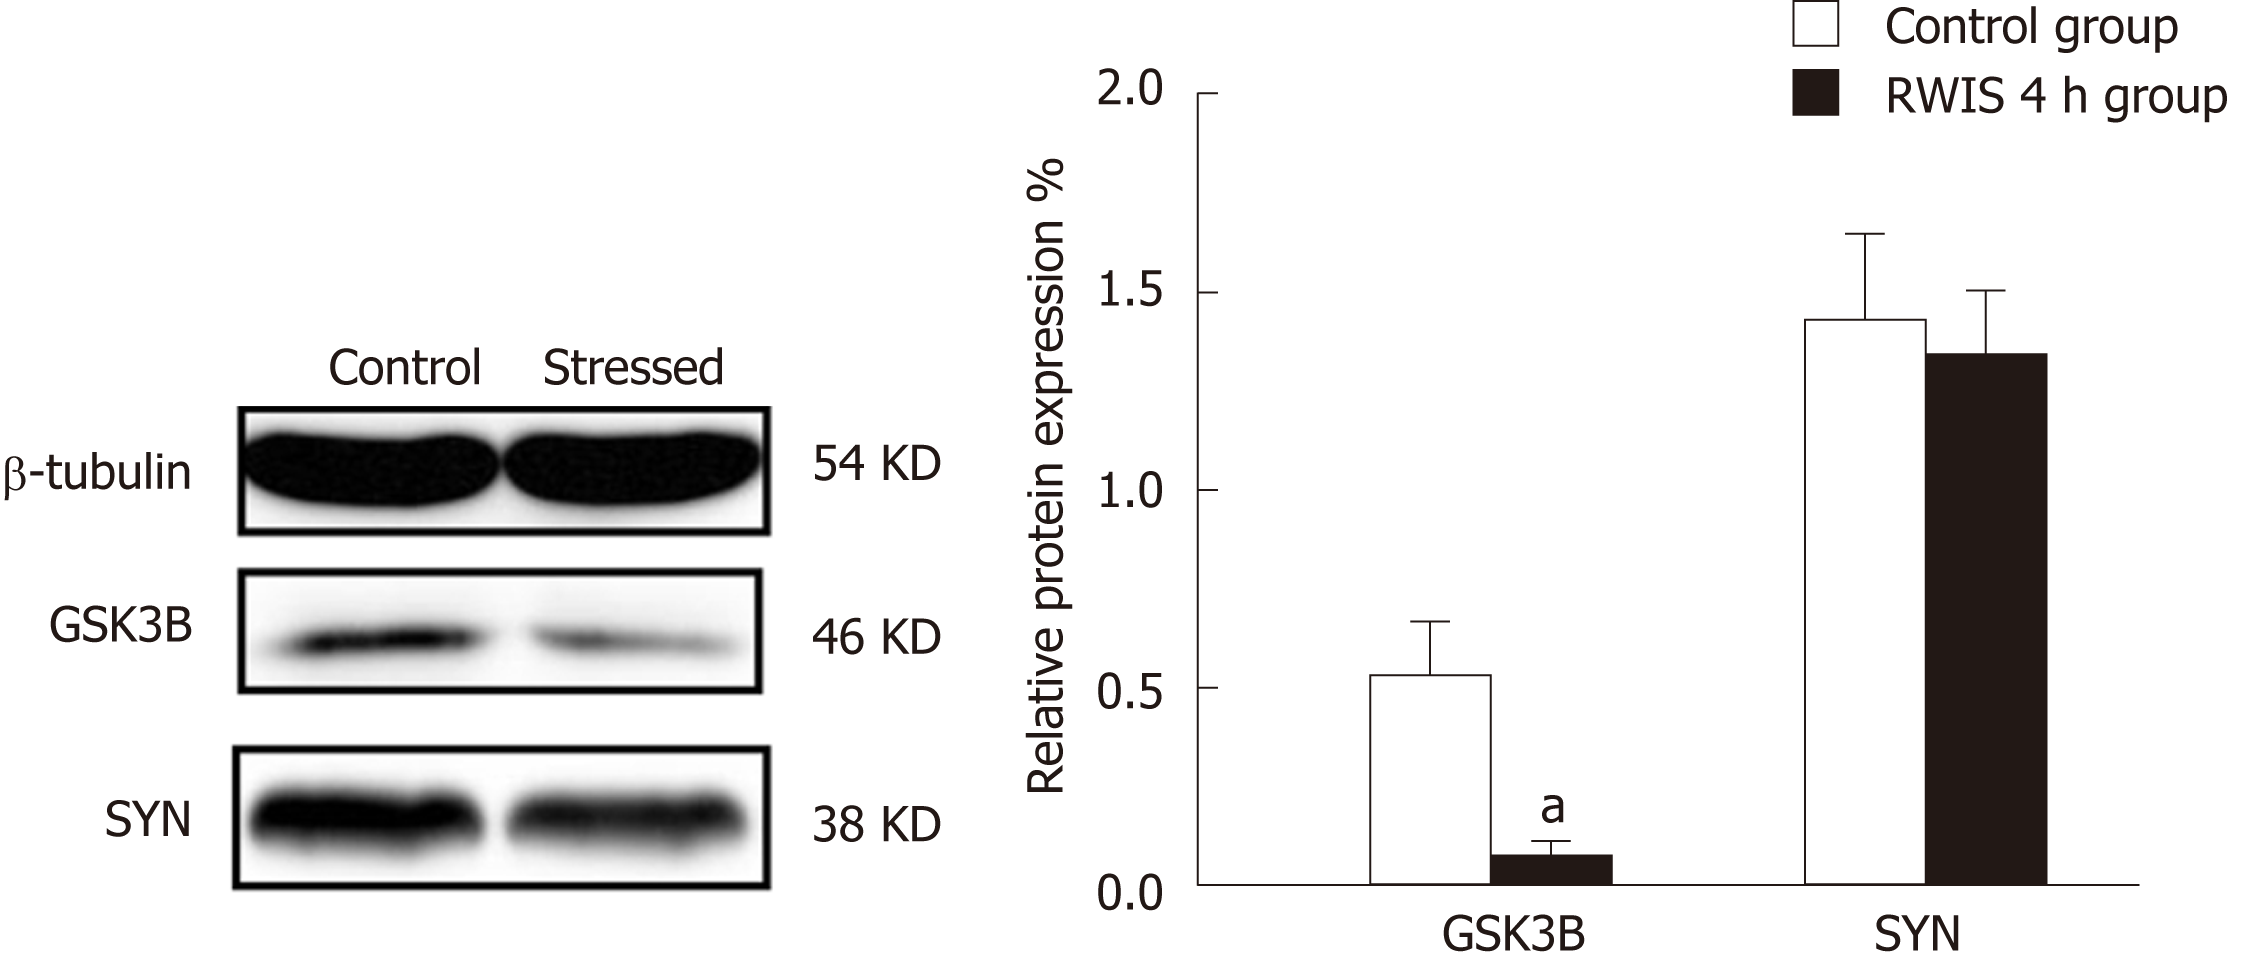
Figure 5 Verification of glycogen synthase kinase-3 beta and synaptophysin expression by Western blot.
After brain dissection, the proteins in the mediodorsal thalamic nucleu were separated by SDS-PAGE, and the expression levels of glycogen synthase kinase-3 beta (GSK3B) and synaptophysin (SYN) were detected by Western blot using antibodies against GSK3B and SYN. The bars represent the changes in the total GSK3B and SYN levels. Each value is the mean ± SD from at least three independent experiments; aP < 0.05. The expression of GSK3B was increased in the stressed group, whereas SYN showed no significant difference, which is in agreement with the isobaric tags for relative and absolute quantitation results.
- Citation: Gong SN, Zhu JP, Ma YJ, Zhao DQ. Proteomics of the mediodorsal thalamic nucleus of rats with stress-induced gastric ulcer. World J Gastroenterol 2019; 25(23): 2911-2923
- URL: https://www.wjgnet.com/1007-9327/full/v25/i23/2911.htm
- DOI: https://dx.doi.org/10.3748/wjg.v25.i23.2911


