Copyright
©The Author(s) 2019.
World J Gastroenterol. May 7, 2019; 25(17): 2122-2132
Published online May 7, 2019. doi: 10.3748/wjg.v25.i17.2122
Published online May 7, 2019. doi: 10.3748/wjg.v25.i17.2122
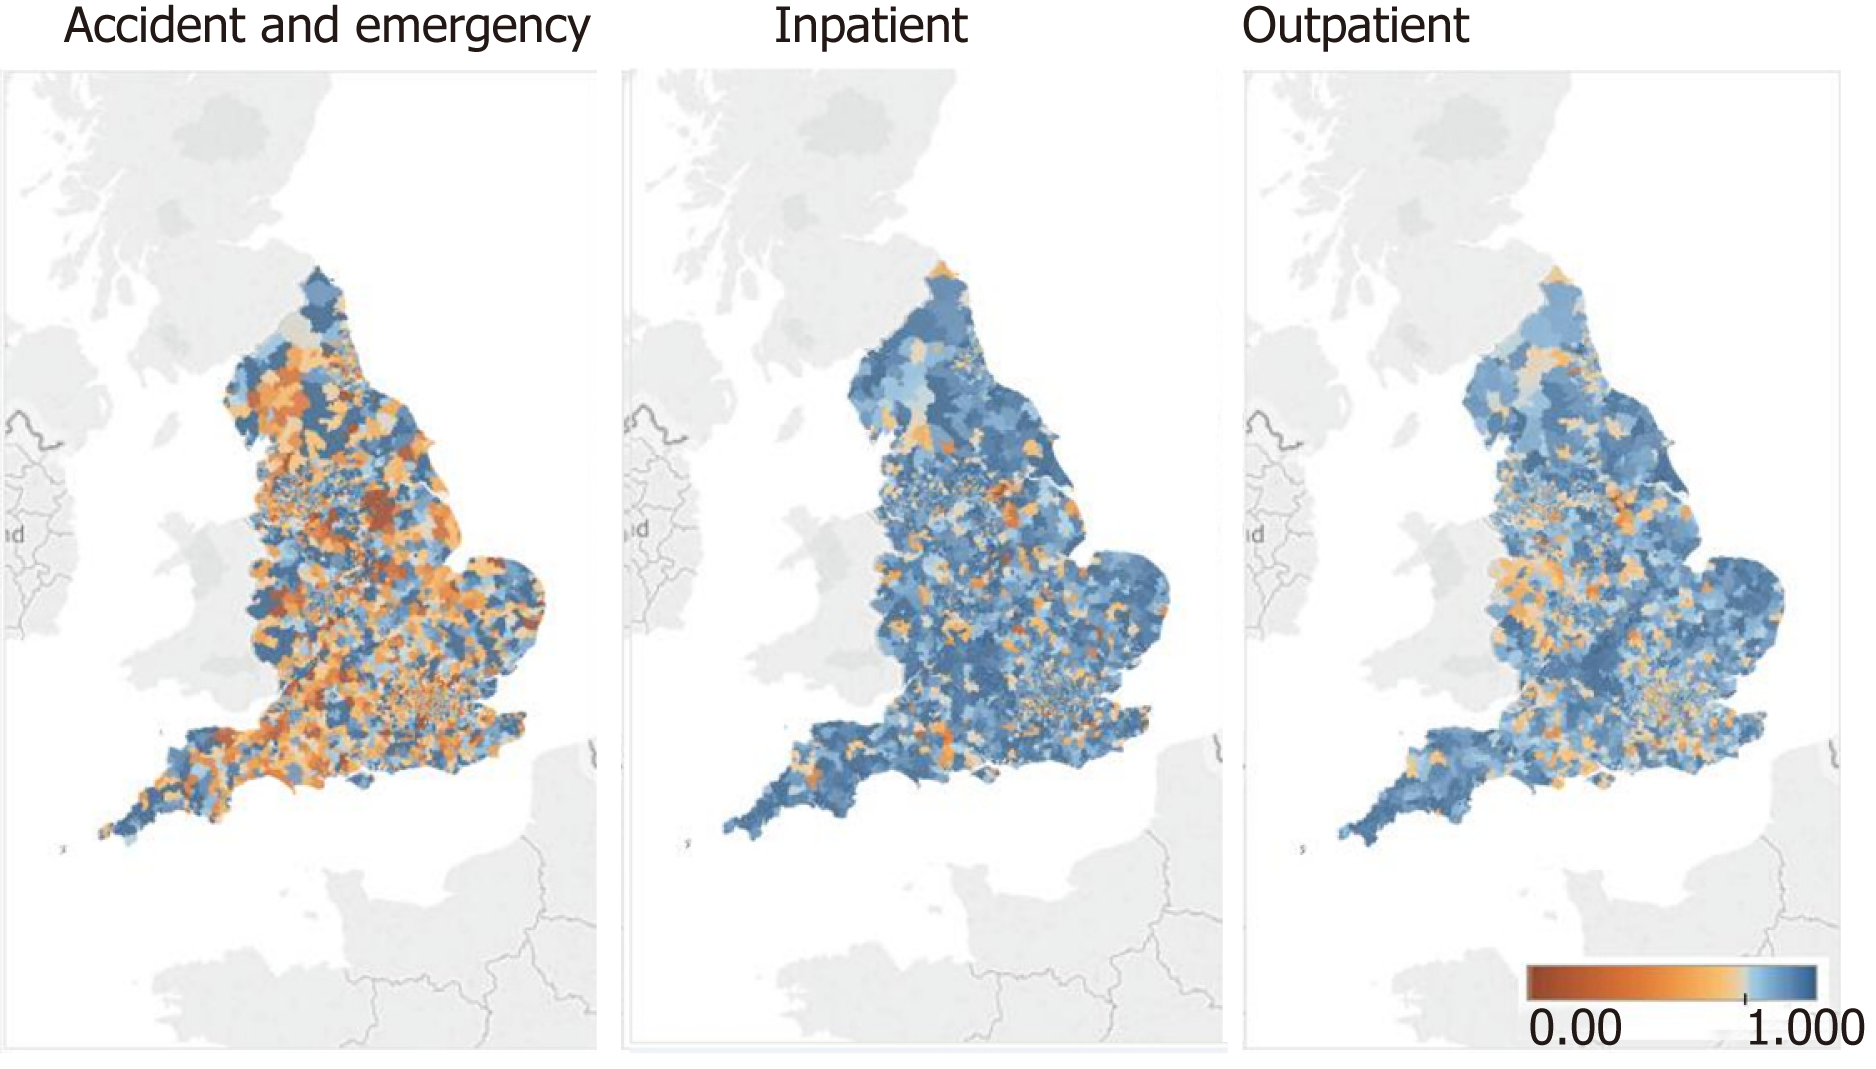
Figure 1 Proportion of accident and emergency, inpatient and outpatient presentations to inflammatory bowel disease care ‘home provider’ by Middle Layer Super Output Area of residence.
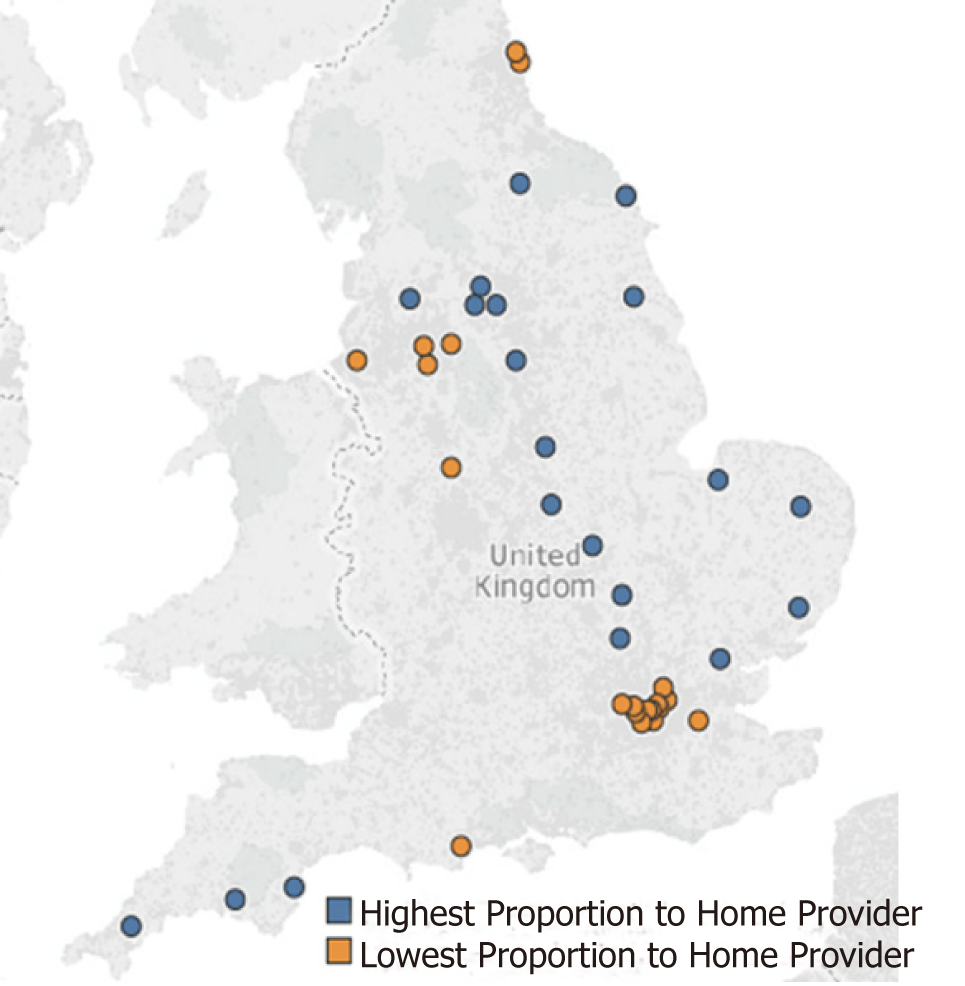
Figure 2 Distribution of 20 highest and 20 lowest providers per proportion of encounters with home provider (from 144 included providers).
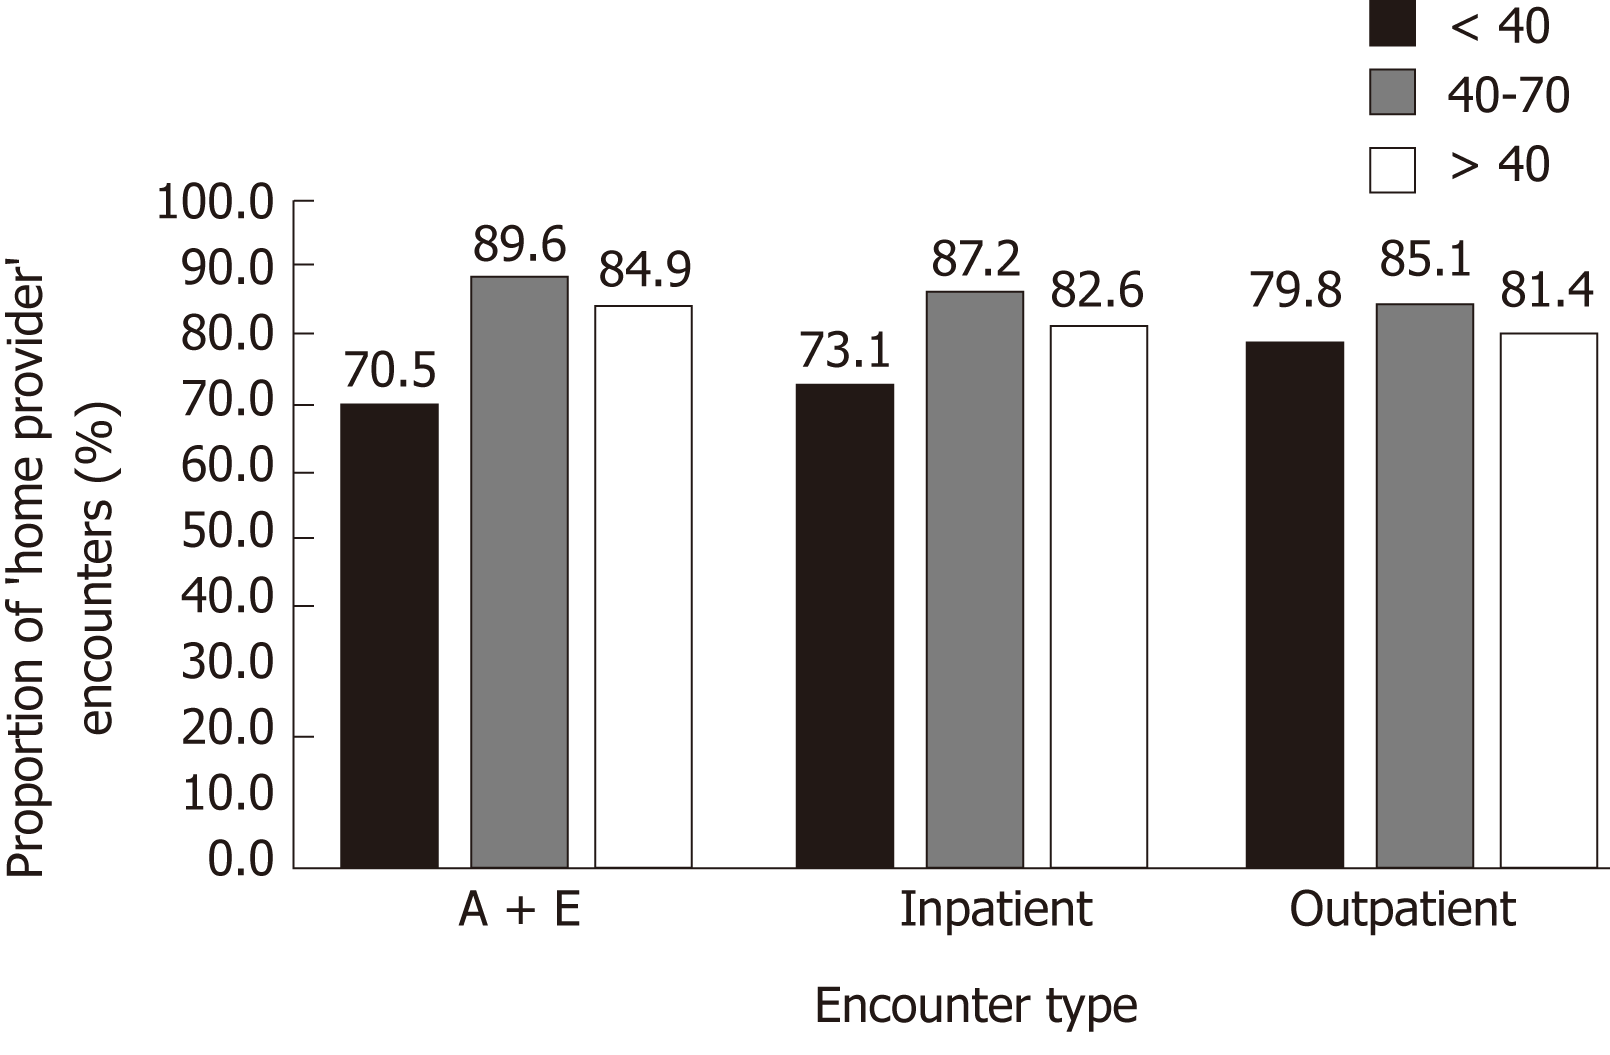
Figure 3 Proportion of ‘home provider’ encounters per age for three age bands, <40, 40-70 and > 70 years.
- Citation: Warren LR, Clarke JM, Arora S, Barahona M, Arebi N, Darzi A. Transitions of care across hospital settings in patients with inflammatory bowel disease. World J Gastroenterol 2019; 25(17): 2122-2132
- URL: https://www.wjgnet.com/1007-9327/full/v25/i17/2122.htm
- DOI: https://dx.doi.org/10.3748/wjg.v25.i17.2122


