Copyright
©The Author(s) 2019.
World J Gastroenterol. Mar 21, 2019; 25(11): 1366-1377
Published online Mar 21, 2019. doi: 10.3748/wjg.v25.i11.1366
Published online Mar 21, 2019. doi: 10.3748/wjg.v25.i11.1366
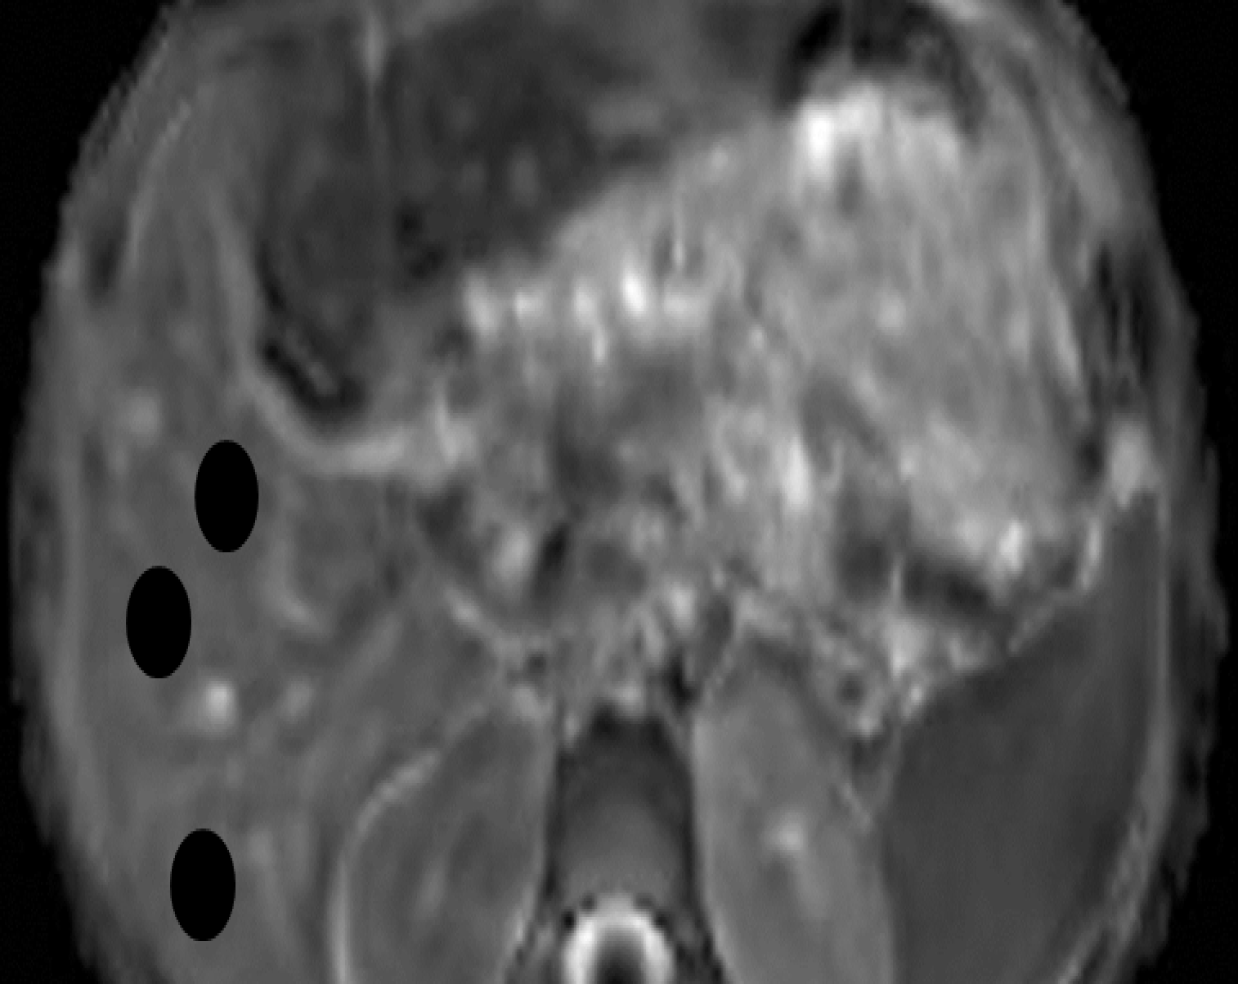
Figure 1 Regions of interest.
Apparent diffusion coefficient map of the liver with locations of the regions of interest within the liver parenchyma.
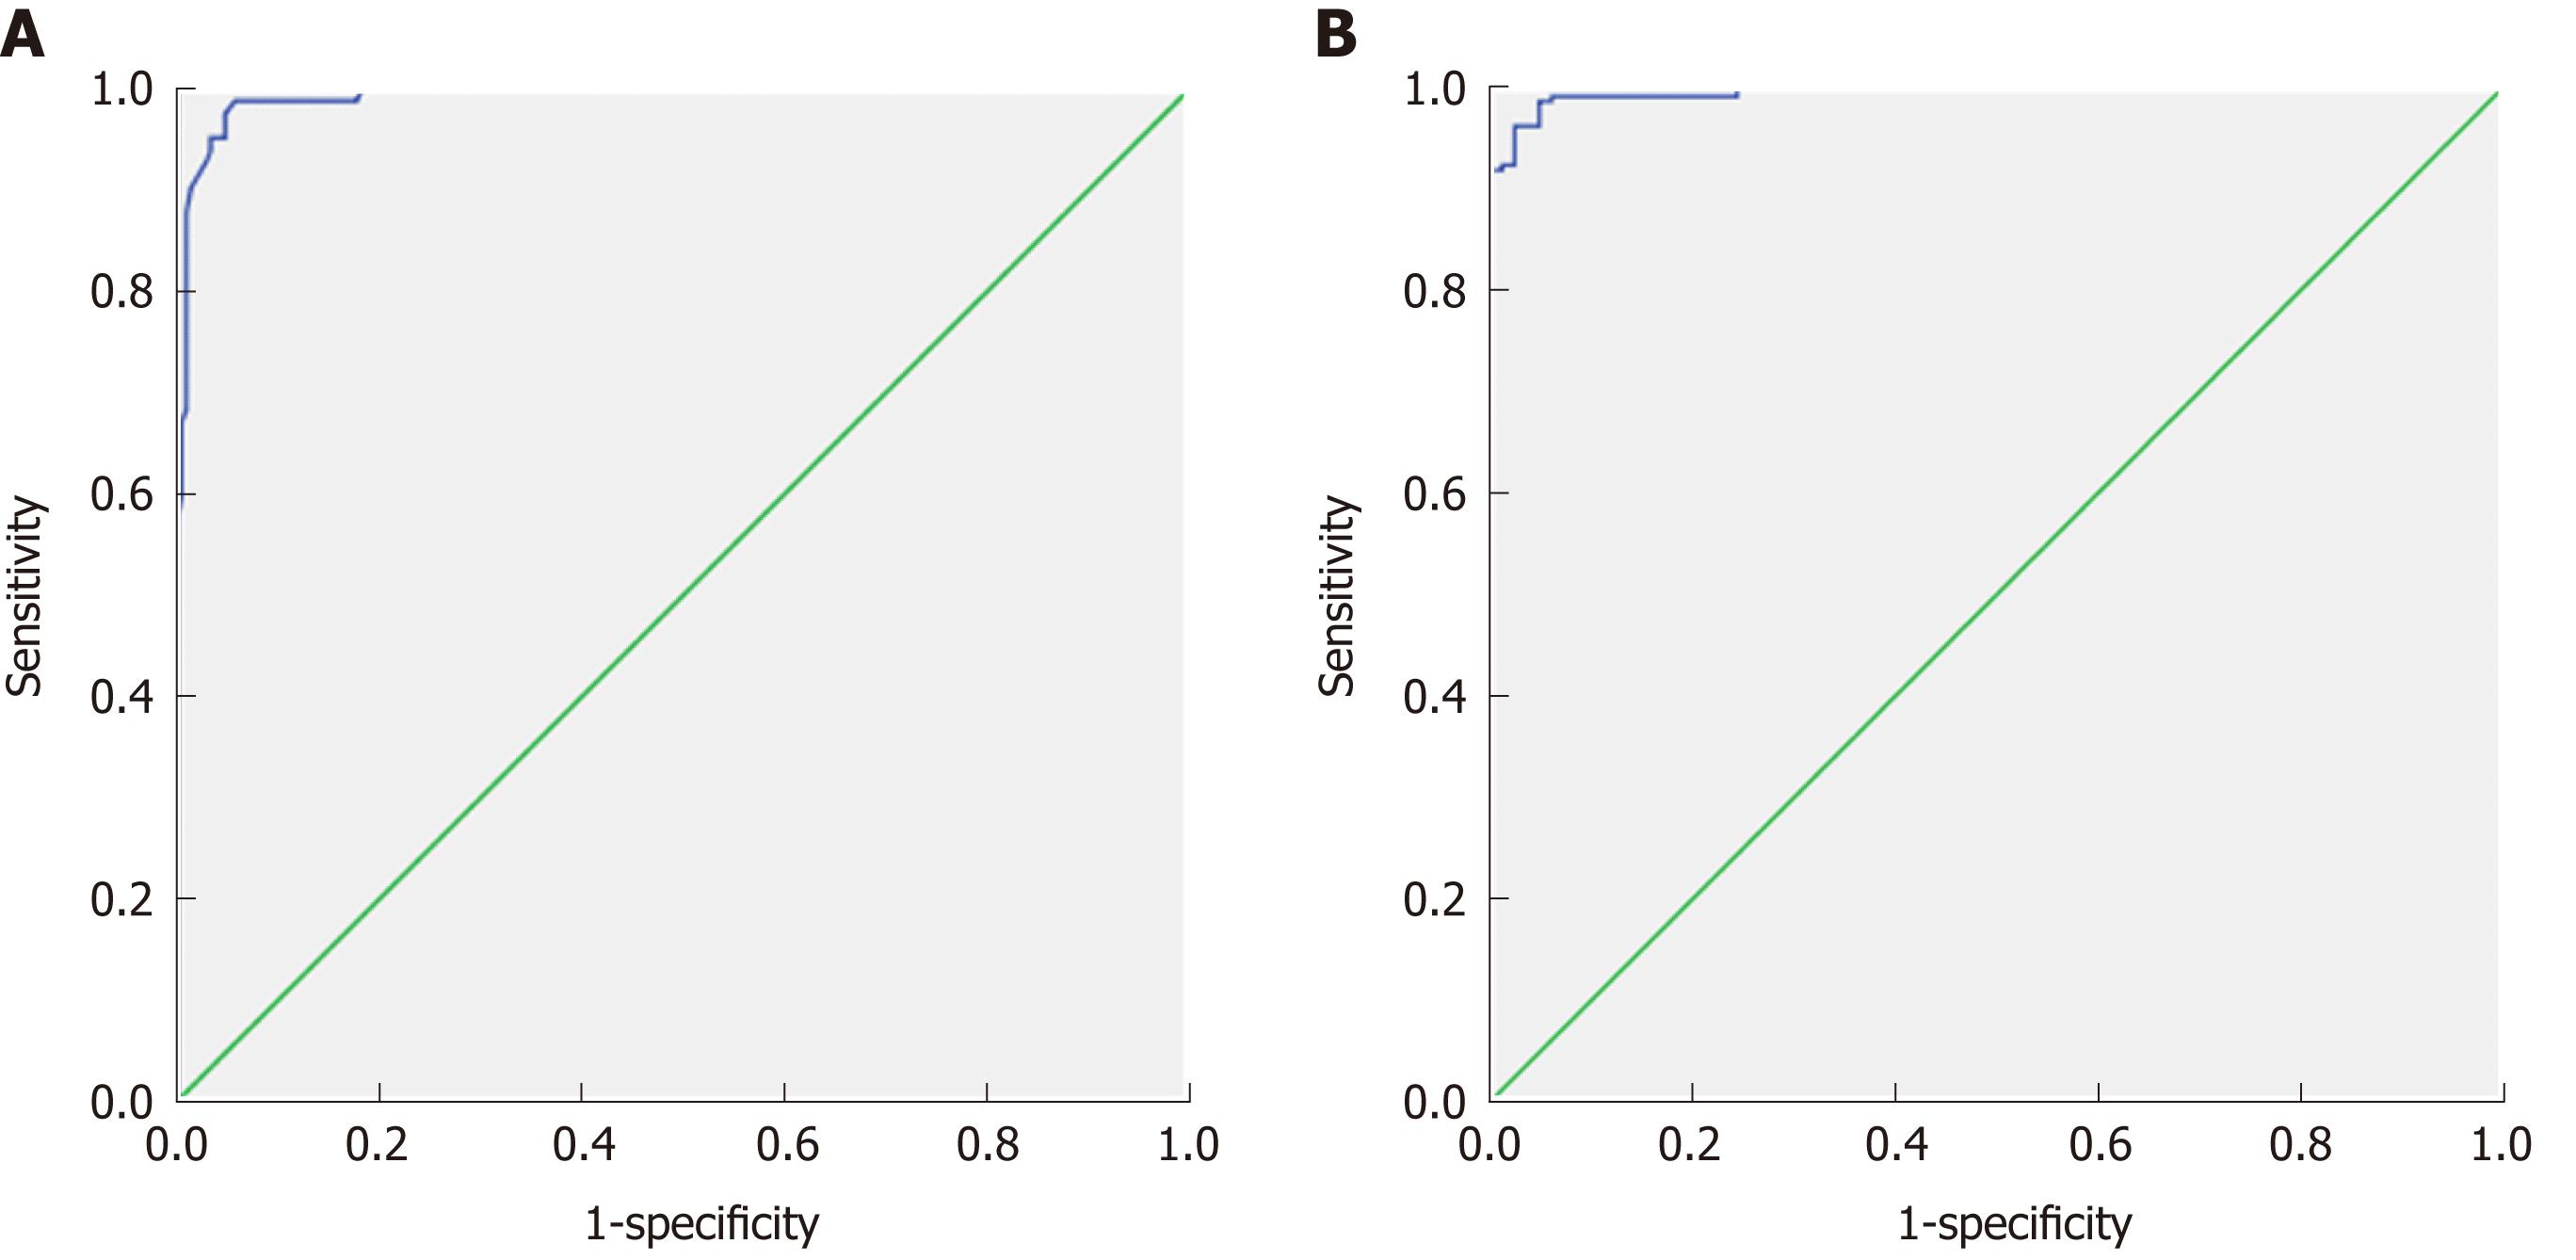
Figure 2 Receiver operating characteristic curve of patients vs controls.
A: The cut-off apparent diffusion coefficient value used for differentiating patients from controls is 1.83 × 10⁻³ mm2/s with an area under the curve of 0.992, sensitivity of 98.6%, and accuracy of 97.1%; B: The combination of apparent diffusion coefficient and miR-200b used for differentiating patients from controls shows an area under the curve of 0.995, sensitivity of 100%, and specificity of 96.9%.
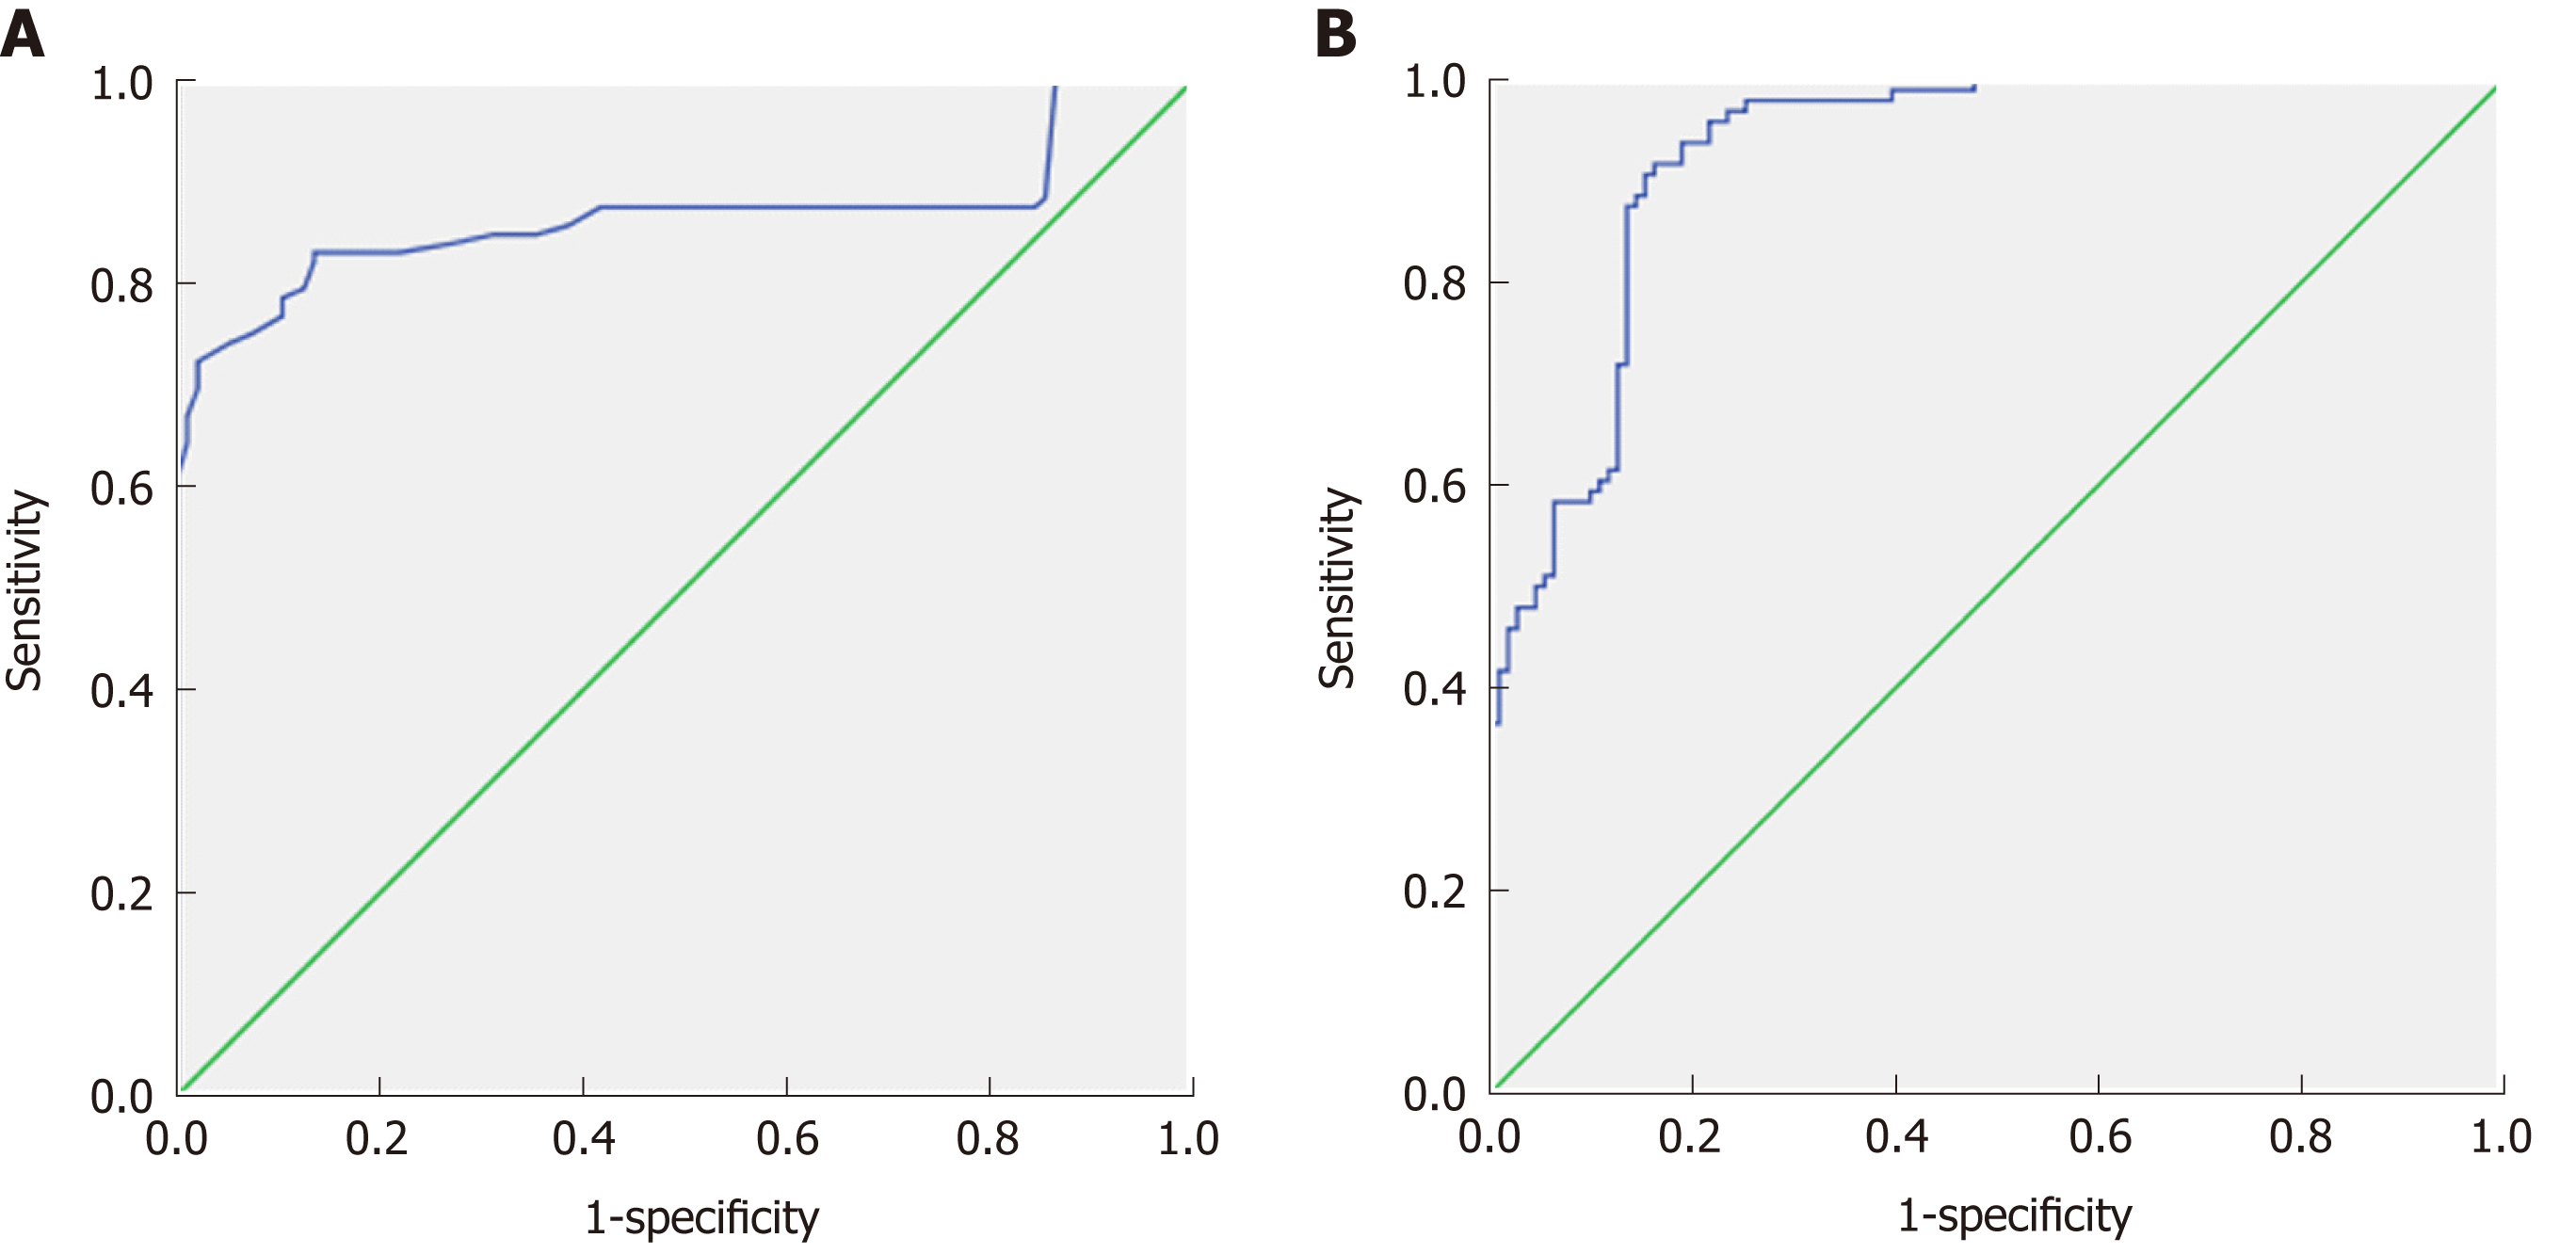
Figure 3 Receiver operating characteristic curve of early and late fibrosis.
A: The cut-off apparent diffusion coefficient value for differentiating early from late fibrosis is 1.54 × 10⁻³ mm2/s with an area under the curve of 0.866, sensitivity of 99.0% and accuracy of 81.7%; B: Combining apparent diffusion coefficient and miR-200b to differentiate early and late fibrosis patients shows an area under the curve of 0.925, sensitivity of 71.7% and accuracy of 80.2%.
- Citation: Besheer T, Elalfy H, Abd El-Maksoud M, Abd El-Razek A, Taman S, Zalata K, Elkashef W, Zaghloul H, Elshahawy H, Raafat D, Elemshaty W, Elsayed E, El-Gilany AH, El-Bendary M. Diffusion-weighted magnetic resonance imaging and micro-RNA in the diagnosis of hepatic fibrosis in chronic hepatitis C virus. World J Gastroenterol 2019; 25(11): 1366-1377
- URL: https://www.wjgnet.com/1007-9327/full/v25/i11/1366.htm
- DOI: https://dx.doi.org/10.3748/wjg.v25.i11.1366


