Copyright
©The Author(s) 2019.
World J Gastroenterol. Jan 7, 2019; 25(1): 118-137
Published online Jan 7, 2019. doi: 10.3748/wjg.v25.i1.118
Published online Jan 7, 2019. doi: 10.3748/wjg.v25.i1.118
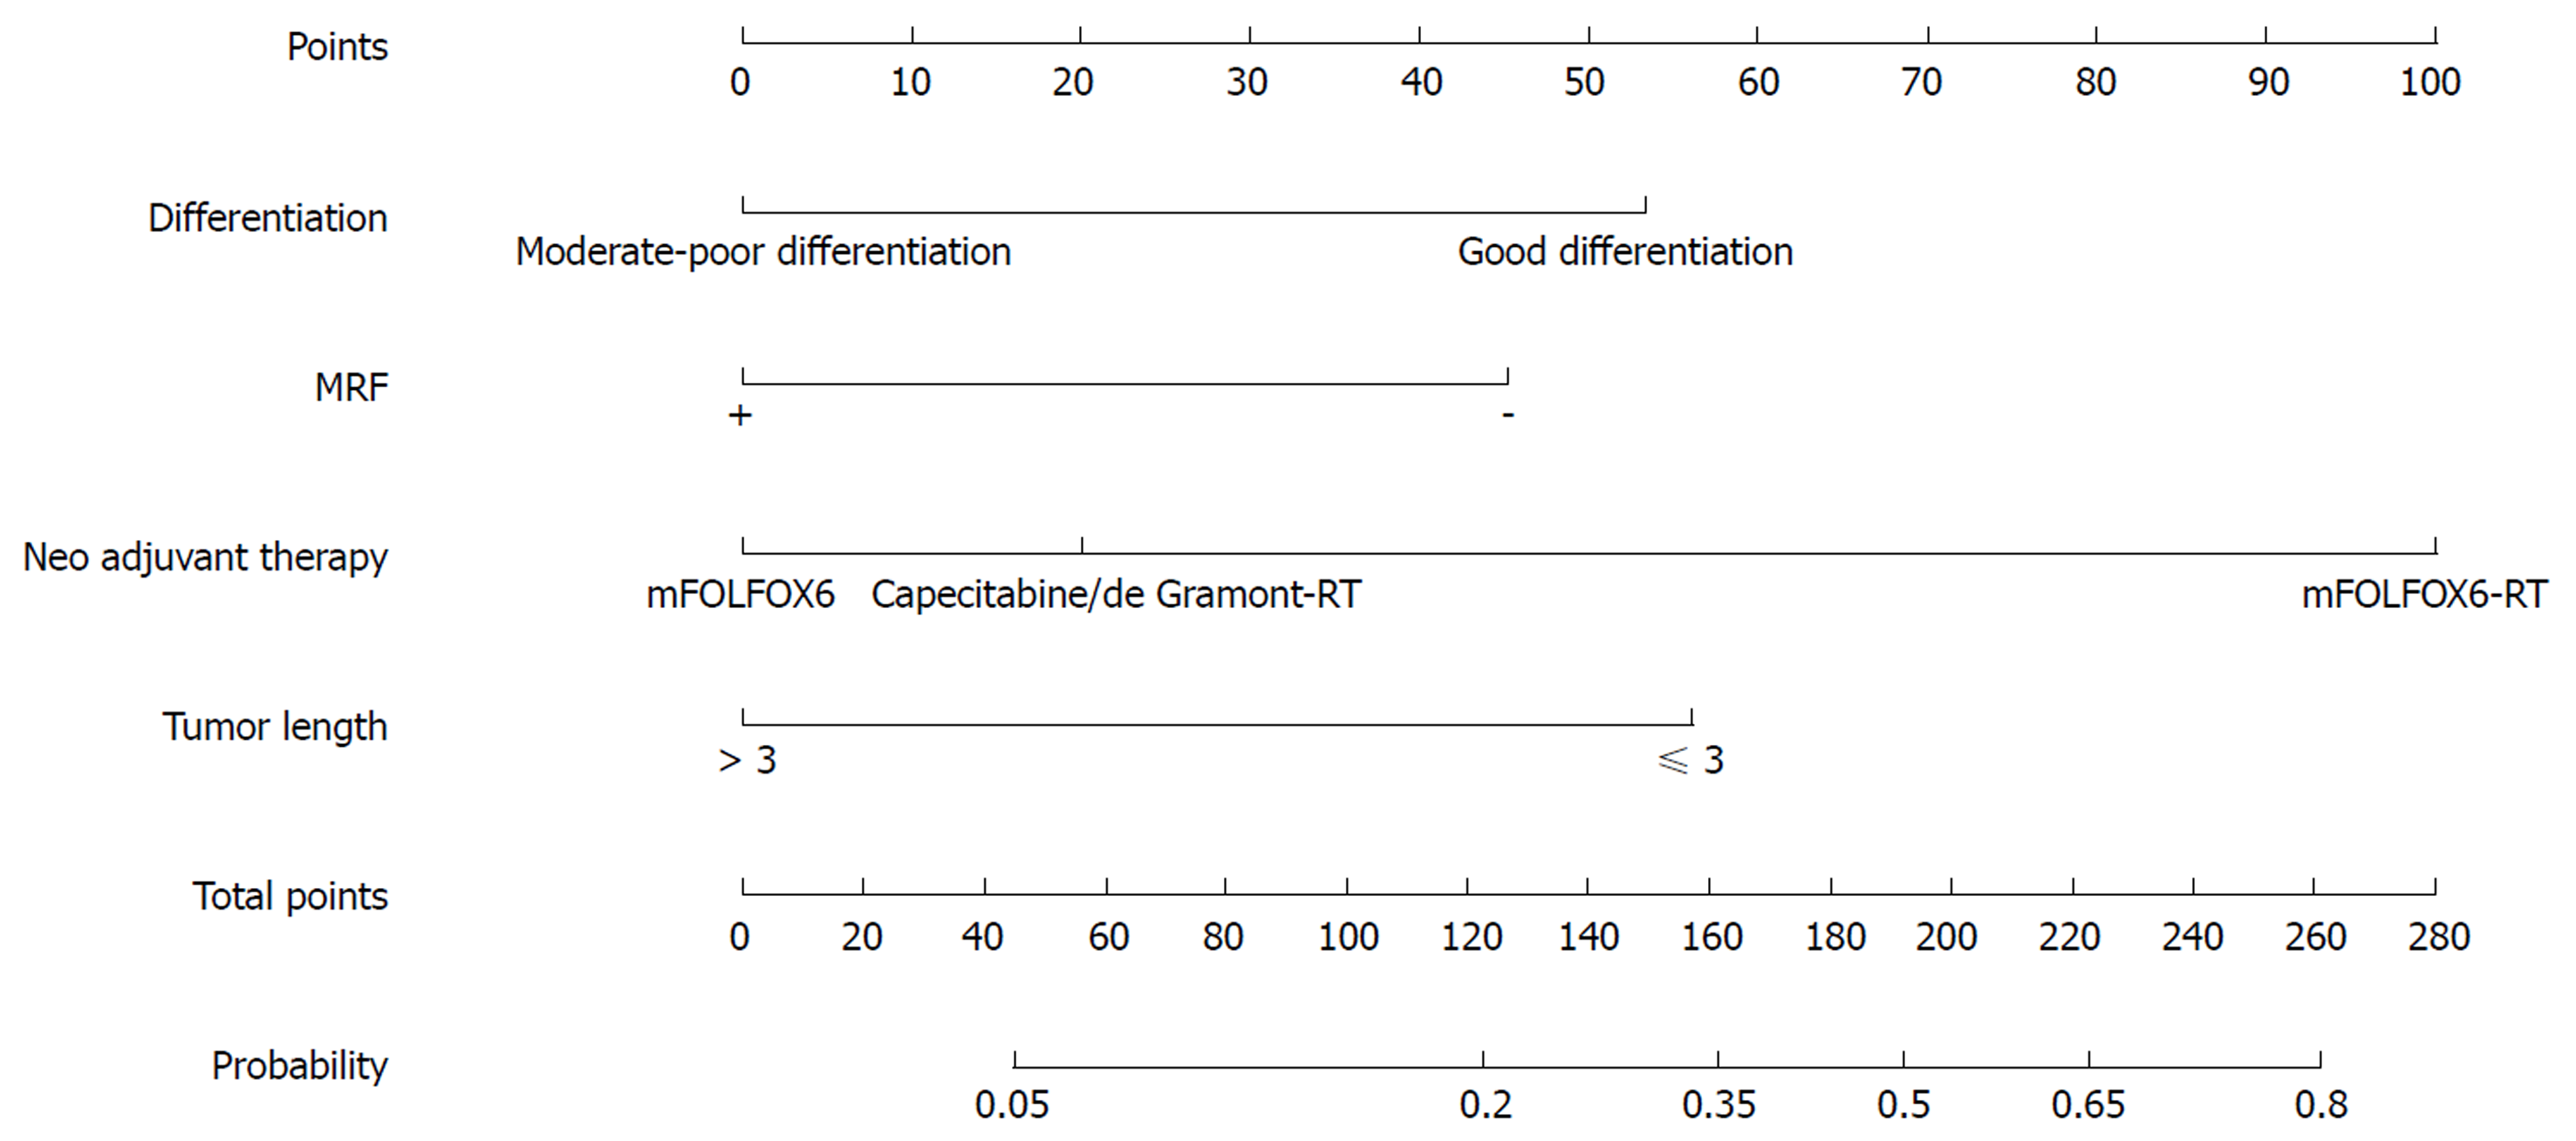
Figure 1 Nomogram for predicting the probability of pathological complete response for all patients.
MRF: Mesorectal fascia.
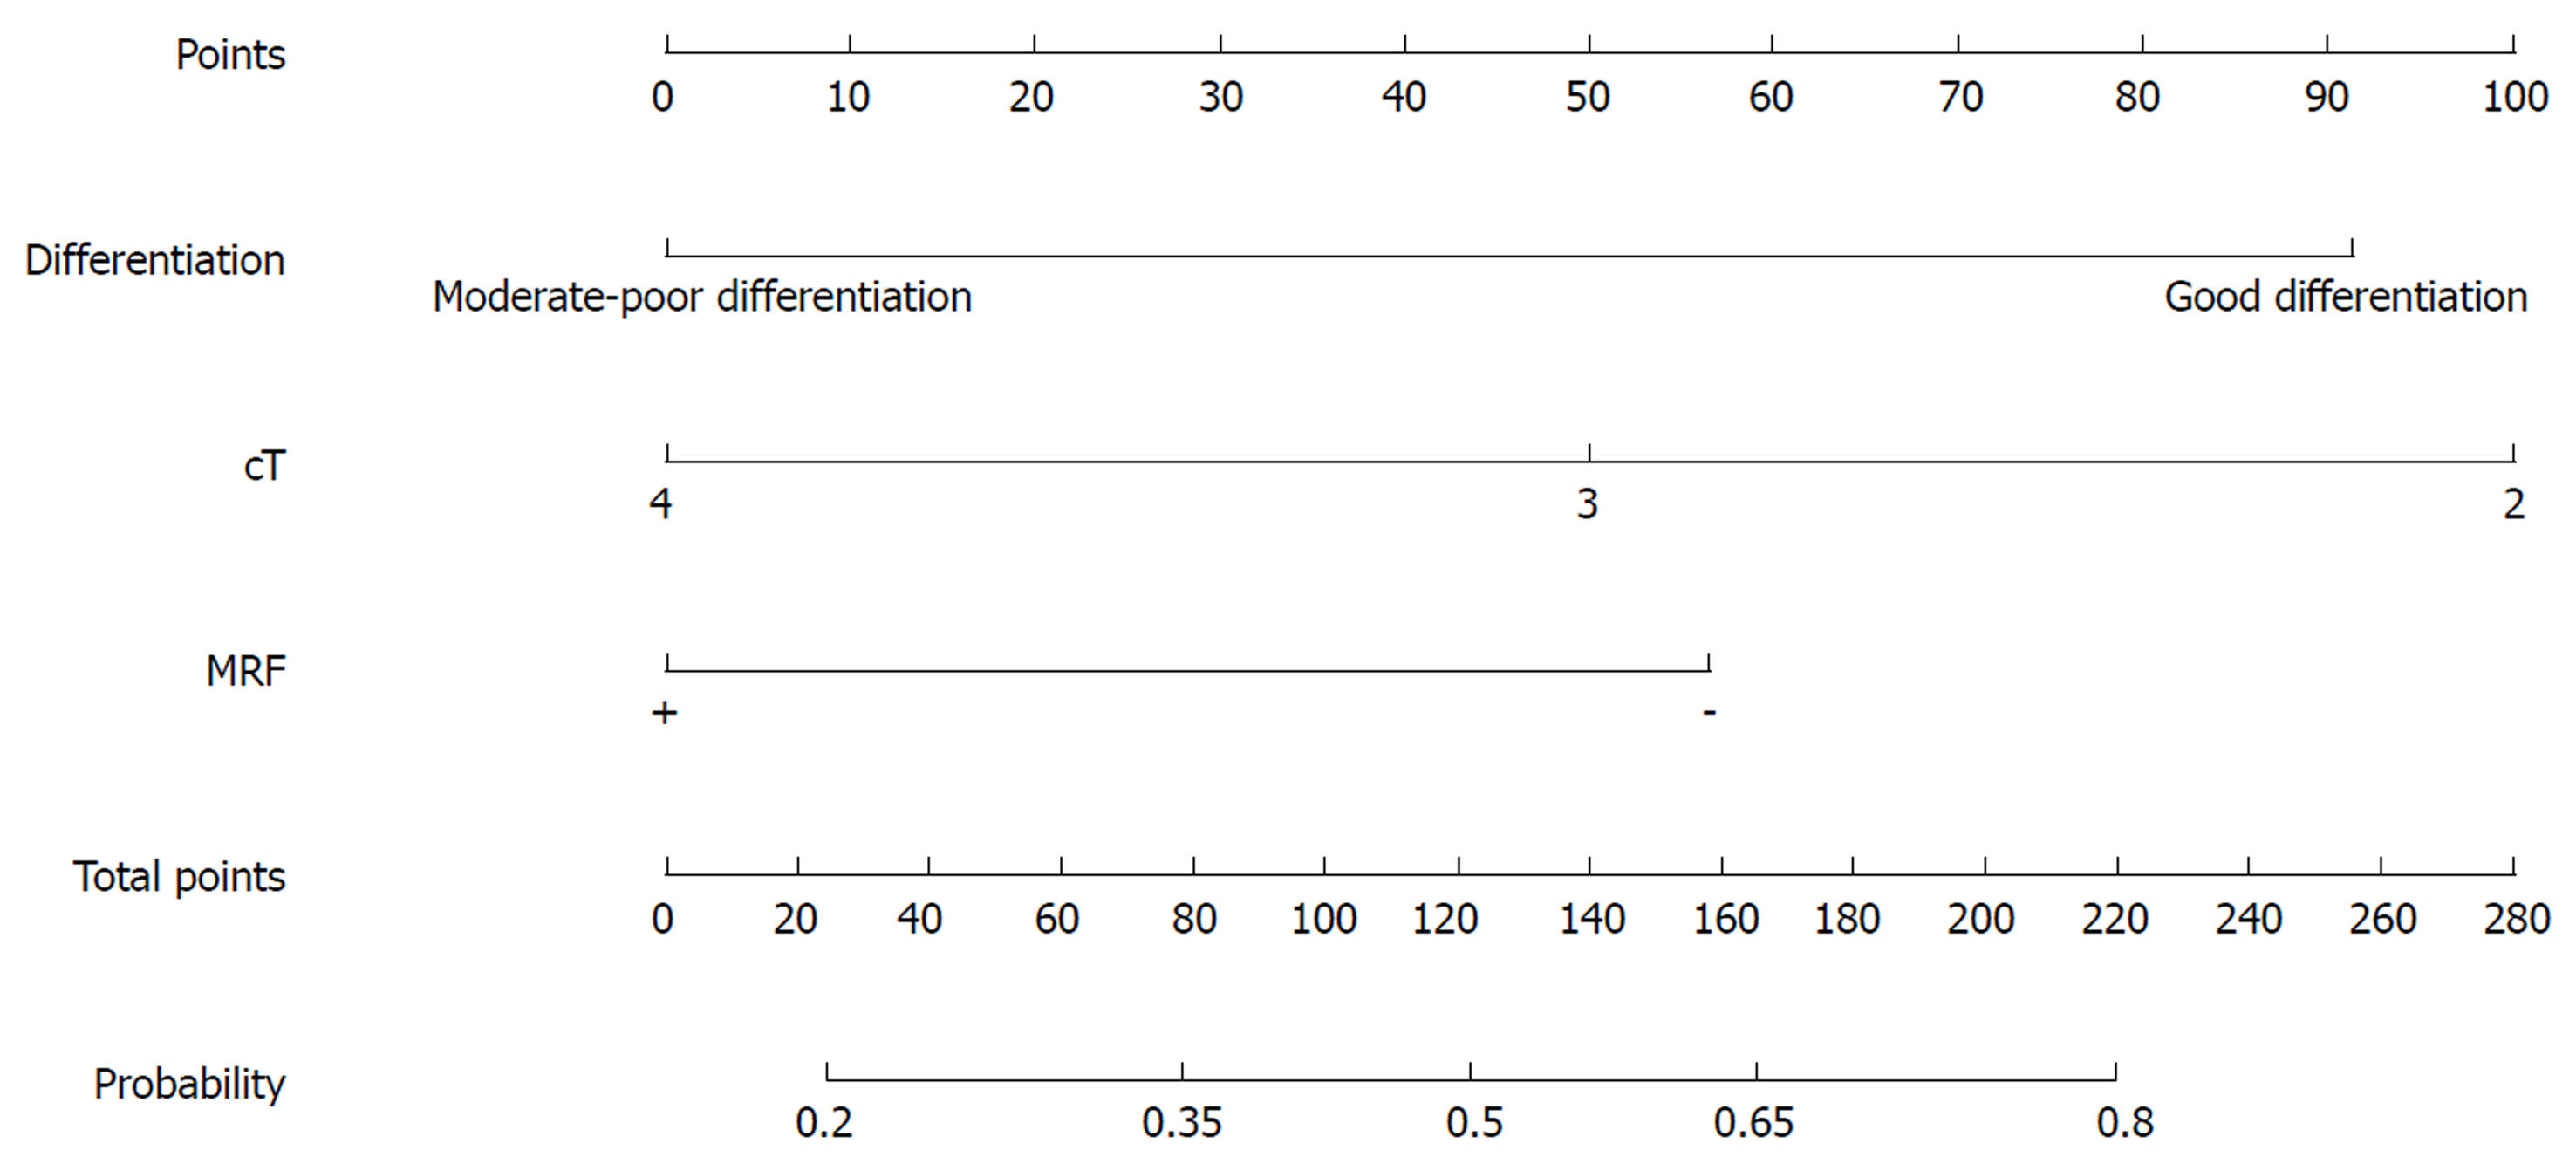
Figure 2 Nomogram for predicting the probability of good downstaging (ypTNM stage 0-I) for all patients.
MRF: Mesorectal fascia.
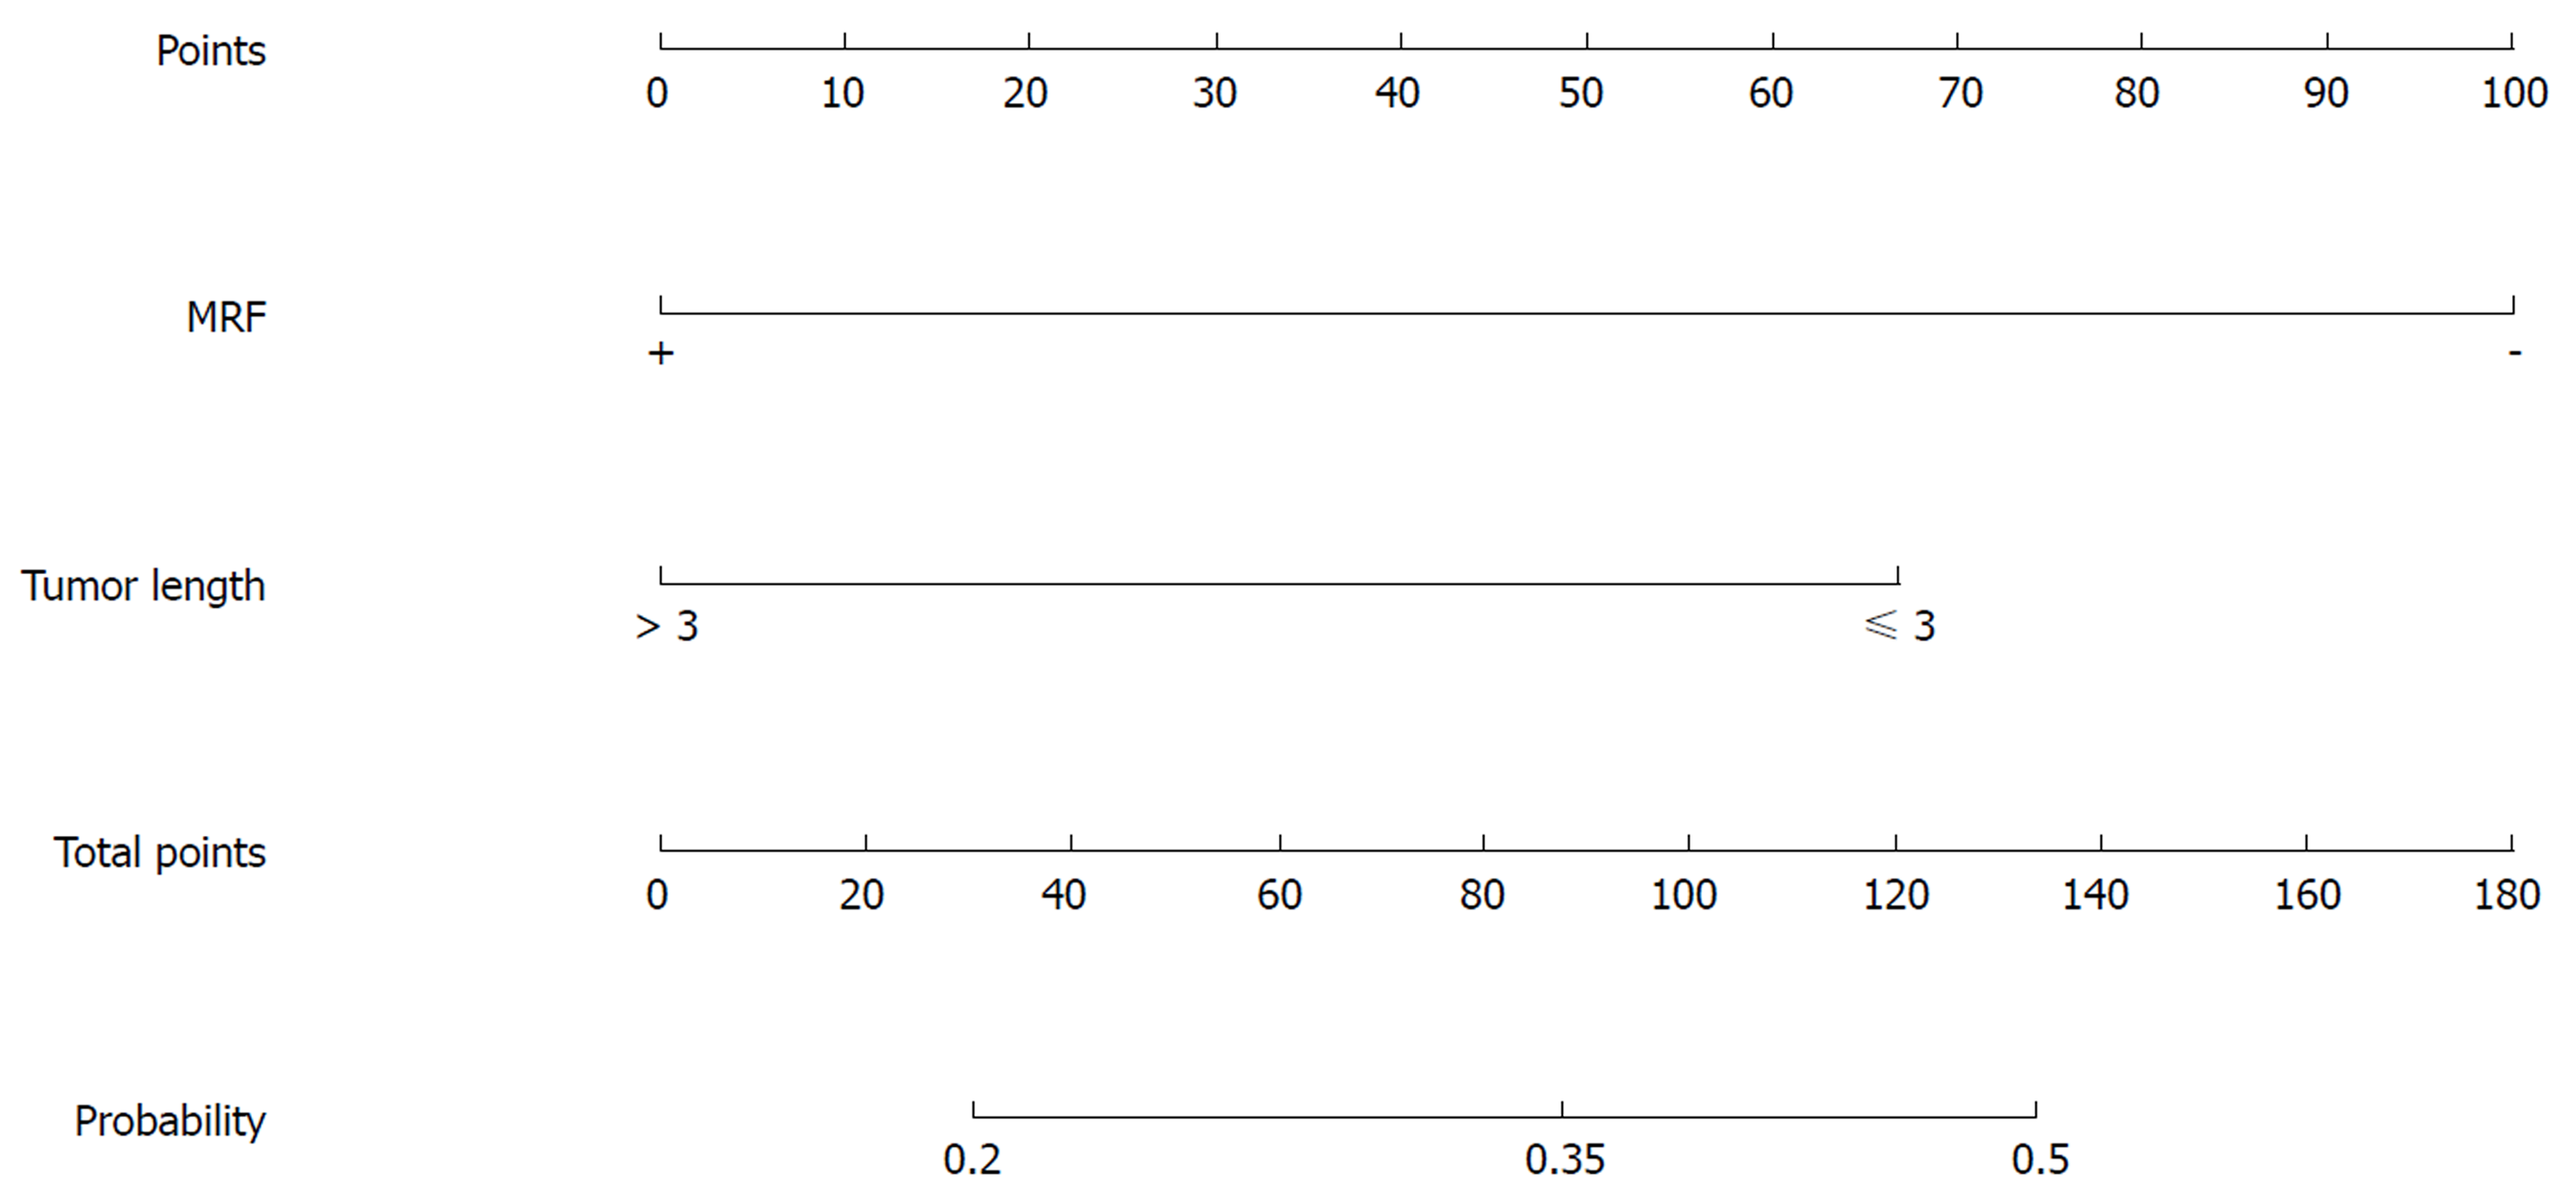
Figure 3 Nomogram for predicting the probability of pathological complete response for the mFOLFOX6-RT regimen.
MRF: Mesorectal fascia.
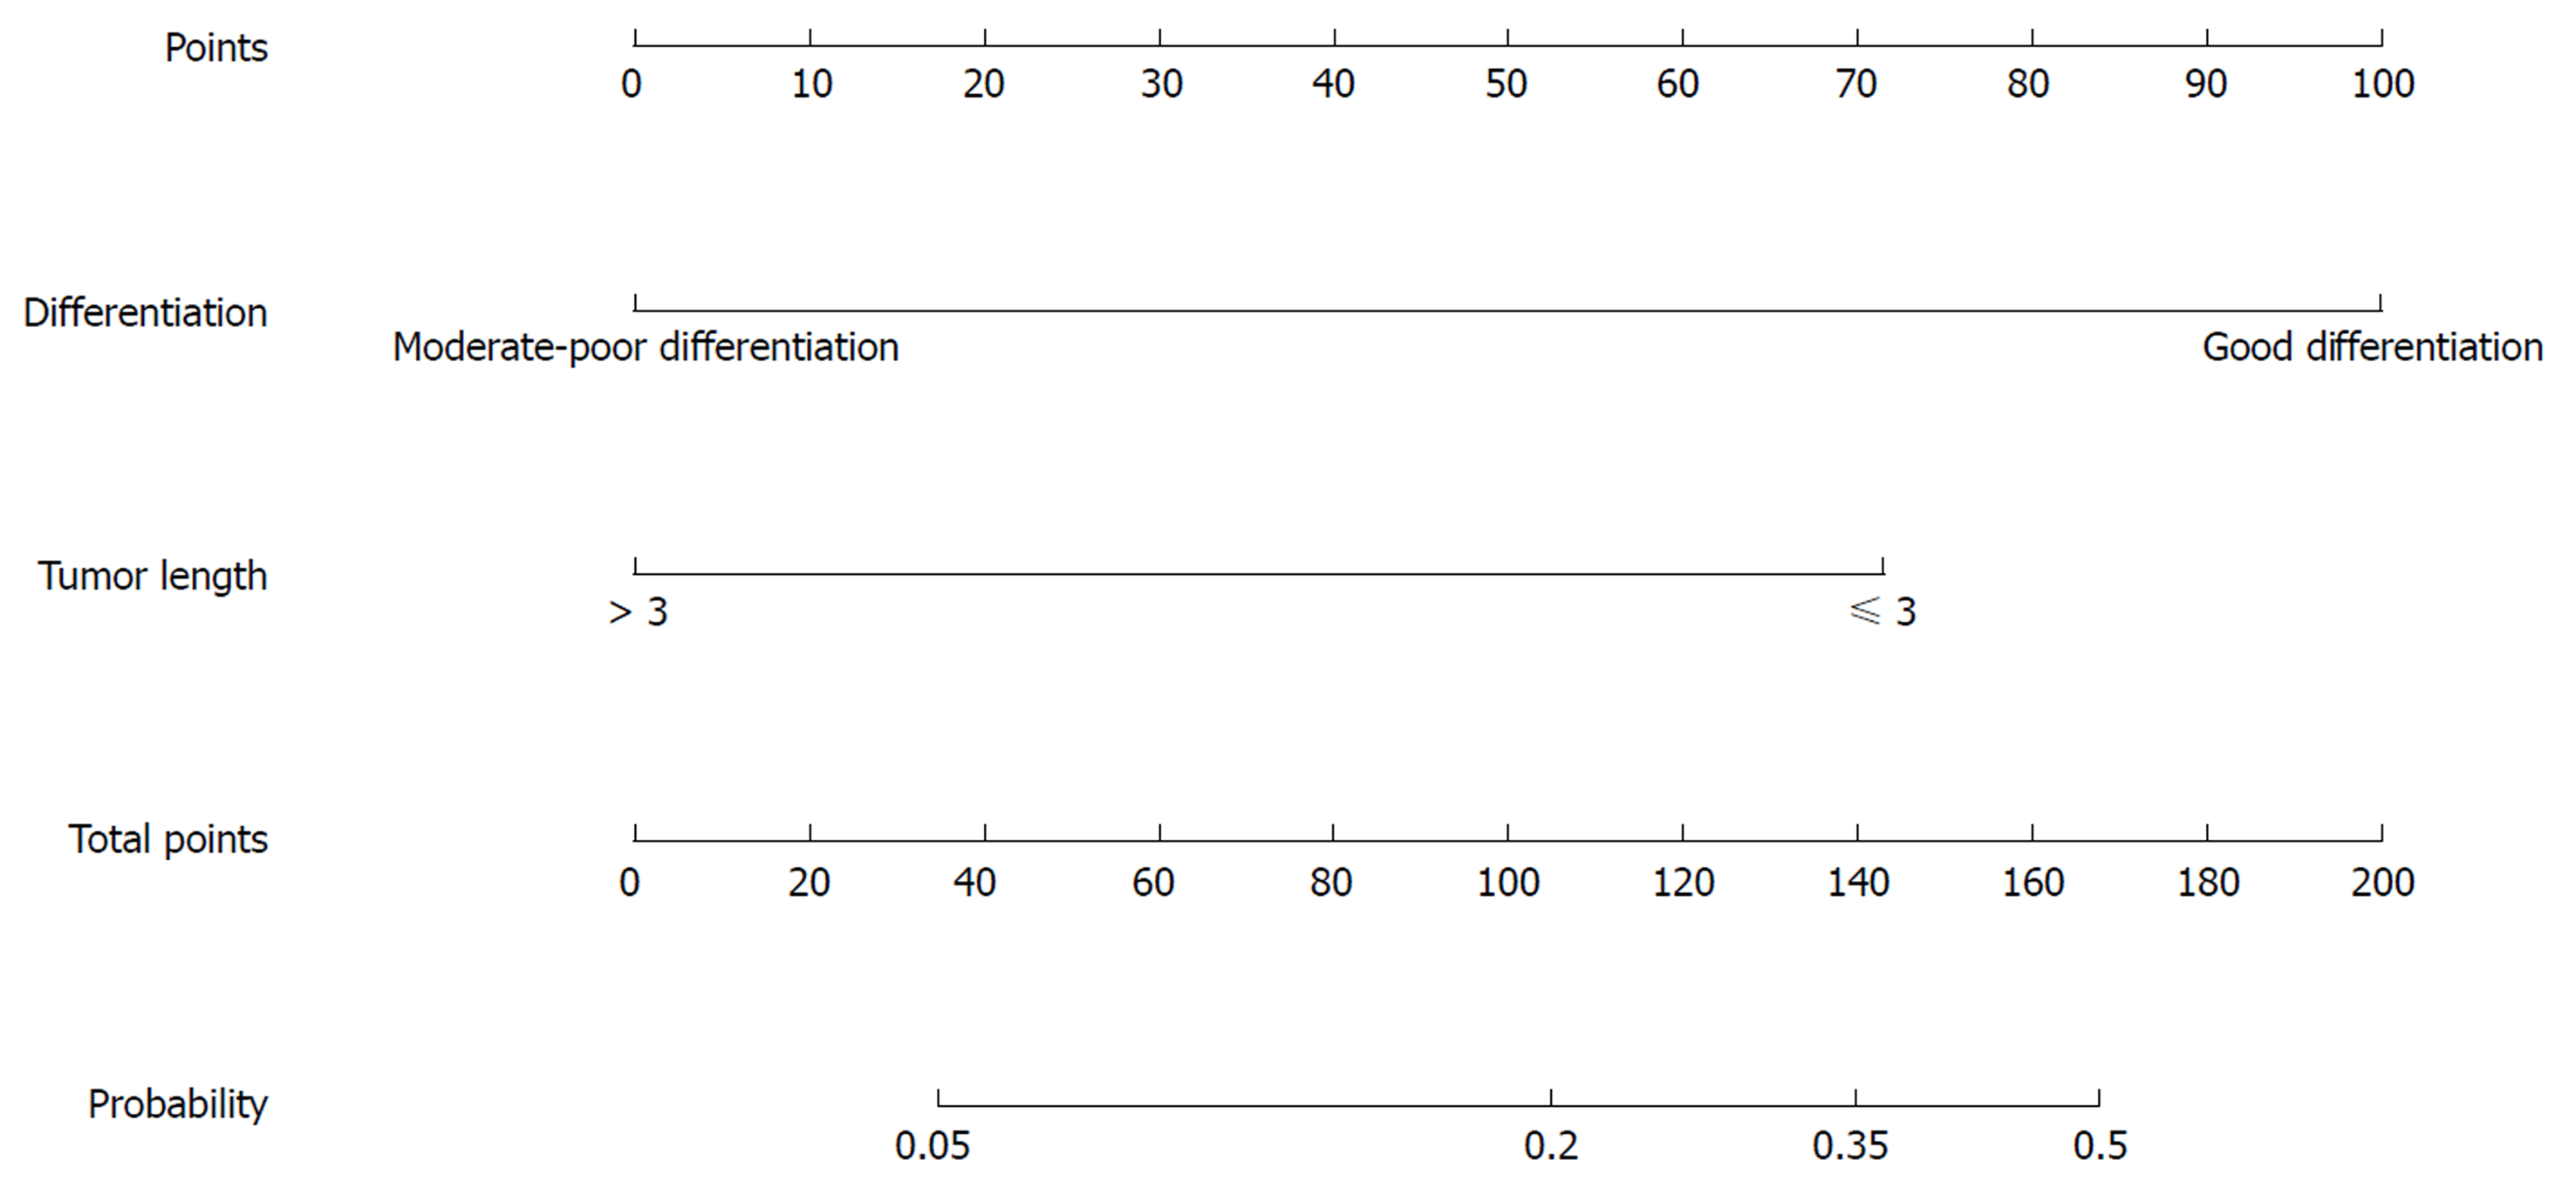
Figure 4 Nomogram for predicting the probability of pathological complete response for the mFOLFOX6 regimen.
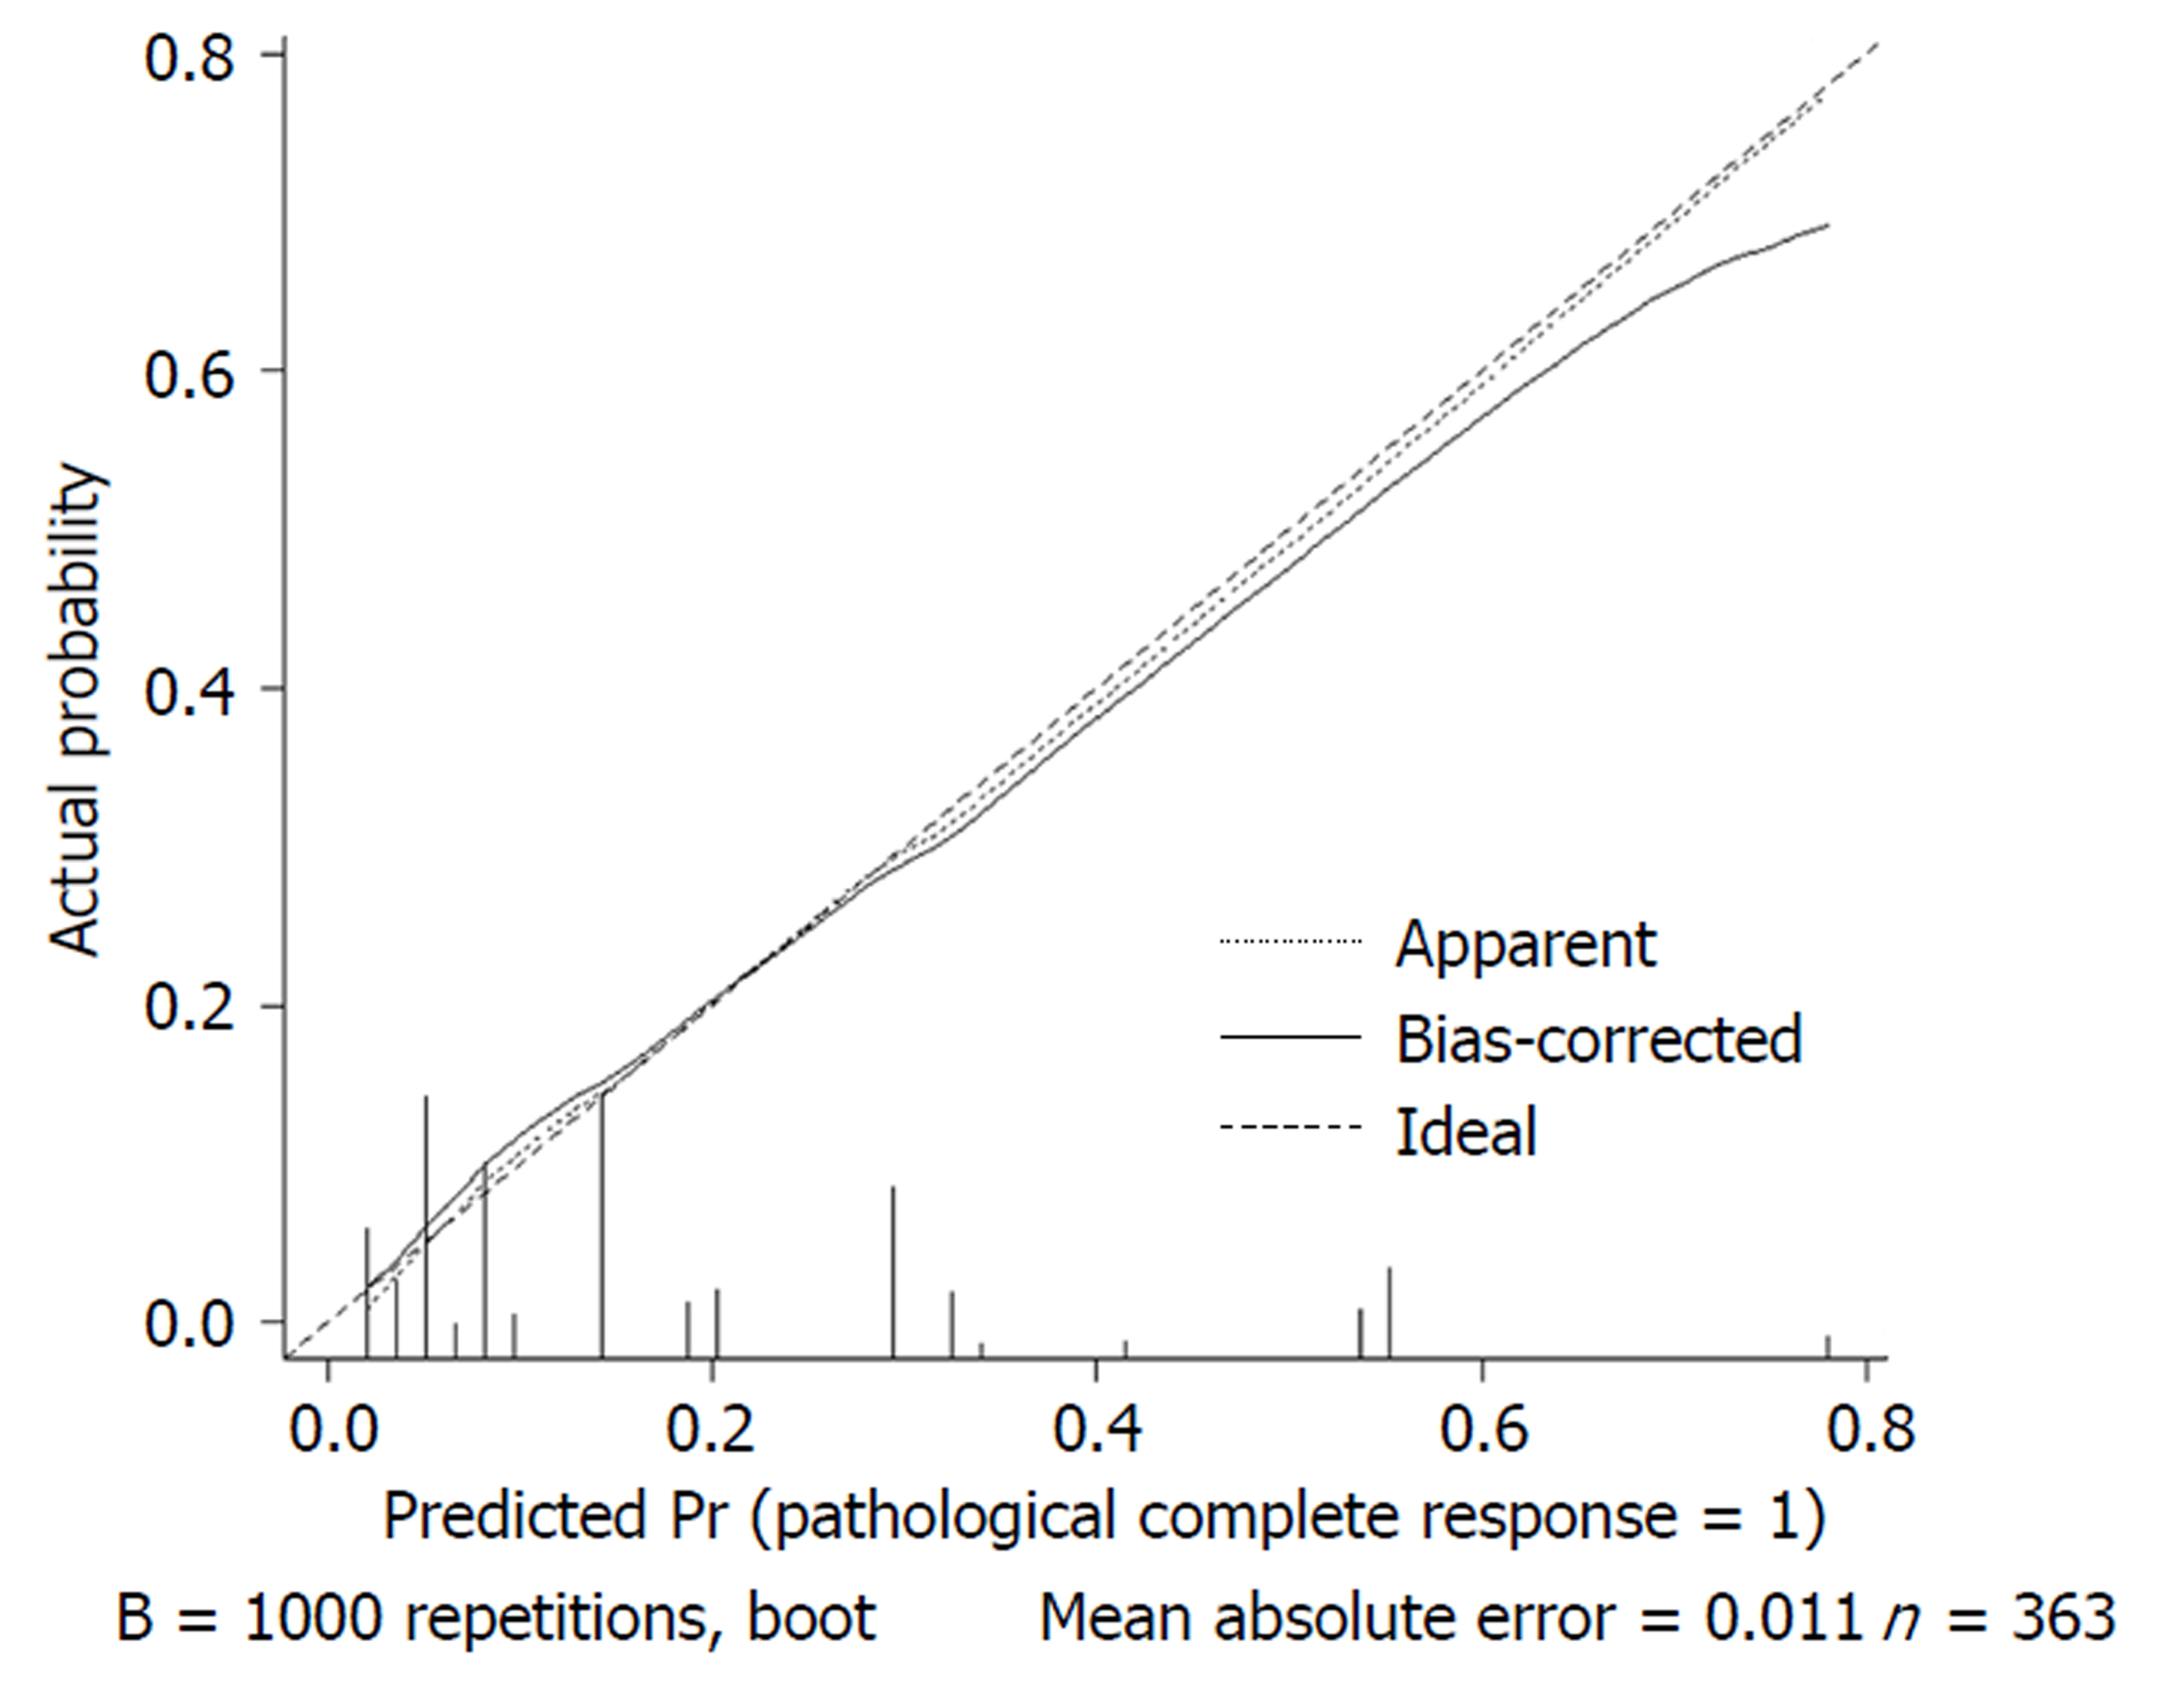
Figure 5 Calibration curve of the predicted and observed probabilities of pathological complete response for all patients.
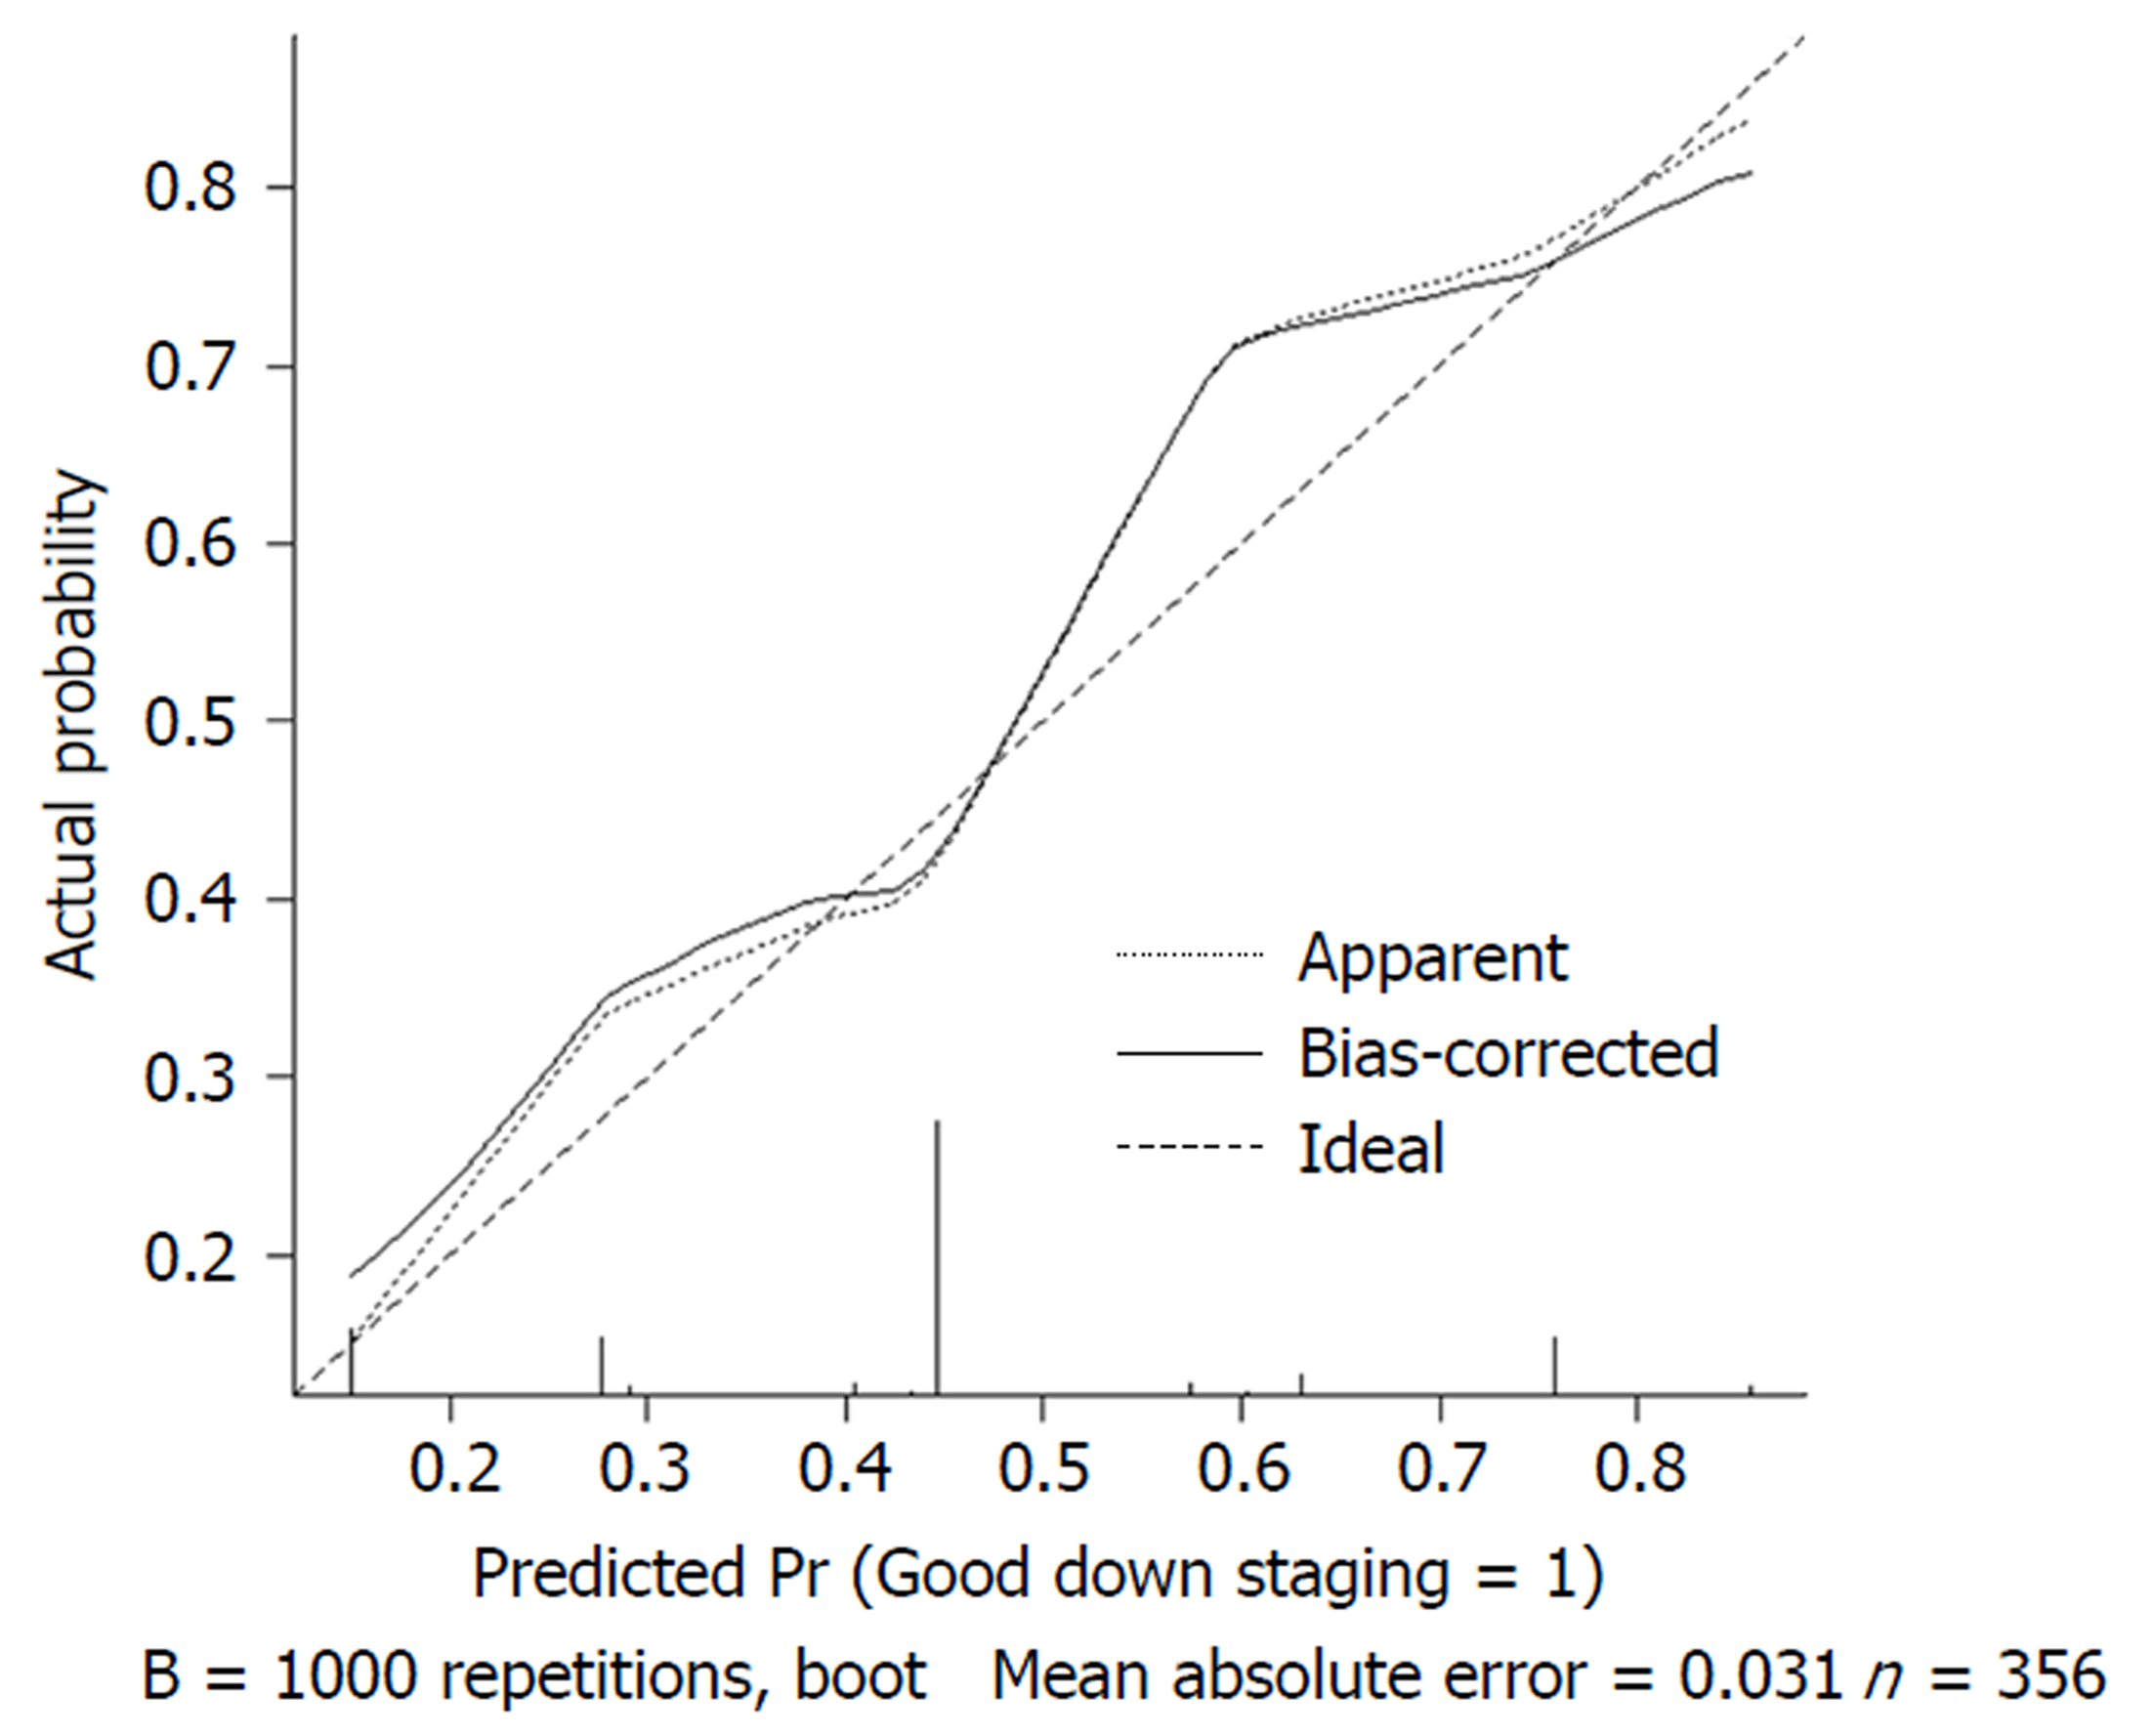
Figure 6 Calibration curve of the predicted and observed probabilities of good downstaging for all patients.
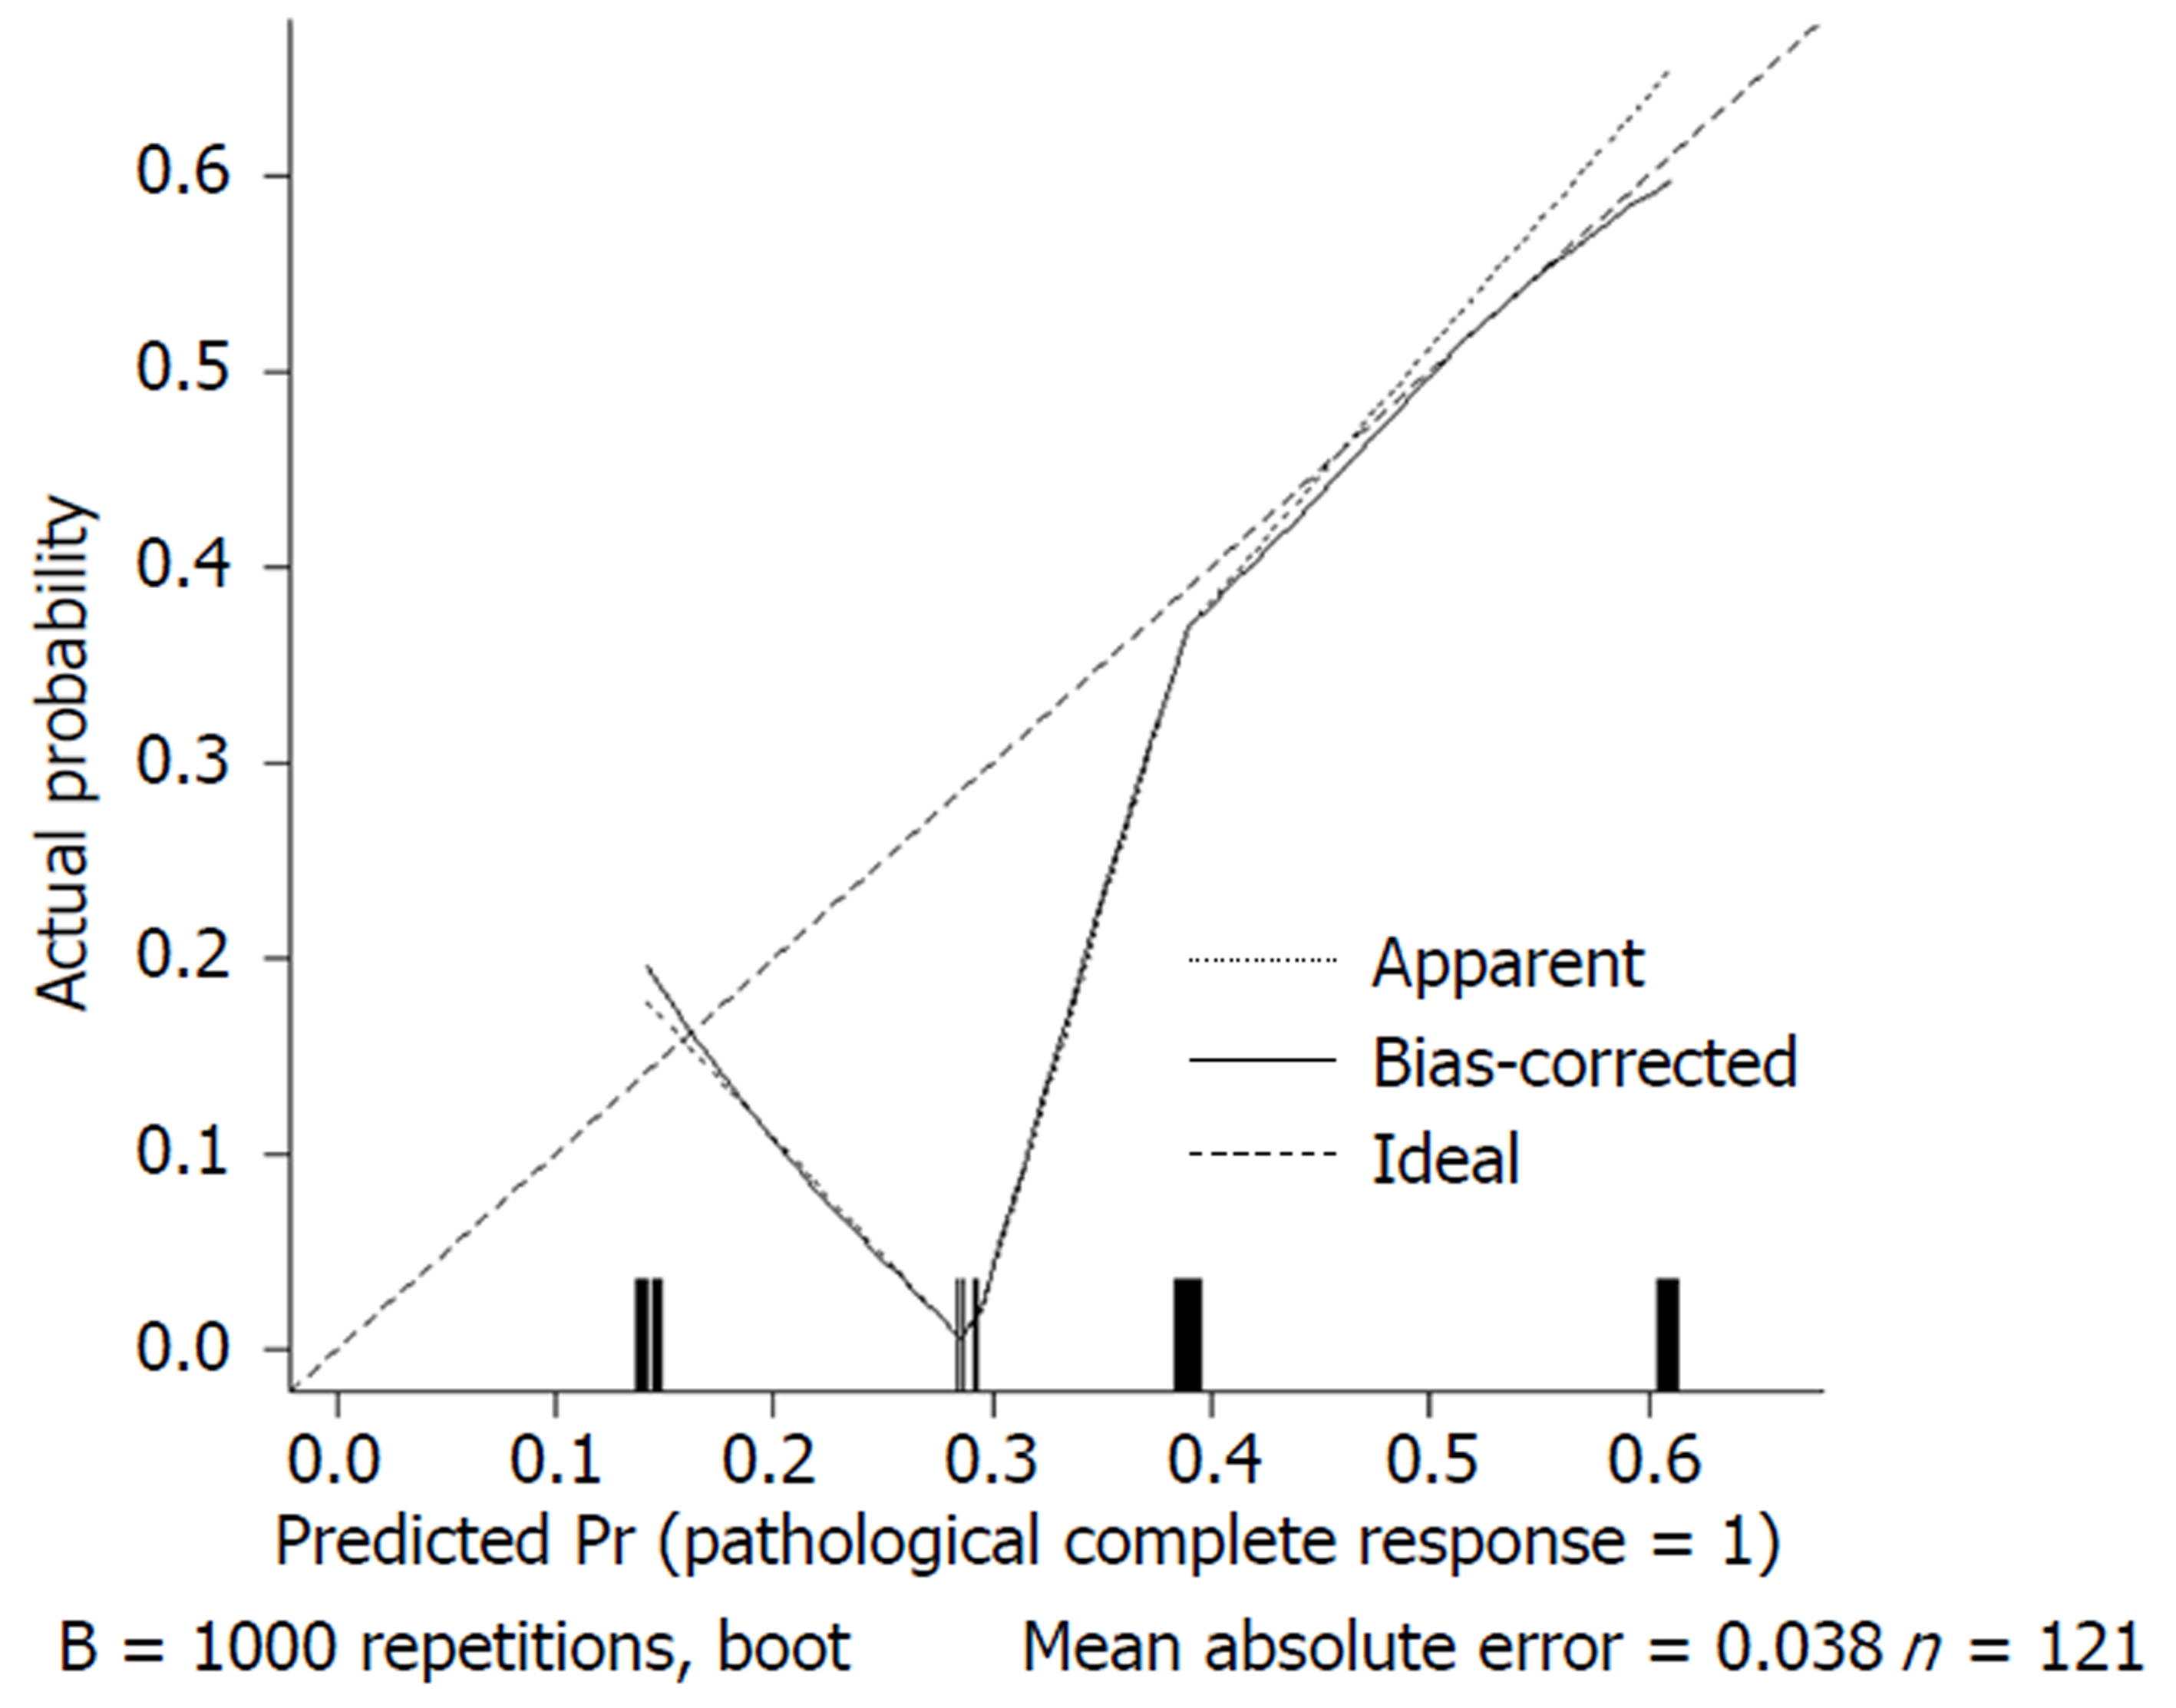
Figure 7 Calibration curve of the predicted and observed probabilities of pathological complete response for the mFOLFOX6-RT regimen.
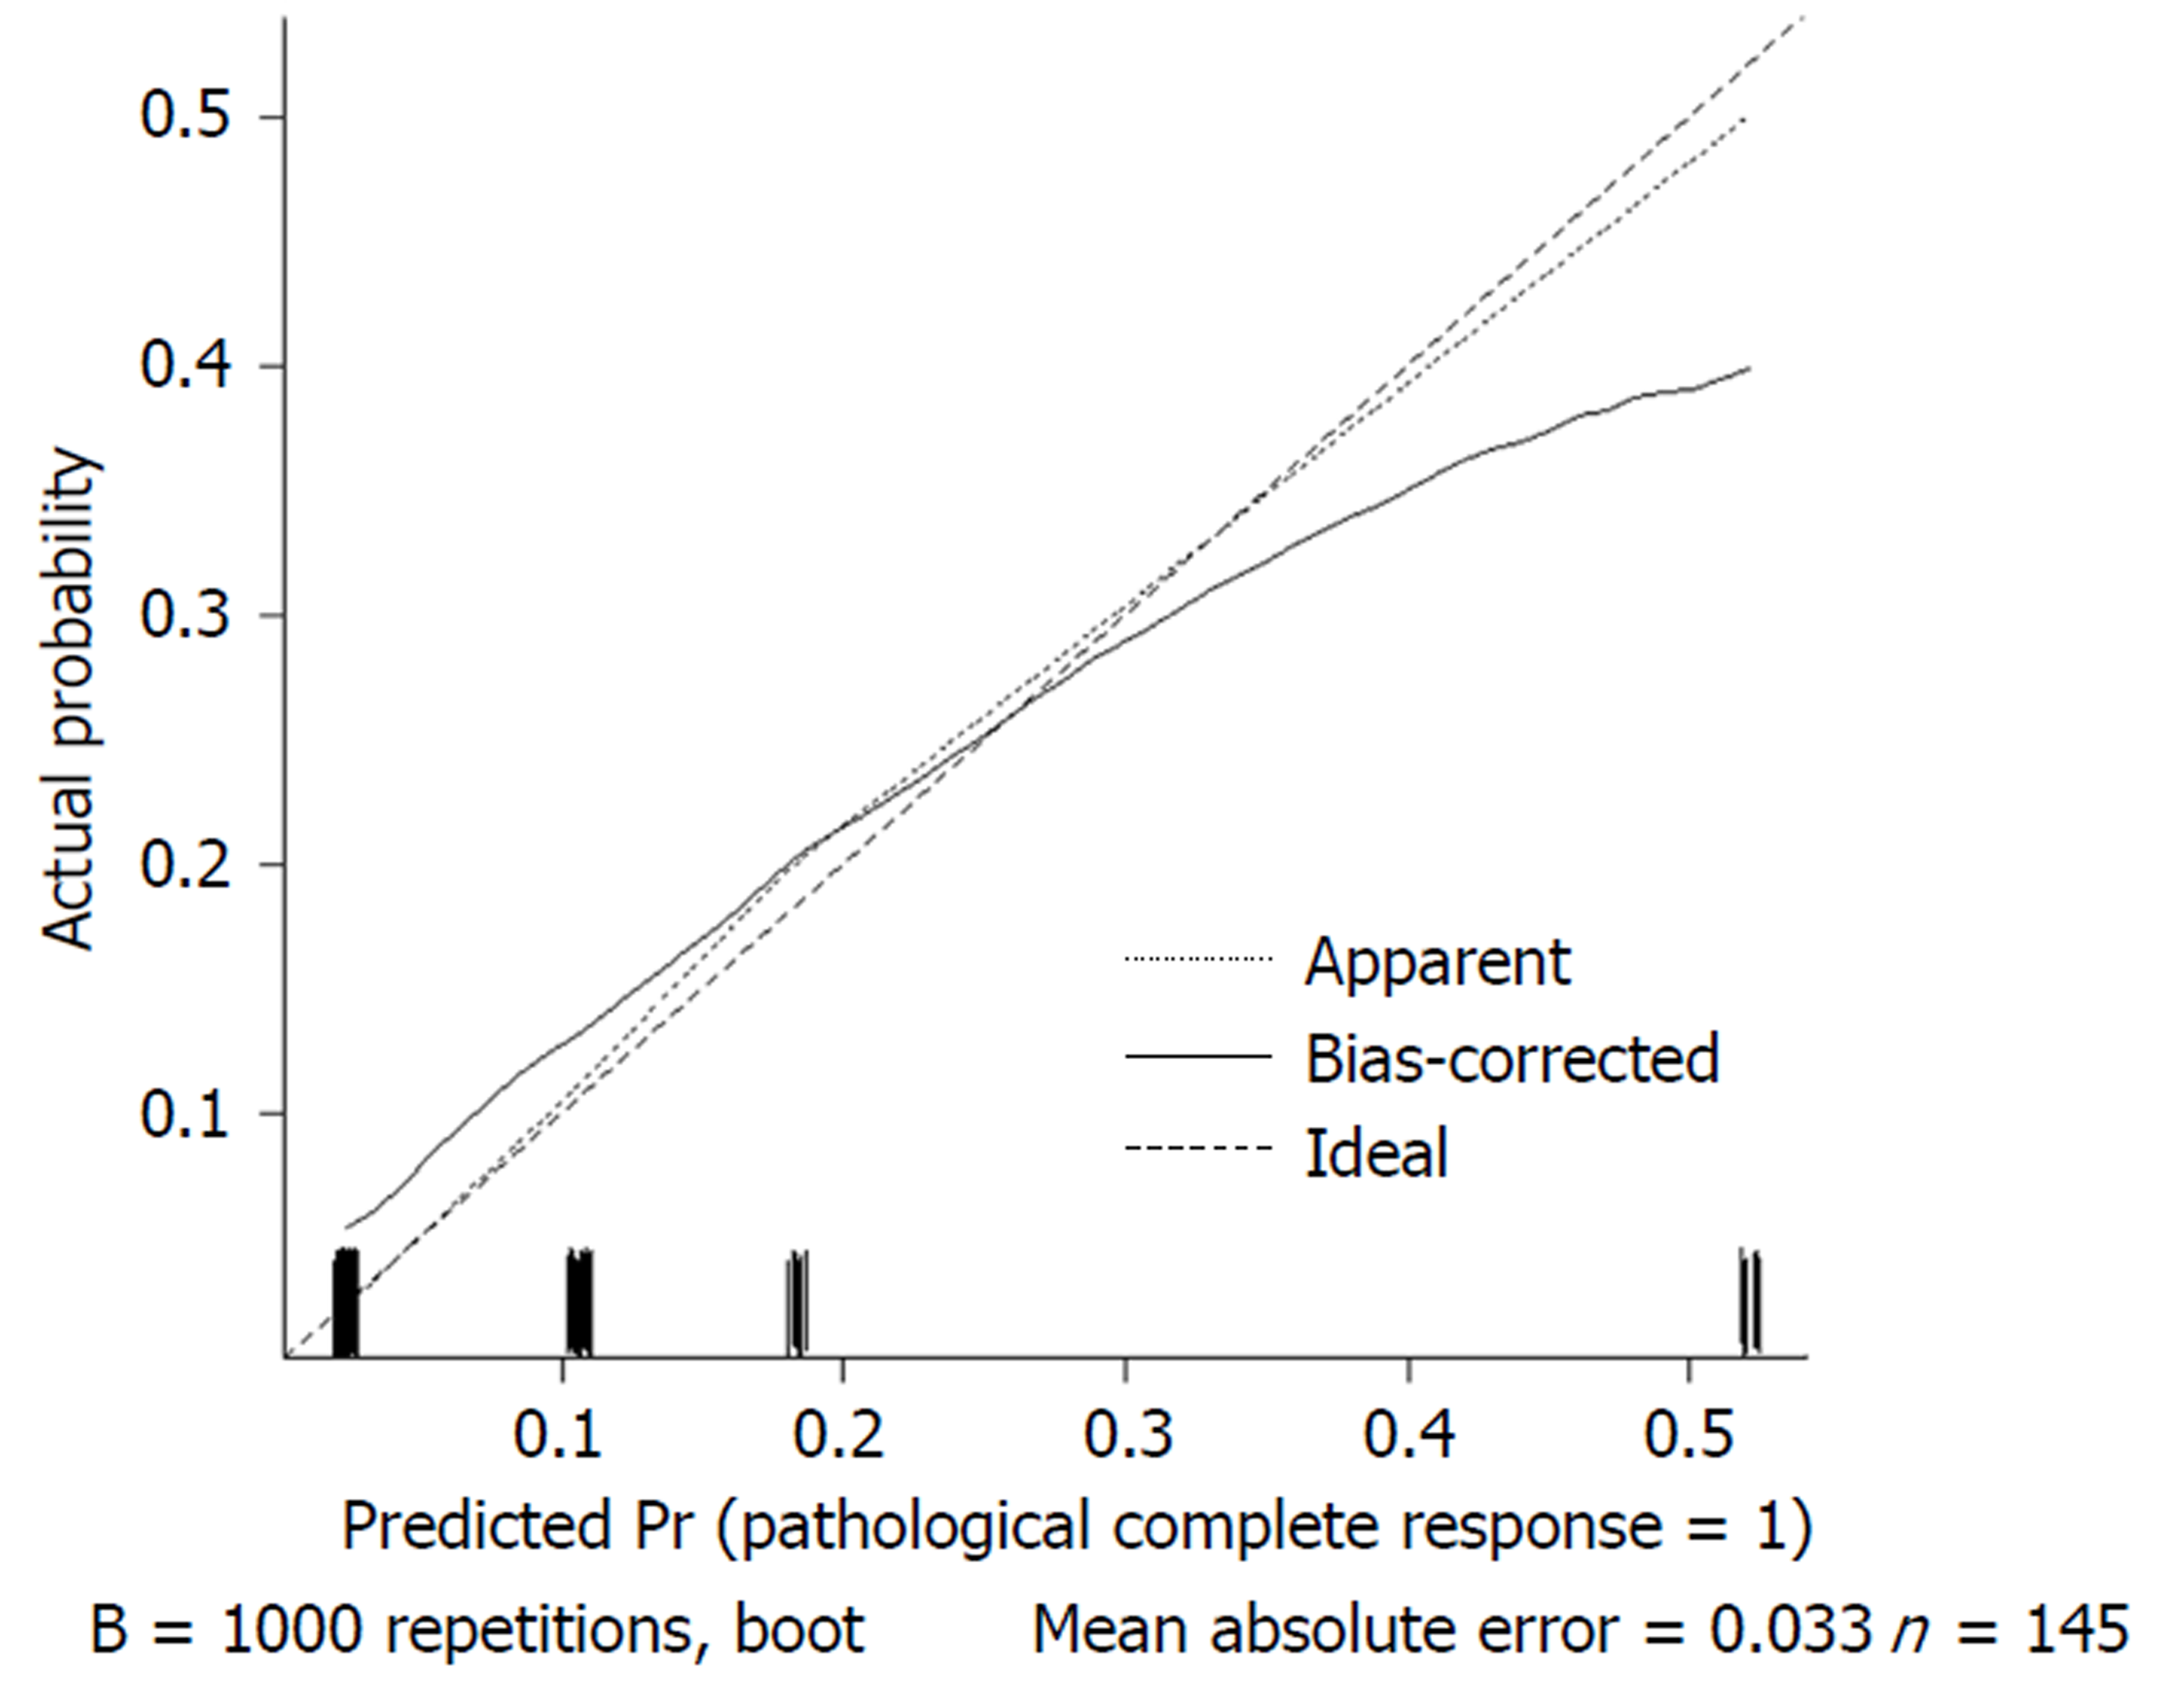
Figure 8 Calibration curve of the predicted and observed probabilities of pathological complete response for the mFOLFOX6 regimen.
- Citation: Ren DL, Li J, Yu HC, Peng SY, Lin WD, Wang XL, Ghoorun RA, Luo YX. Nomograms for predicting pathological response to neoadjuvant treatments in patients with rectal cancer. World J Gastroenterol 2019; 25(1): 118-137
- URL: https://www.wjgnet.com/1007-9327/full/v25/i1/118.htm
- DOI: https://dx.doi.org/10.3748/wjg.v25.i1.118


