Copyright
©The Author(s) 2018.
World J Gastroenterol. Dec 14, 2018; 24(46): 5223-5233
Published online Dec 14, 2018. doi: 10.3748/wjg.v24.i46.5223
Published online Dec 14, 2018. doi: 10.3748/wjg.v24.i46.5223
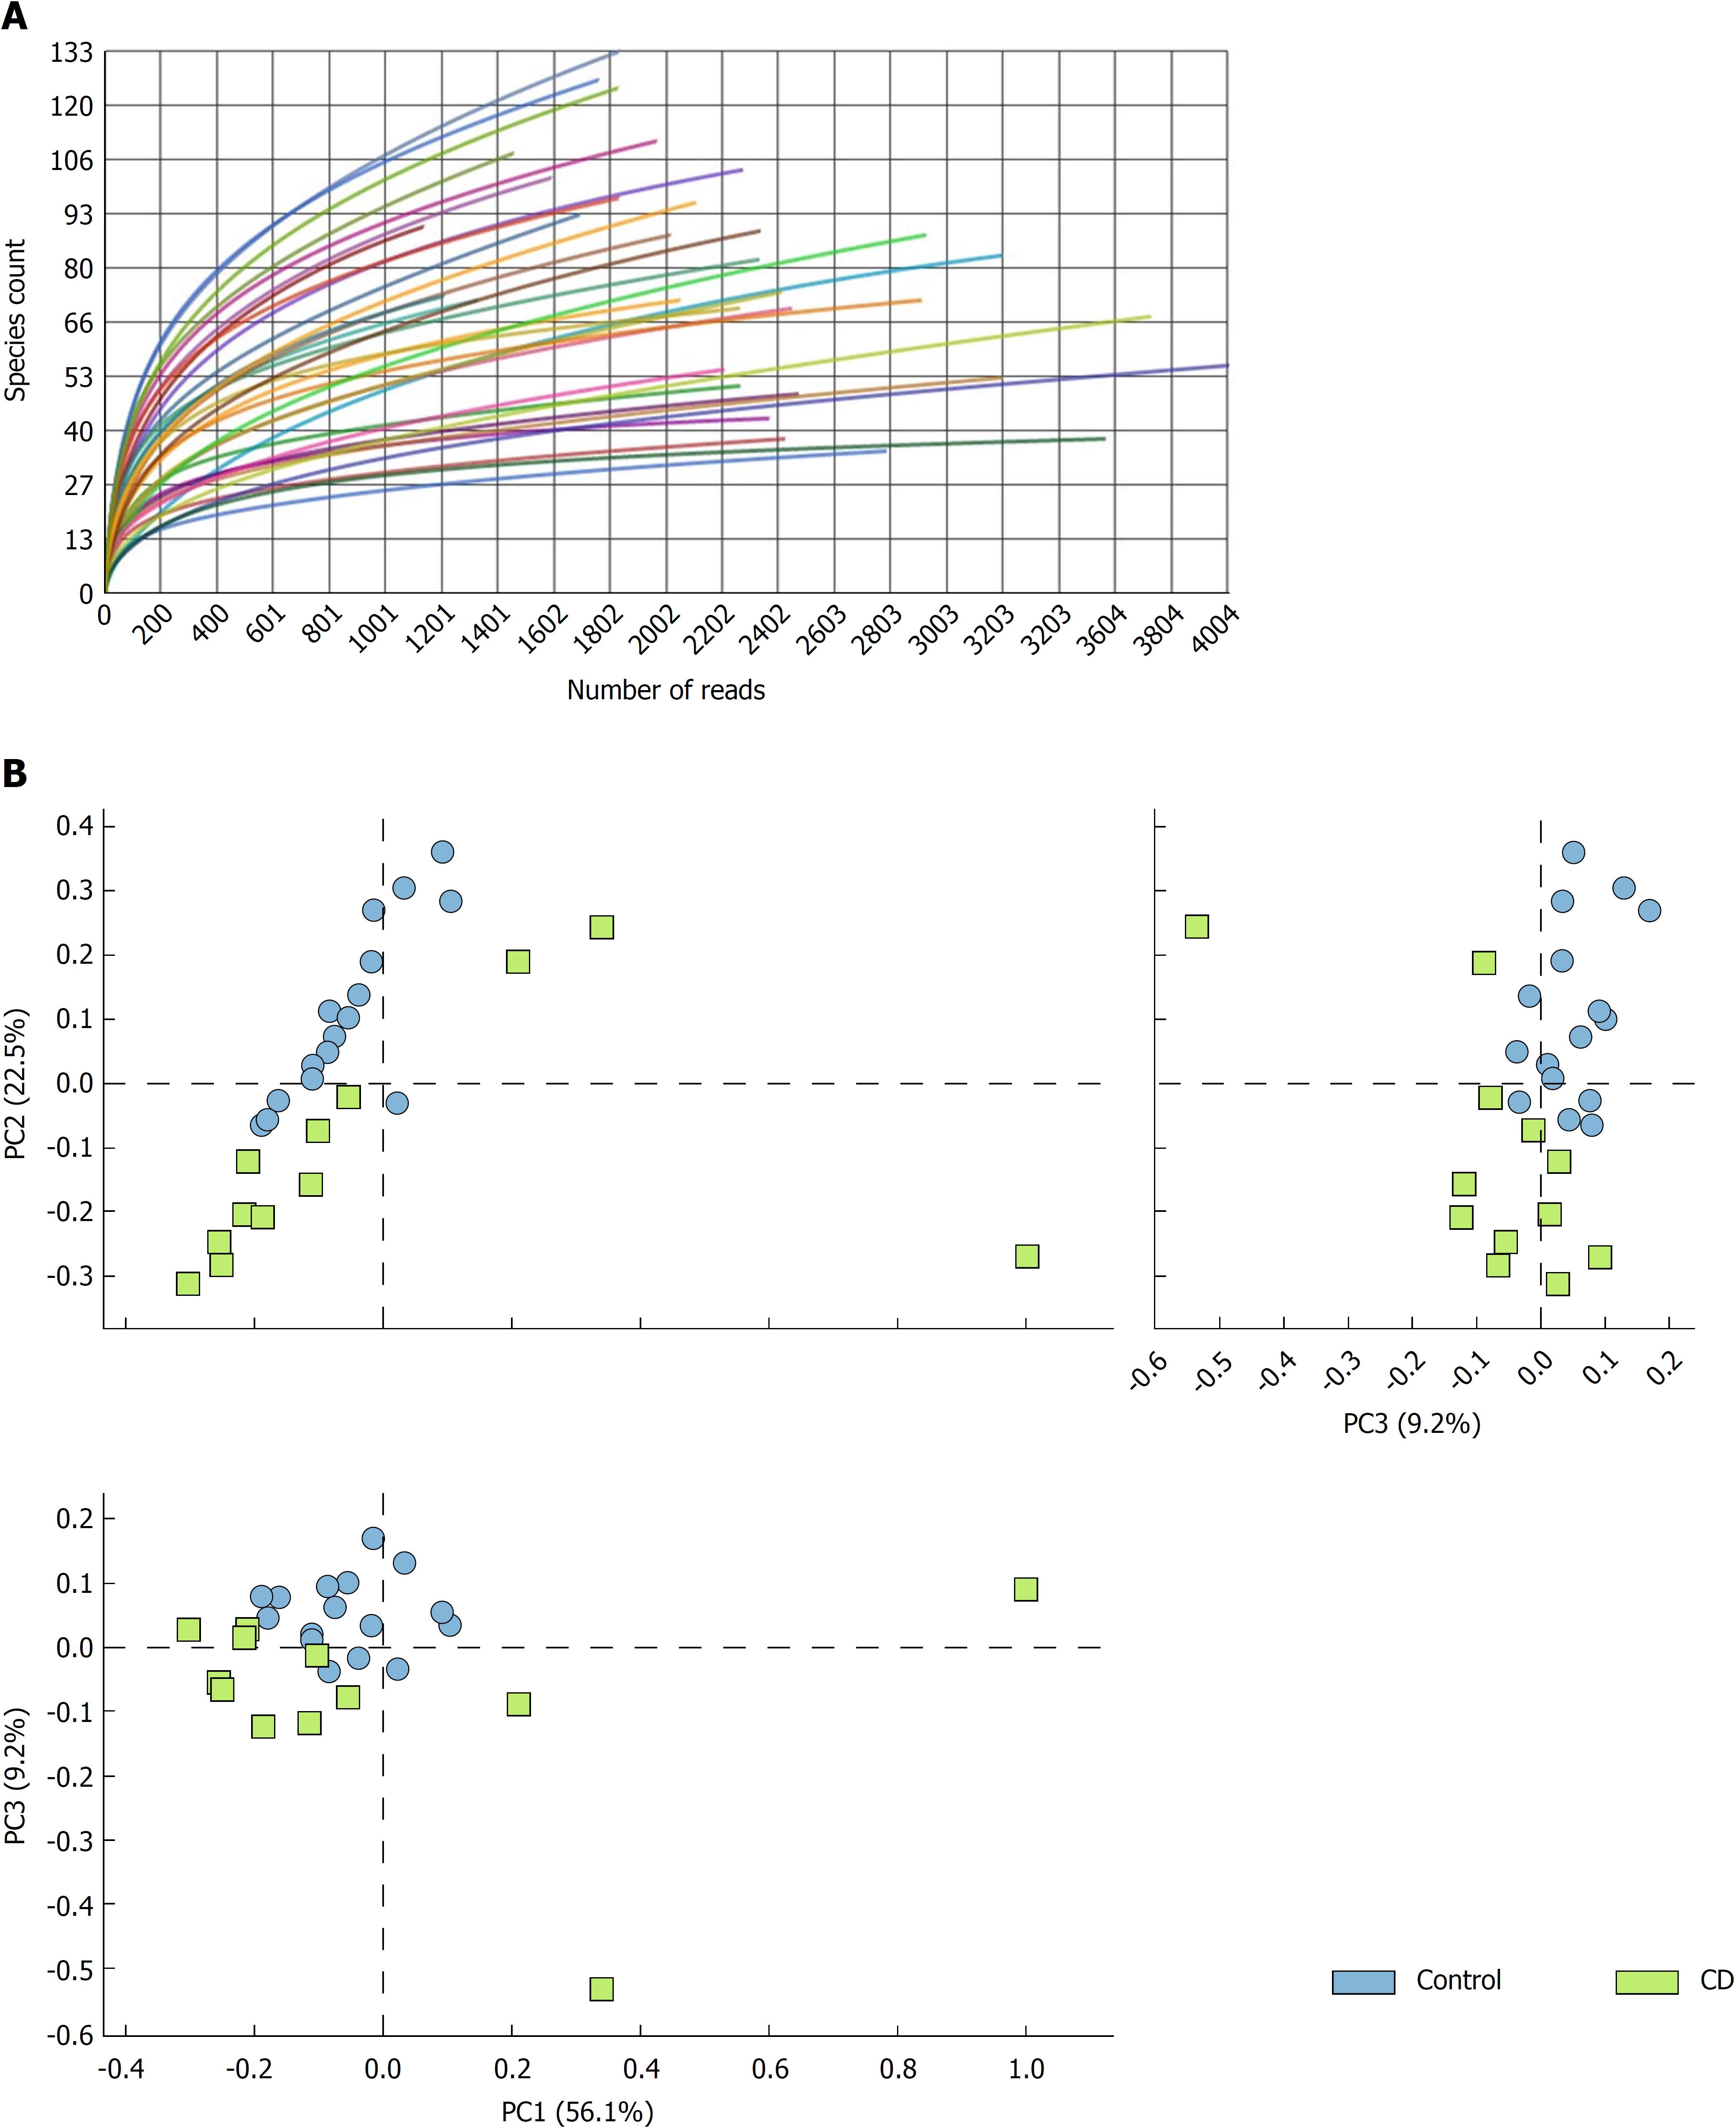
Figure 1 Ecological and metagenomic analysis.
A: Number of readings for each sample using the 16S massive sequencing technique in GS Junior. See methods section for details. B: Principal components analysis. The control samples and Crohn’s disease are observed in well-defined groups. The data was selected with the Ribosomal Project database using a maximum e-value of 10-5, a minimum identity of 75%, and a minimum length alignment of 15 bp. PC: Principal components; CD: Crohn’s disease sample.
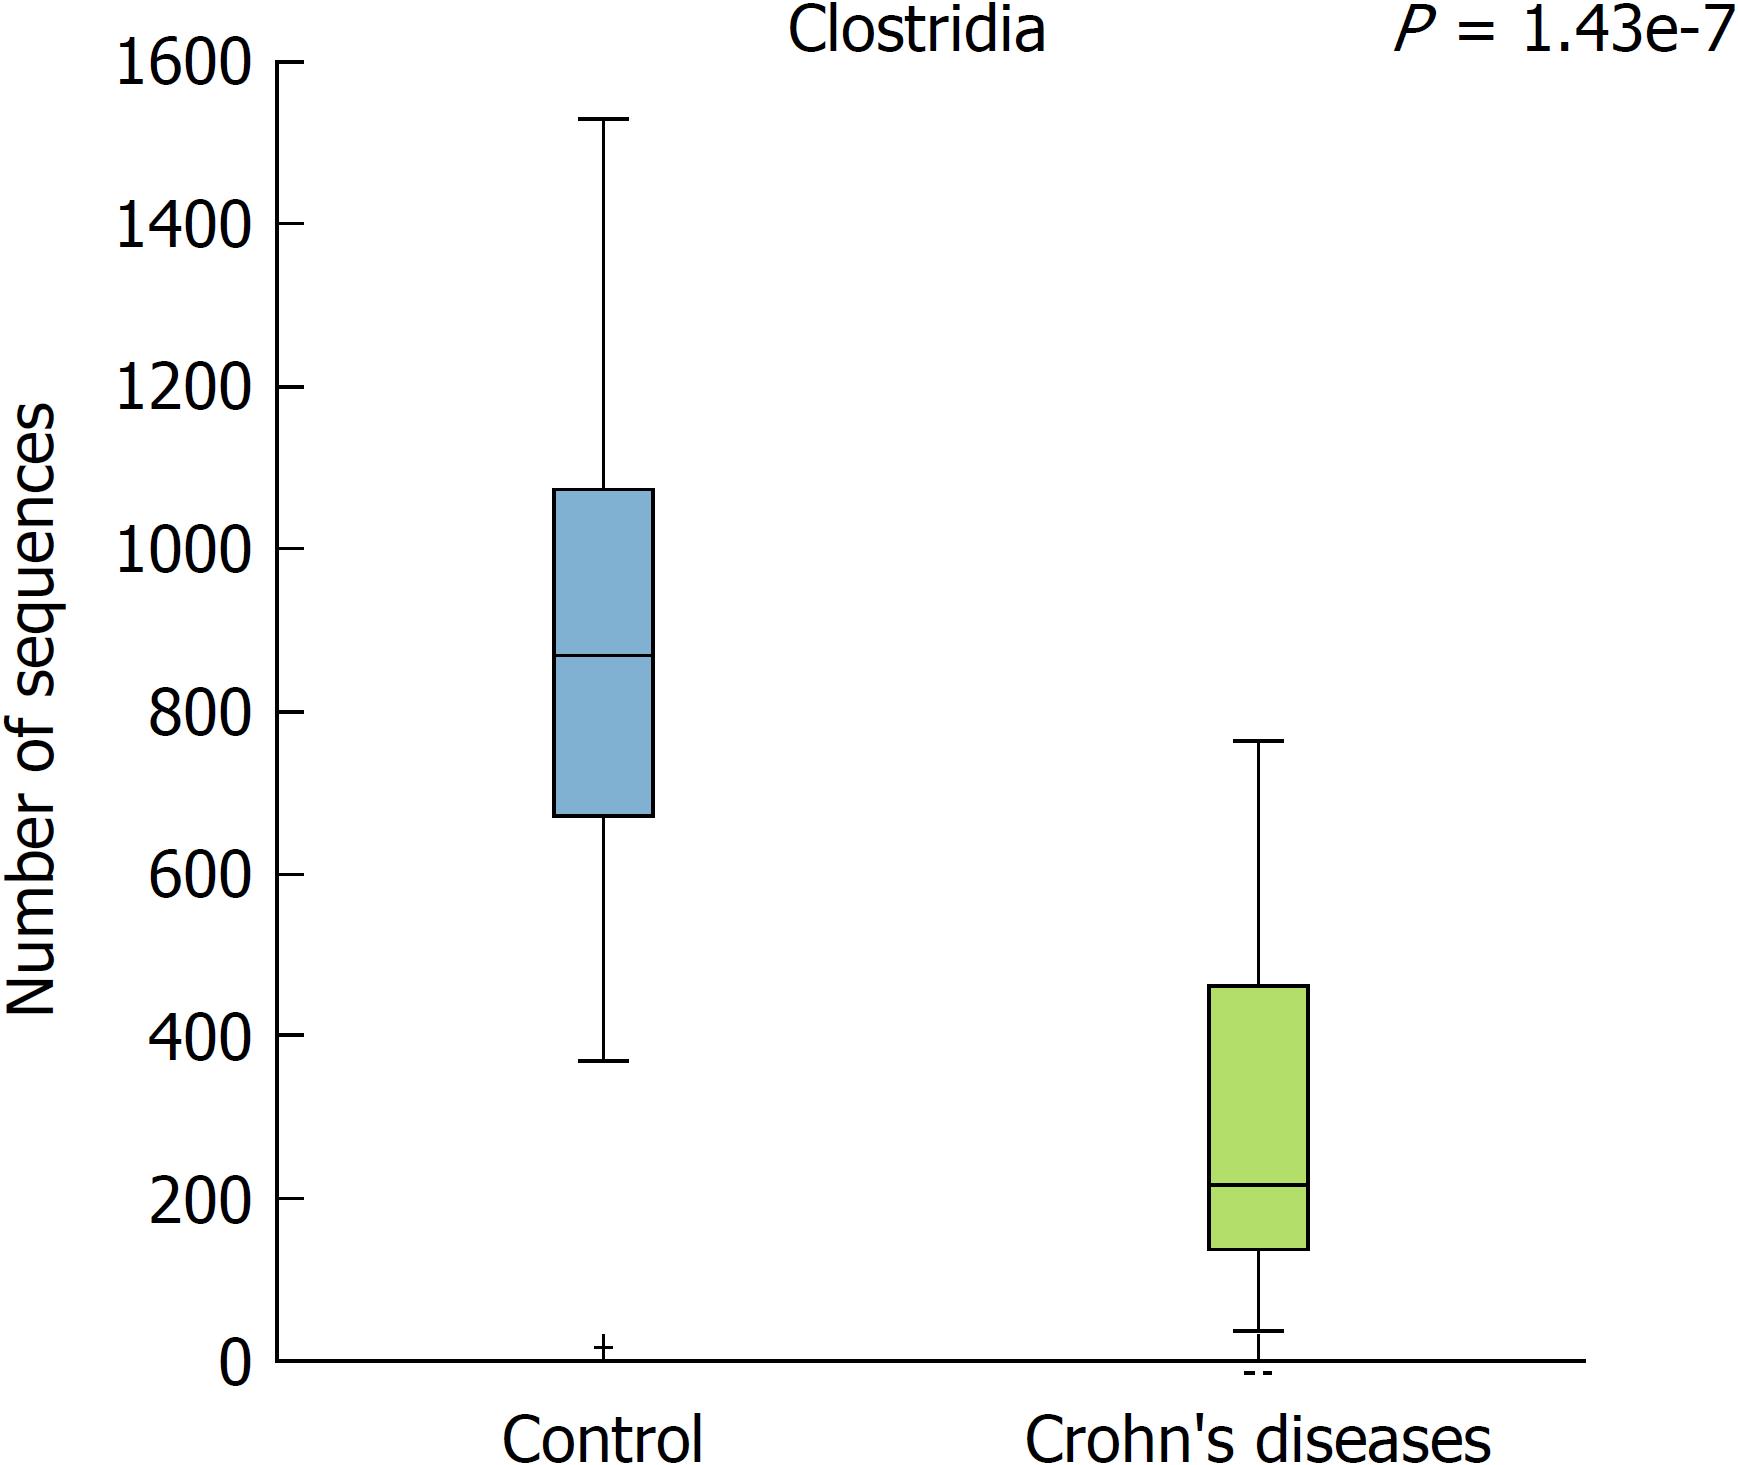
Figure 2 Box plot showing a significant difference in the Clostridia class between control group (blue) and Crohn’ disease (green).
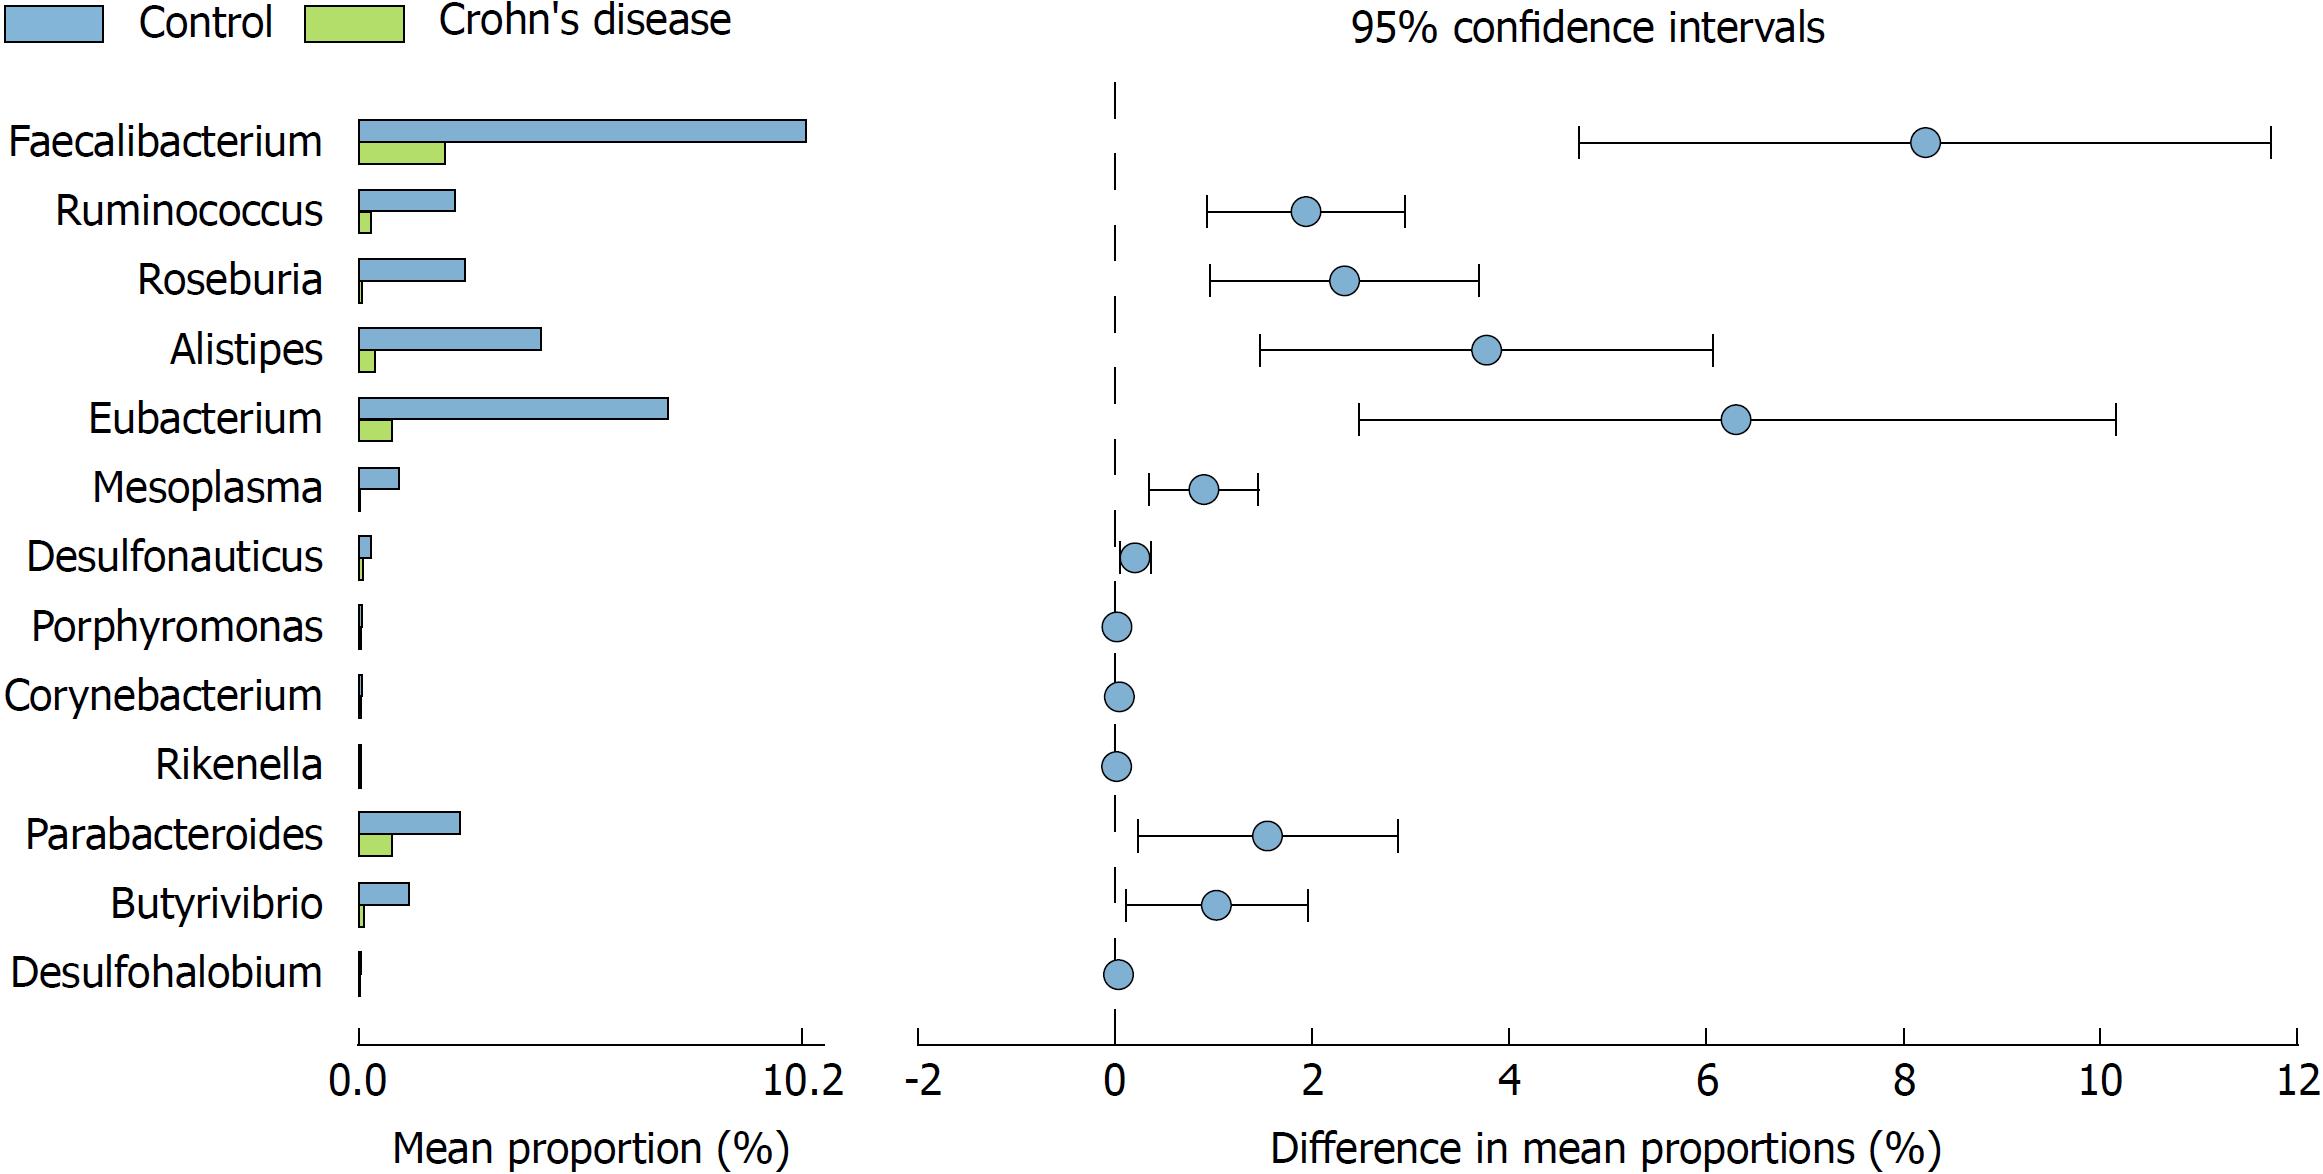
Figure 3 Bar graph with the mean of each group (Crohn’s disease and control population) and family taxon (95% confidence level).
Figure 4 Bar chart with the mean of each taxonomic group (gender) according to group (control vs Crohn’s disease) and differences with 95% confidence level.
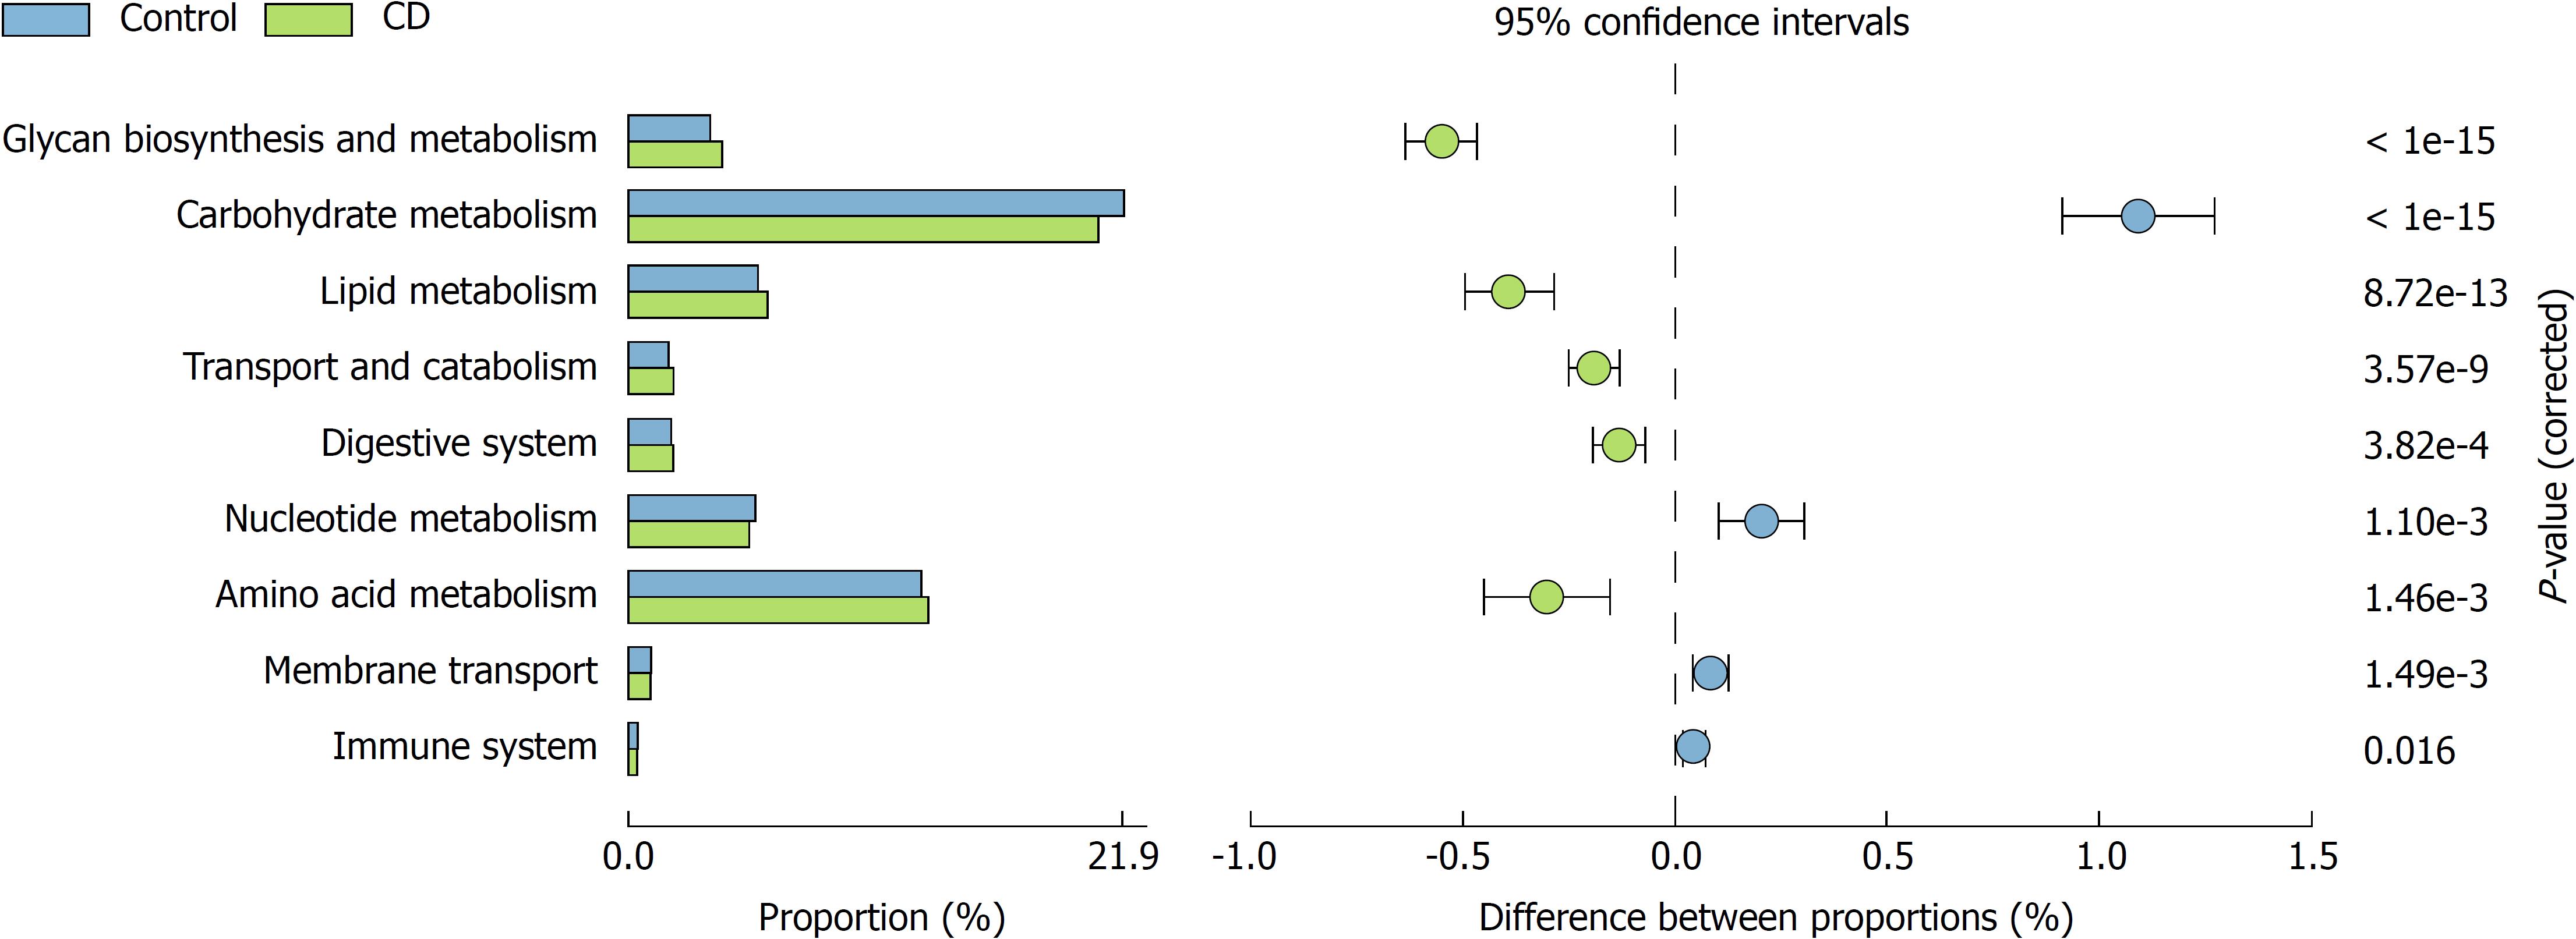
Figure 5 Functional analysis of the microbiota.
Significant differences (P < 0.05) in biosynthesis and glycan metabolism, carbohydrate metabolism, lipid metabolism, catabolism, digestive system, amino acid metabolism and immune system were found. C: Control sample; CD: Crohn’s disease sample.
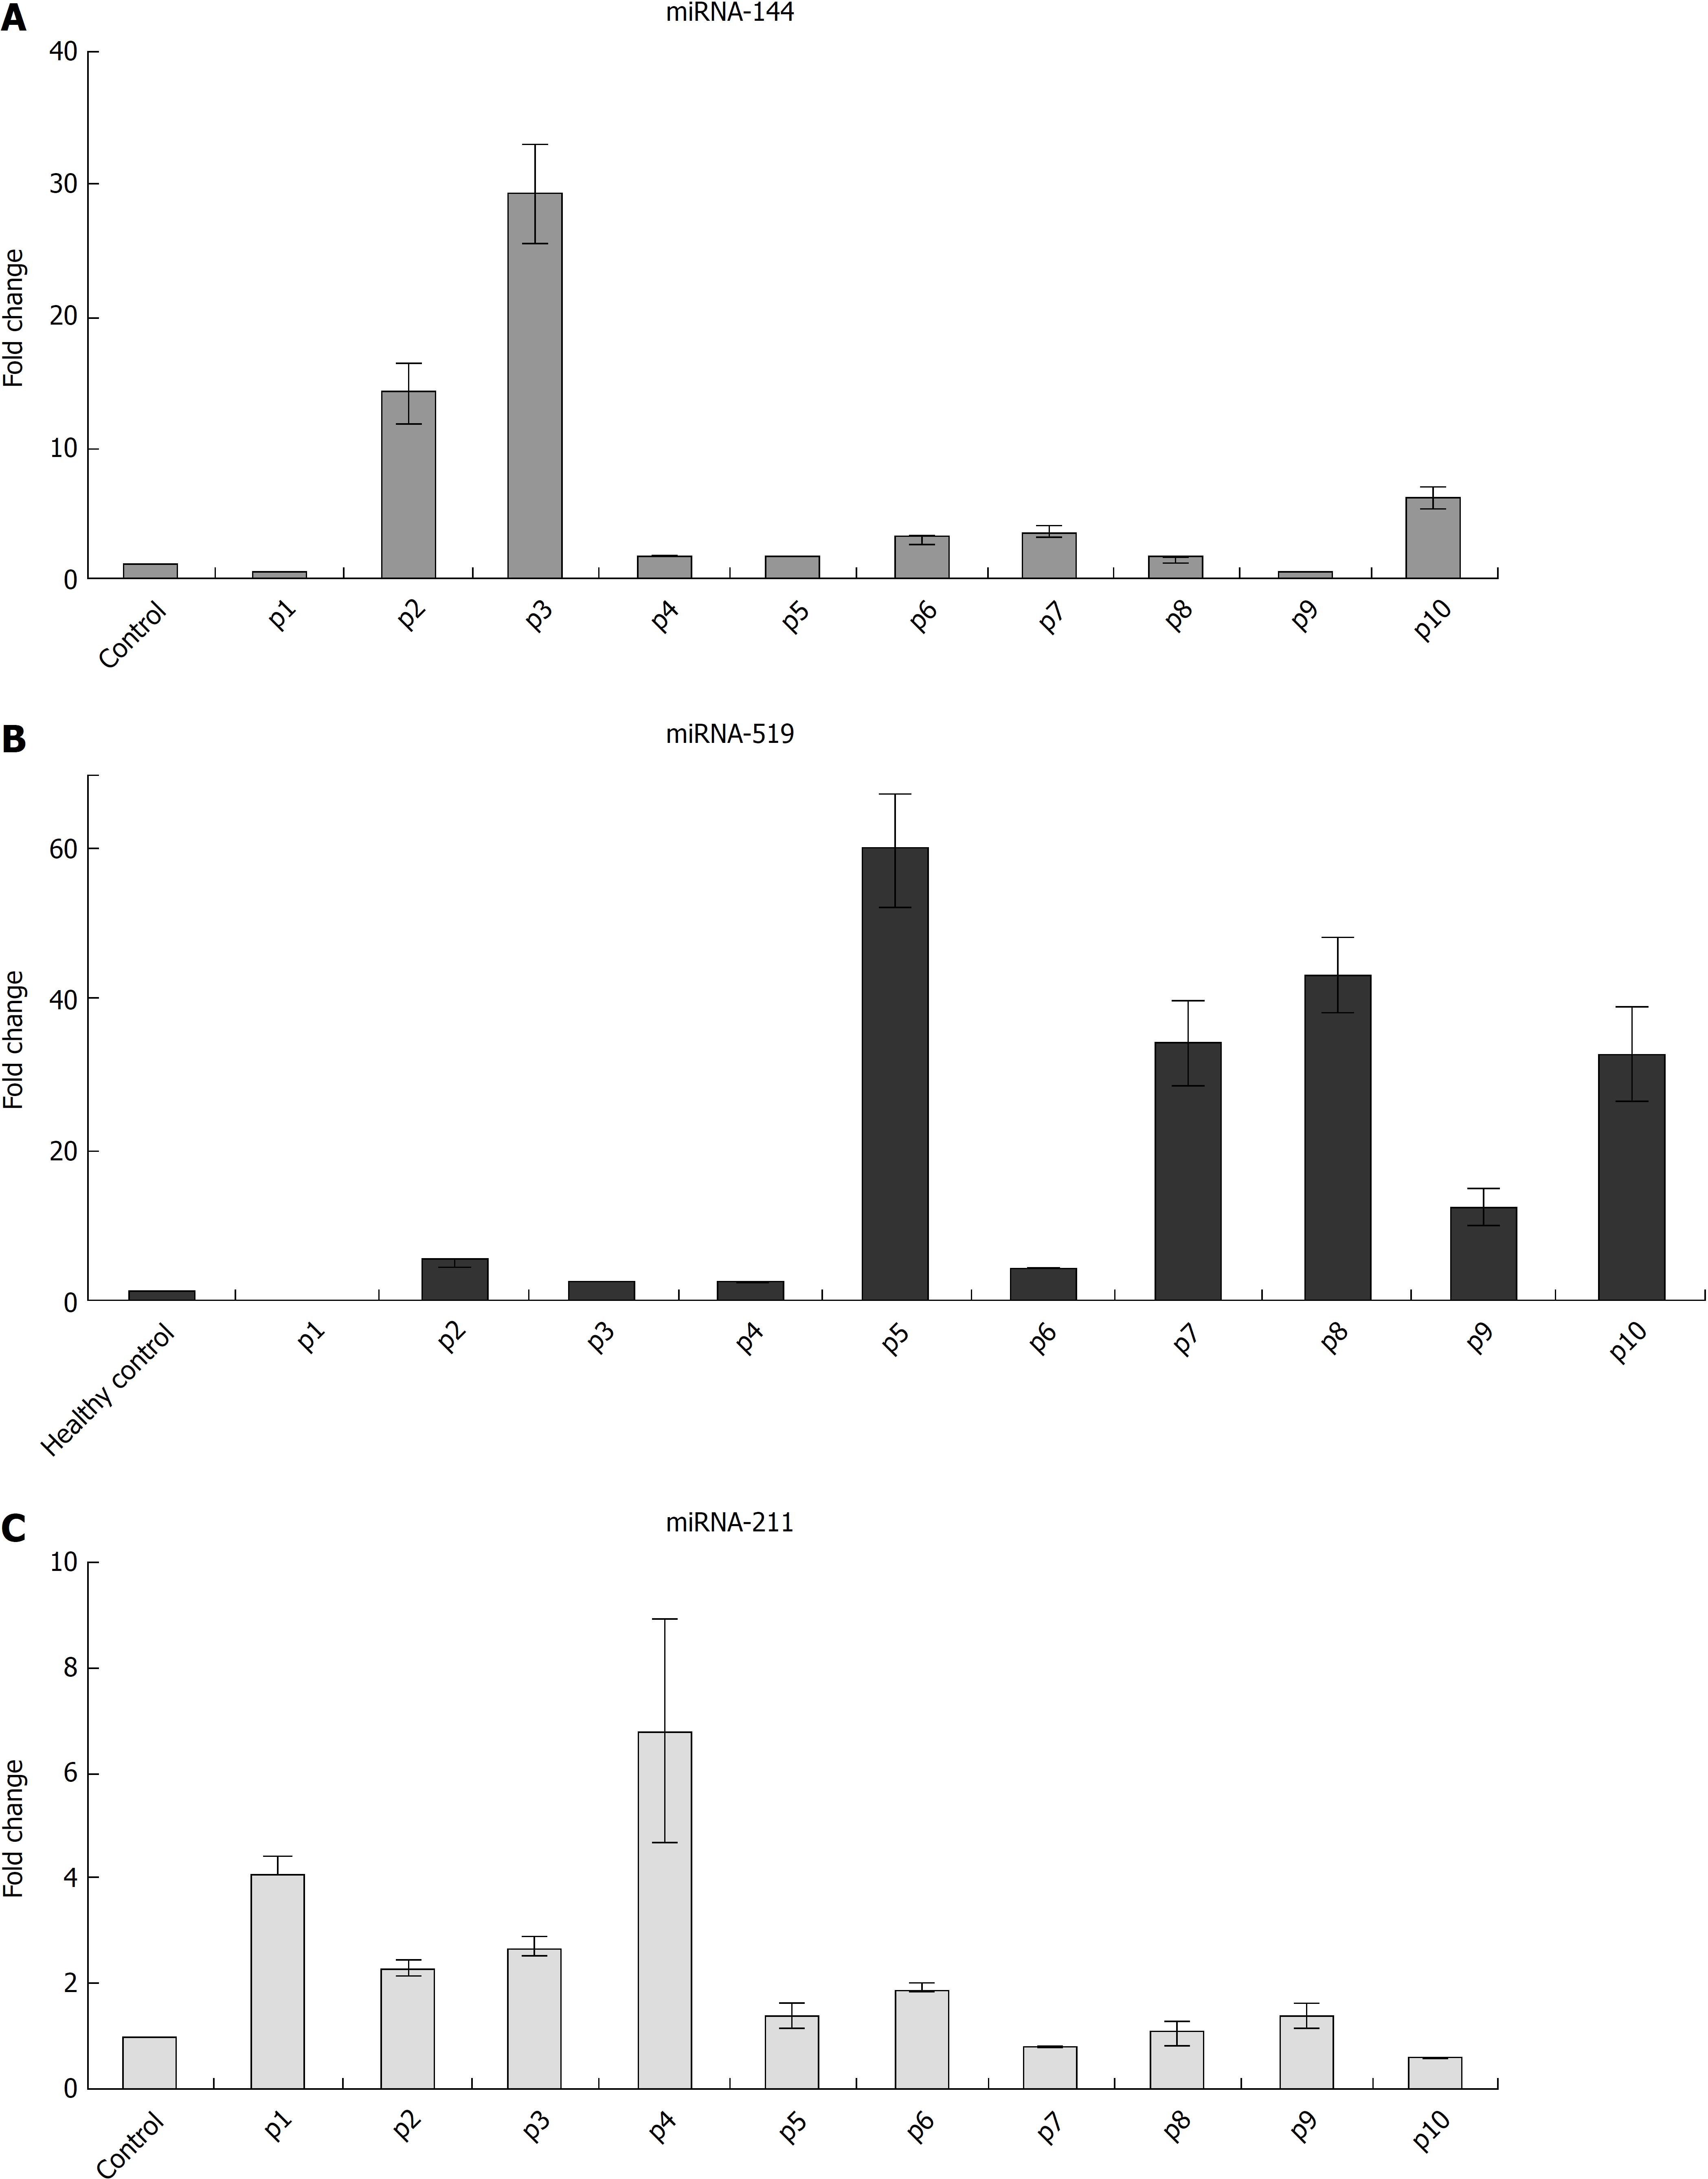
Figure 6 Three microRNAs were found increased in samples from patients with Crohn’s disease.
Individual microRNA levels in 10 patients with Crohn’s disease are represented. miRNA: MicroRNA.
- Citation: Rojas-Feria M, Romero-García T, Fernández Caballero-Rico JÁ, Pastor Ramírez H, Avilés-Recio M, Castro-Fernandez M, Chueca Porcuna N, Romero-Gόmez M, García F, Grande L, Del Campo JA. Modulation of faecal metagenome in Crohn’s disease: Role of microRNAs as biomarkers. World J Gastroenterol 2018; 24(46): 5223-5233
- URL: https://www.wjgnet.com/1007-9327/full/v24/i46/5223.htm
- DOI: https://dx.doi.org/10.3748/wjg.v24.i46.5223


