Copyright
©The Author(s) 2018.
World J Gastroenterol. Sep 14, 2018; 24(34): 3927-3957
Published online Sep 14, 2018. doi: 10.3748/wjg.v24.i34.3927
Published online Sep 14, 2018. doi: 10.3748/wjg.v24.i34.3927
Figure 1 Schematic flow diagram of the studies reviewed for inclusion in analysis.
Figure 2 Meta-analysis and forest plot presentation of the anti-hepatitis A virus antibody from 1984 to 1994.
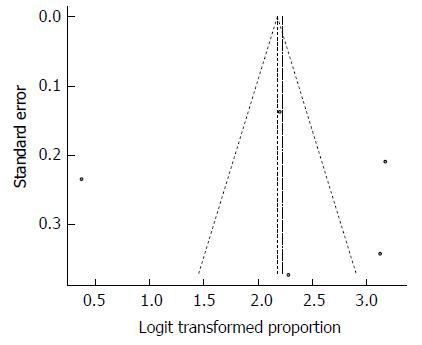
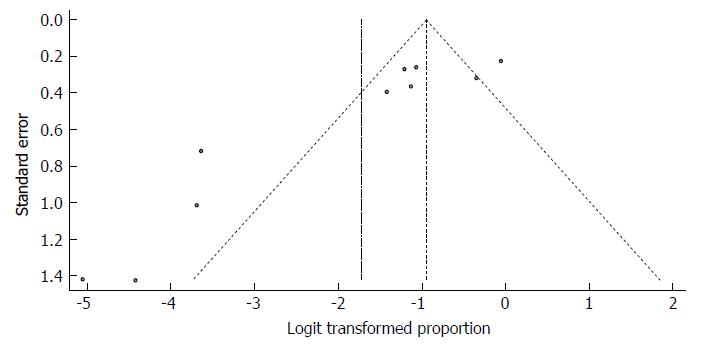
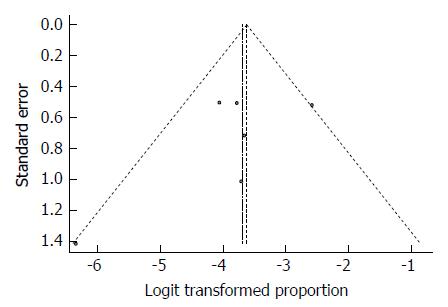
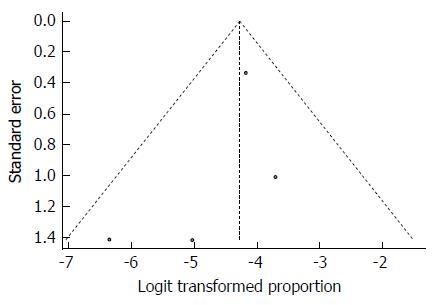
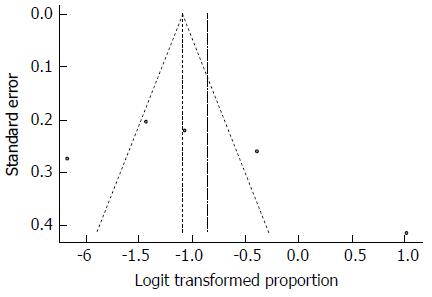
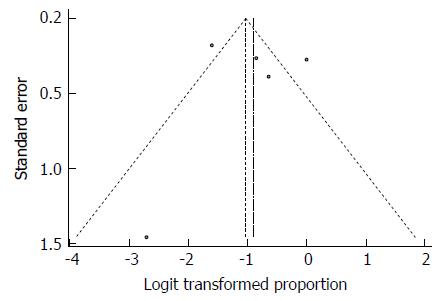
Figure 3 Bias assessment plot of studies reporting of hepatitis A virus prevalence in Somalia from 1984 to 1994.
Figure 4 Forest plot of hepatitis A virus prevalence rates for studies conducted in Somalia from 1984 to 1992.
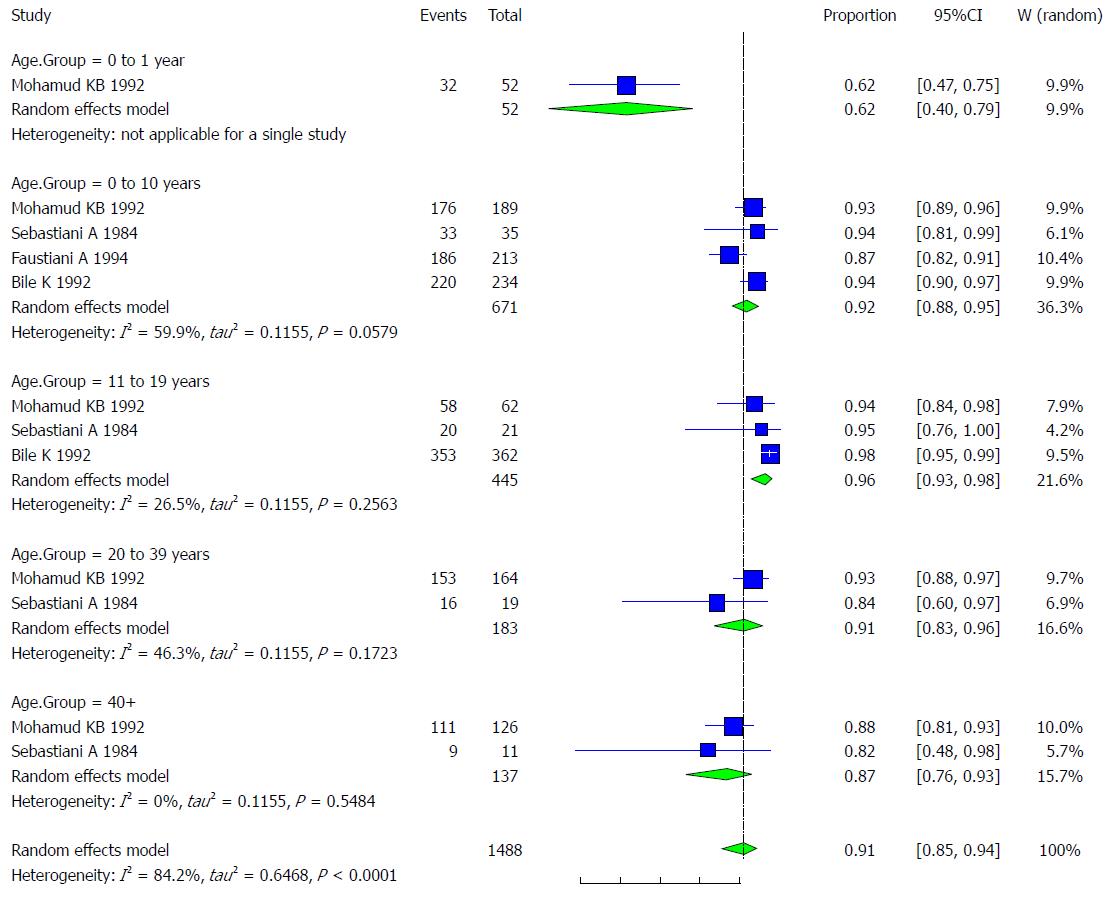
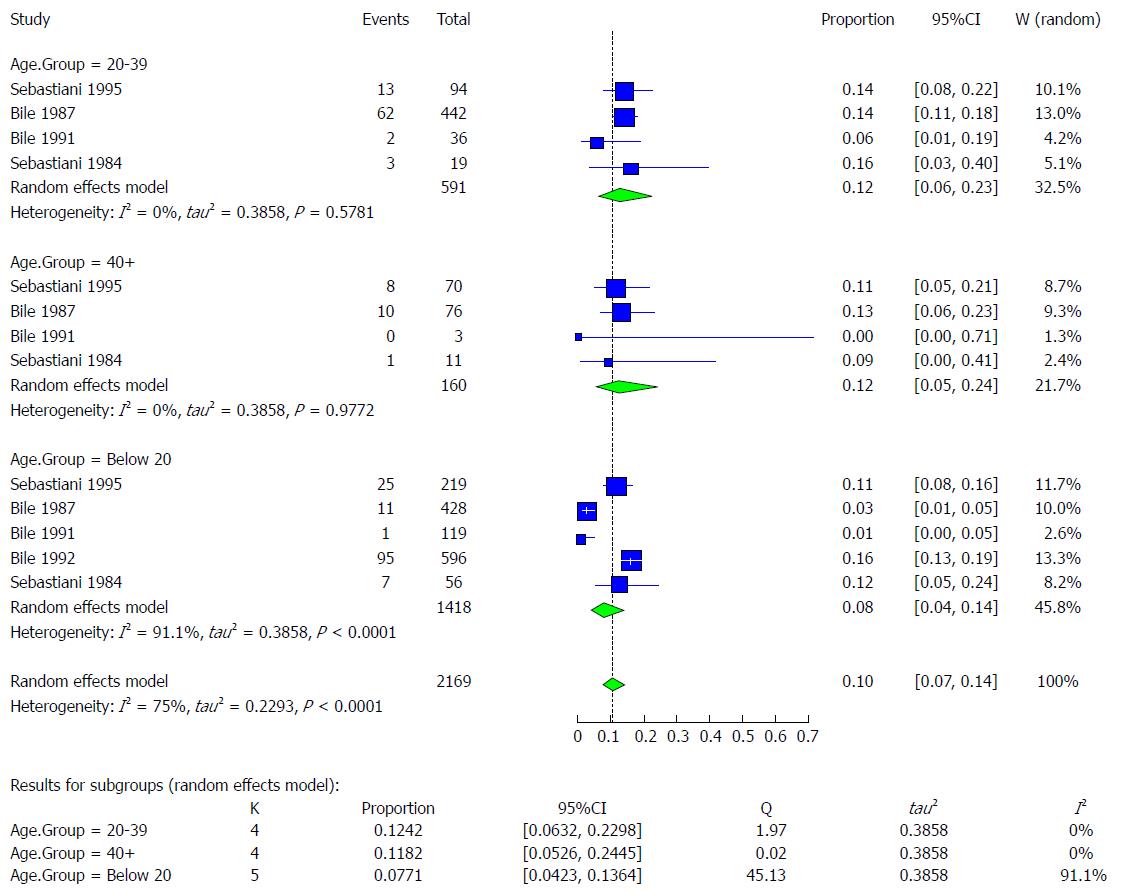
Figure 5 Forest plot of hepatitis A virus infection prevalence rates according to age groups from 1984 to 1994.
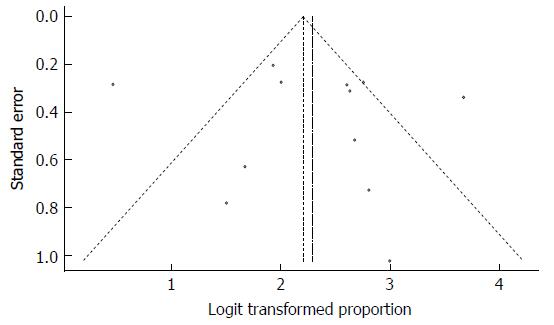
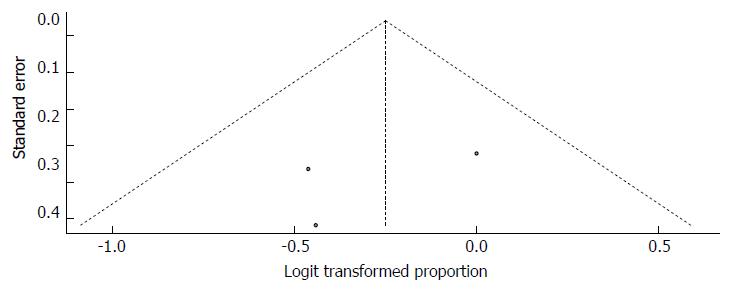
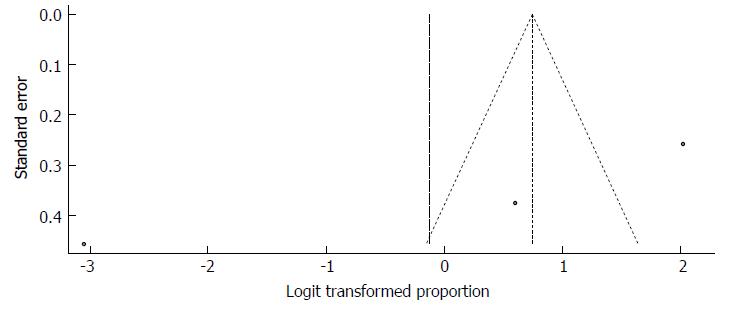
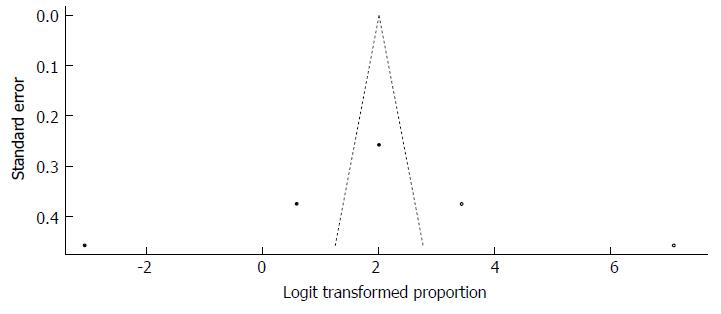
Figure 6 Bias assessment plot of studies reporting hepatitis A virus and age groups.
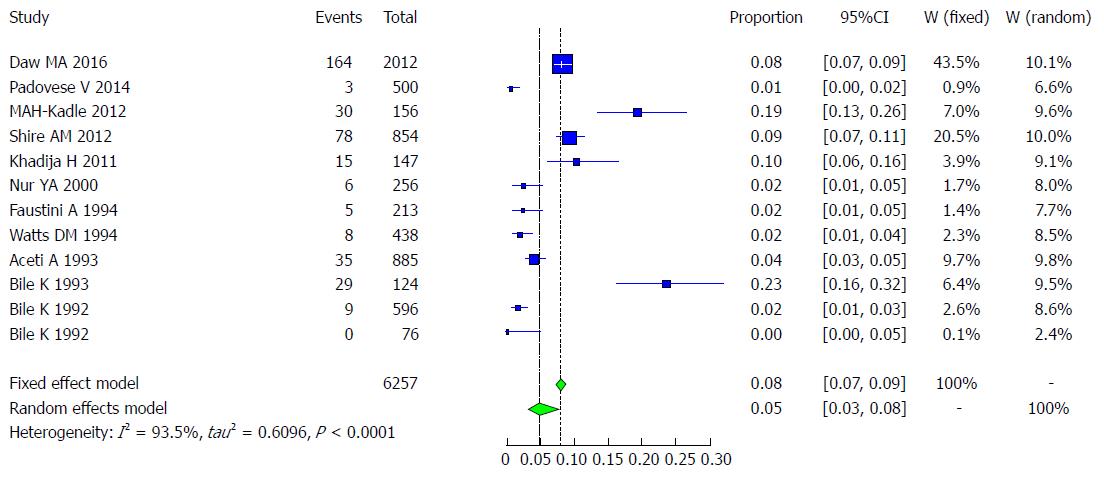
Figure 7 Forest plot of hepatitis B virus infection prevalence rates in Somalia in published and unpublished studies from 1977 to 2014.
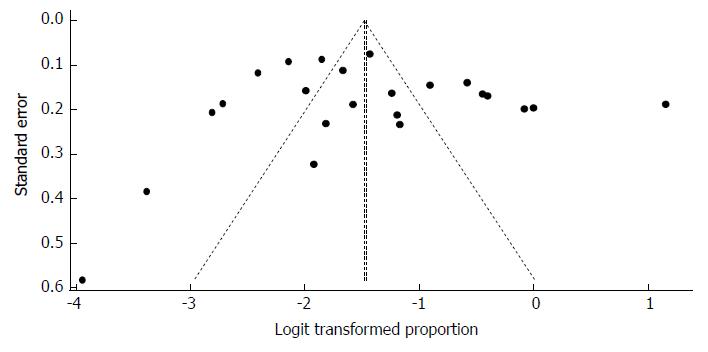
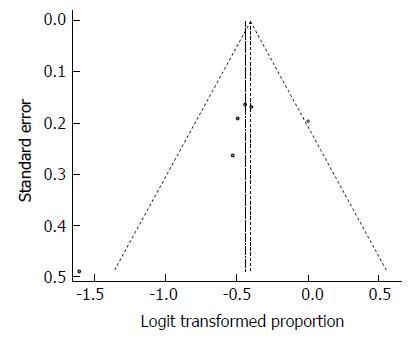
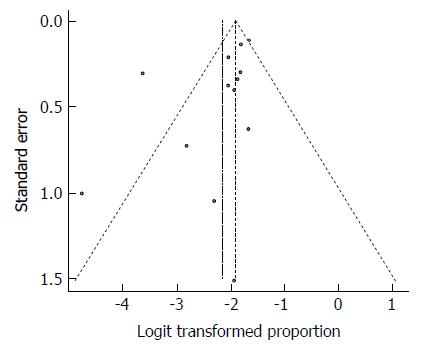
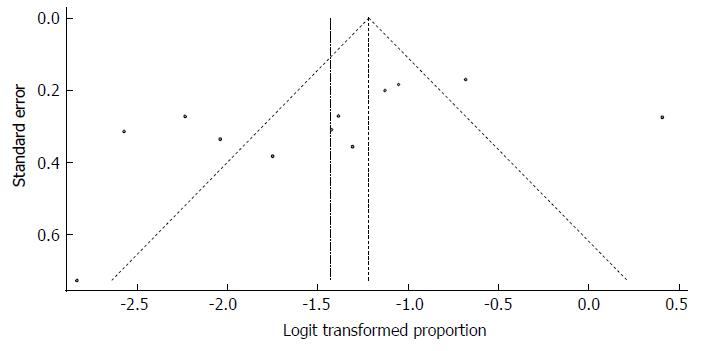
Figure 8 Bias assessment plot of studies reporting hepatitis B virus prevalence rate in Somalia from 1977 to 2014.
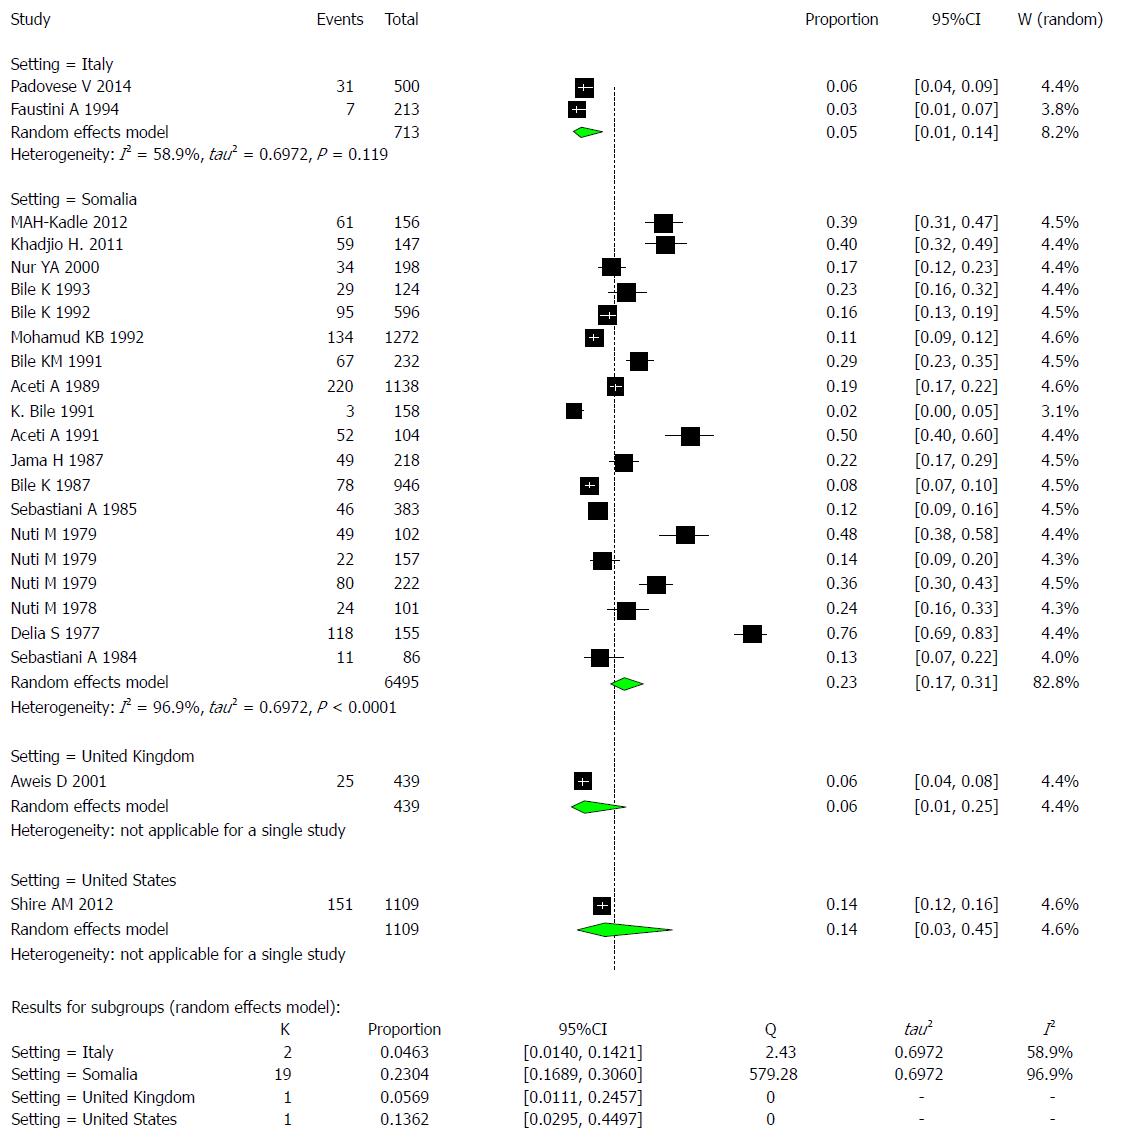
Figure 9 Forest plot of hepatitis B virus prevalence rates for studies conducted according to setting from 1977 to 2014.
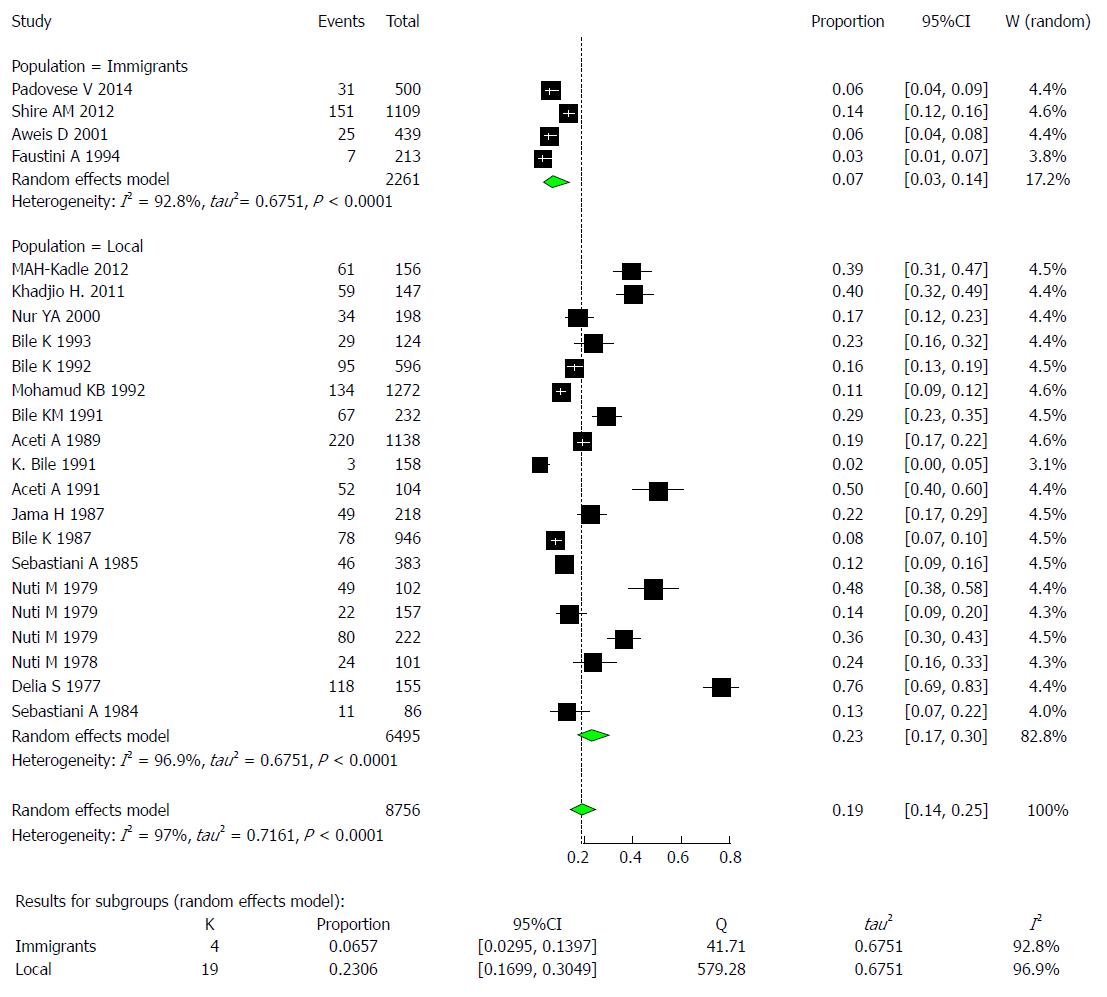
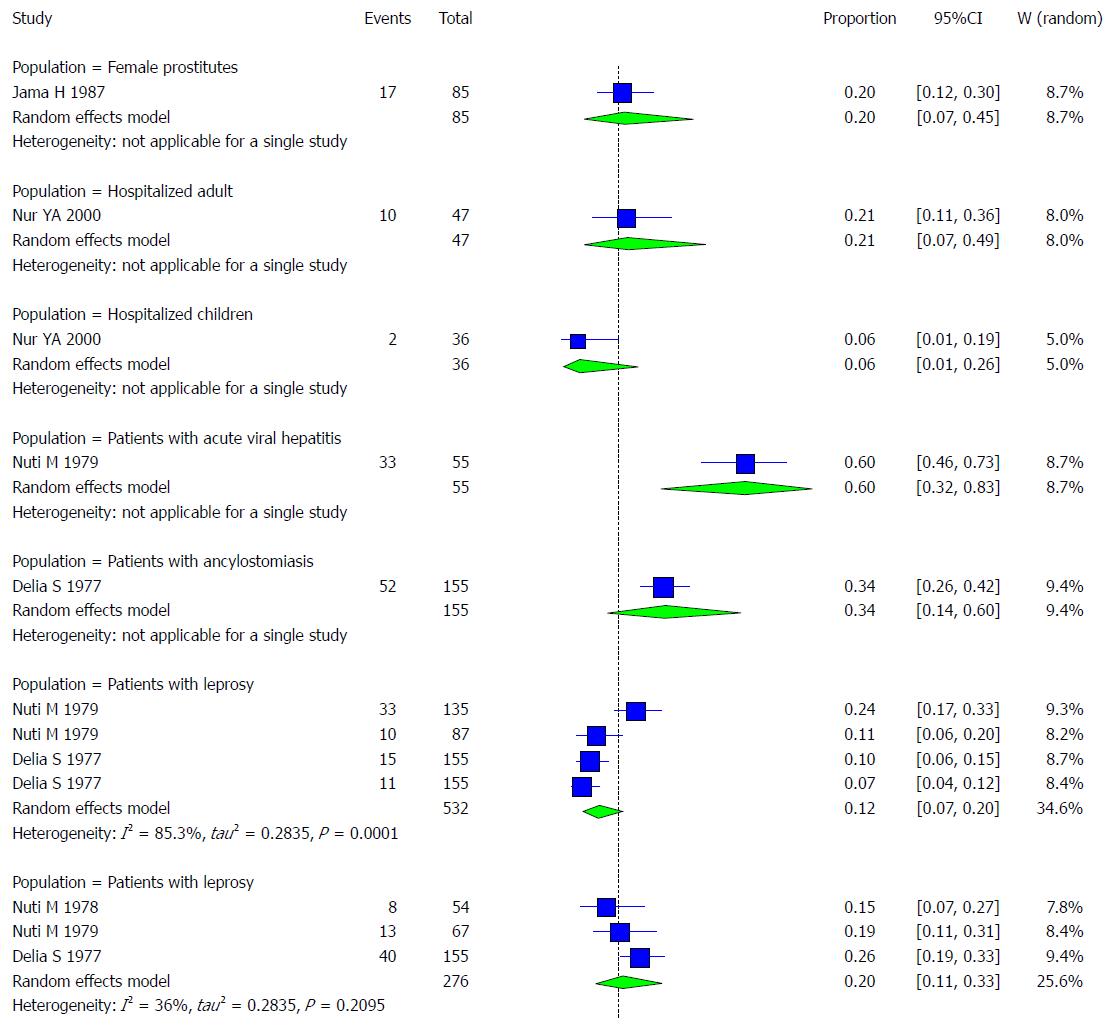
Figure 10 Forest plot of hepatitis B virus prevalence rates for studies conducted according to population from 1977 to 2014.
Figure 11 Forest plot of hepatitis B virus infection prevalence rates among pregnant women.
Figure 12 Forest plot of hepatitis B virus infection prevalence rates among Somali children.
Figure 13 Forest plot of hepatitis B virus infection prevalence rates among patients with chronic liver disease, including hepatocellular carcinoma.
Figure 14 Bias assessment plot of studies reporting among patients with chronic liver disease, including hepatocellular carcinoma.
Figure 15 Forest plot of hepatitis B virus infection prevalence rates among age groups.
Figure 16 Bias assessment plot of studies reporting among age groups.
Figure 17 Forest plot of hepatitis B virus infection prevalence rates among risk groups.
Figure 18 Bias assessment plot of studies reporting among risk groups.
Figure 19 Forest plot of studies reporting chronic hepatitis C virus infection prevalence in Somalia.
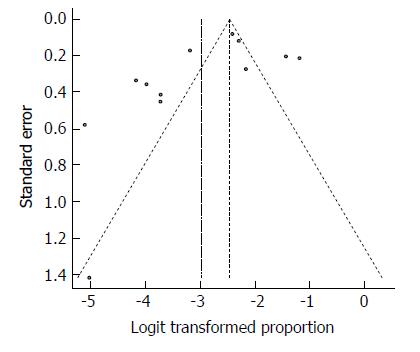
Figure 20 Funnel plot of studies reporting chronic hepatitis C virus infection prevalence in Somalia.
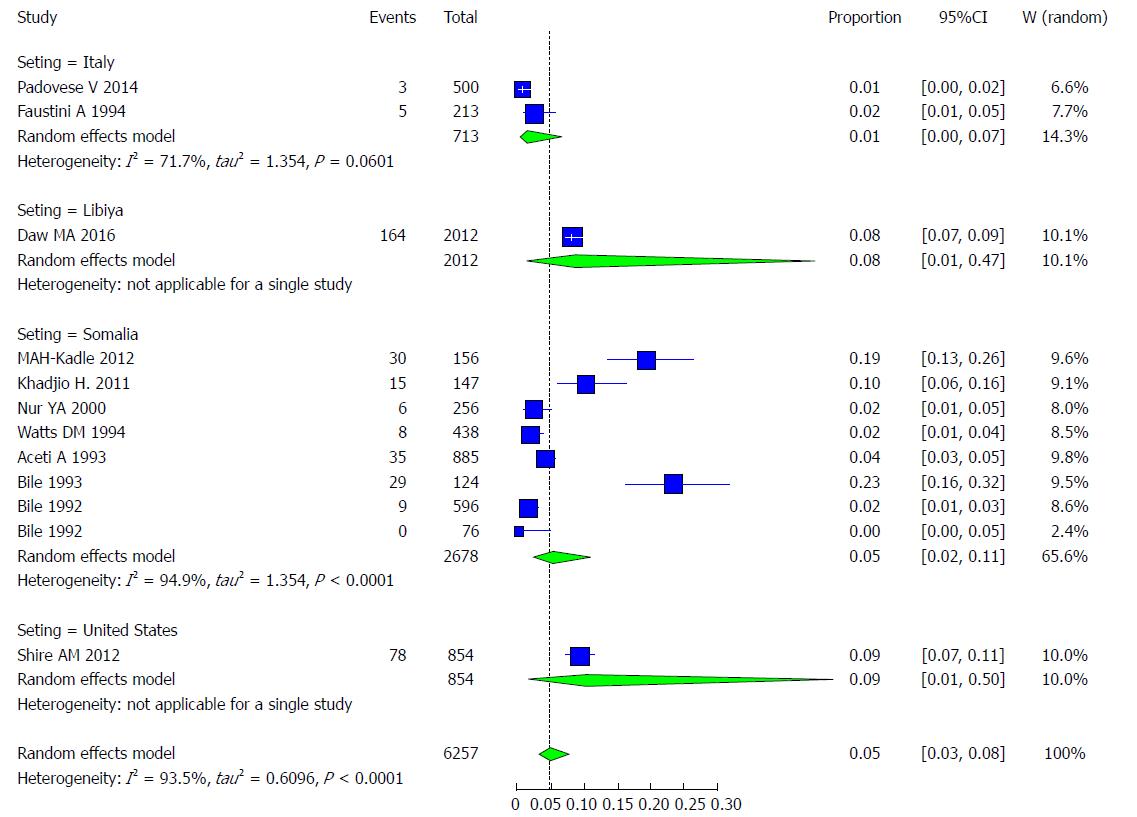
Figure 21 Forest plot of hepatitis C virus infection for studies conducted in Somalia and Outside of Somalia.
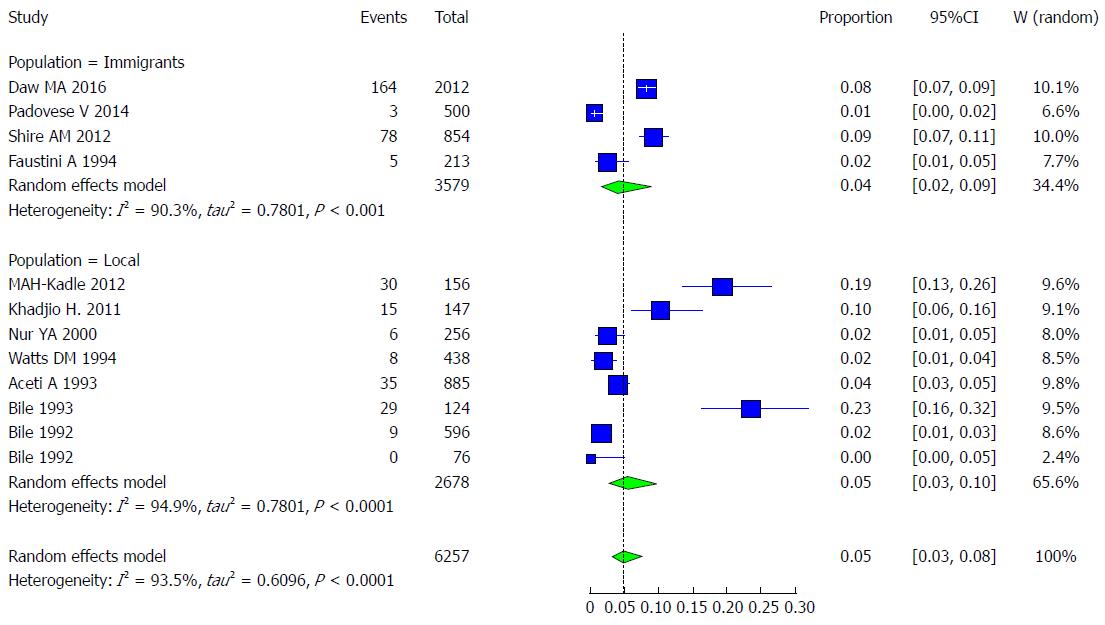
Figure 22 Forest plot of studies reporting chronic hepatitis C virus prevalence amongst the local population and Somali immigrants.
Figure 23 Forest plot of studies reporting chronic hepatitis C virus prevalence among blood donors in Somalia.
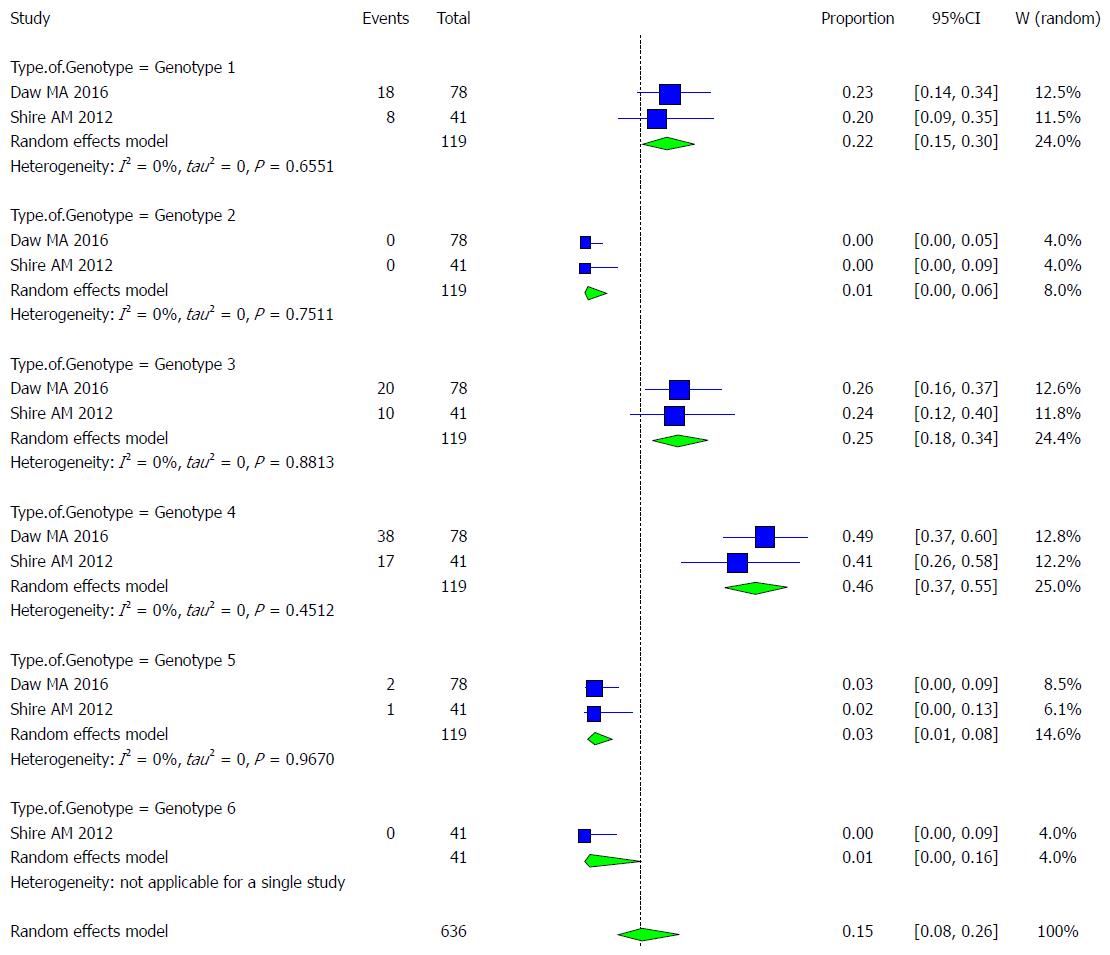
Figure 24 Forest plot of studies reporting on distribution genotypes of hepatitis C virus infection in Somalia.
Figure 25 Bias assessment plot of studies reporting among the distribution of genotypes of hepatitis C virus.
Figure 26 Forest plot of studies reporting chronic hepatitis C virus prevalence among risk groups in Somalia.
Figure 27 Bias assessment plot of studies reporting among risk groups in Somalia.
Figure 28 Forest plot of studies reporting chronic hepatitis C virus prevalence among Somali children.
Figure 29 Bias assessment plot of studies reporting among children in Somalia.
Figure 30 Forest plot of studies reporting chronic hepatitis C virus prevalence among patients with chronic liver disease, including hepatocellular carcinoma, in Somalia.
Figure 31 Bias assessment plot of studies reporting chronic liver disease.
Figure 32 Forest plot of studies reporting hepatitis D virus infection prevalence in Somalia.
Figure 33 Bias assessment plot of studies reporting of hepatitis D virus infection in Somalia.
Figure 34 Forest plot of hepatitis D virus infection prevalence rates among patients with chronic liver disease in Somalia.
Figure 35 Bias assessment plot of studies reporting of hepatitis D virus infection among chronic liver disease in Somalia.
Figure 36 Forest plot of studies reporting hepatitis E virus infection prevalence in Somalia.
Figure 37 Funnel plot of studies reporting hepatitis E virus infection prevalence in Somalia.
Figure 38 Bias assessment plot of studies reporting hepatitis E virus prevalence in Somalia.
- Citation: Hassan-Kadle MA, Osman MS, Ogurtsov PP. Epidemiology of viral hepatitis in Somalia: Systematic review and meta-analysis study. World J Gastroenterol 2018; 24(34): 3927-3957
- URL: https://www.wjgnet.com/1007-9327/full/v24/i34/3927.htm
- DOI: https://dx.doi.org/10.3748/wjg.v24.i34.3927


