Copyright
©The Author(s) 2018.
World J Gastroenterol. Sep 14, 2018; 24(34): 3871-3883
Published online Sep 14, 2018. doi: 10.3748/wjg.v24.i34.3871
Published online Sep 14, 2018. doi: 10.3748/wjg.v24.i34.3871
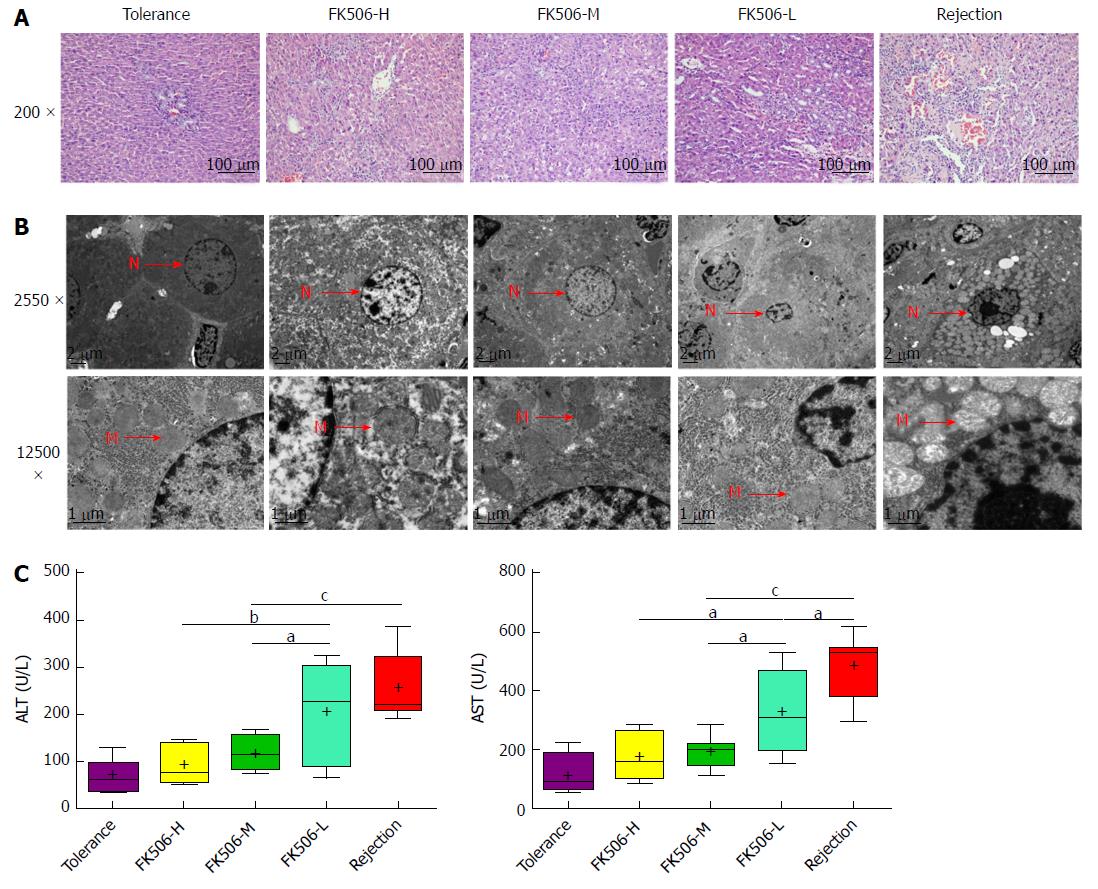
Figure 1 Middle dosage of FK506 is optimal for maintaining immunosuppression after liver transplantation.
A: Representative image of the hepatic graft pathological structure stained with hematoxylin and eosin (HE, 200 ×); B: Representative hepatocyte ultrastructure obtained via transmission electron microscopy (TEM, 2550 ×, 12500 ×); C: Assessment of hepatic graft function by plasma levels of alanine aminotransferase (ALT) and aspartate aminotransferase (AST) in different treatment groups. N: Cell nucleus; M: Mitochondria. aP < 0.05; bP < 0.01; cP < 0.001.
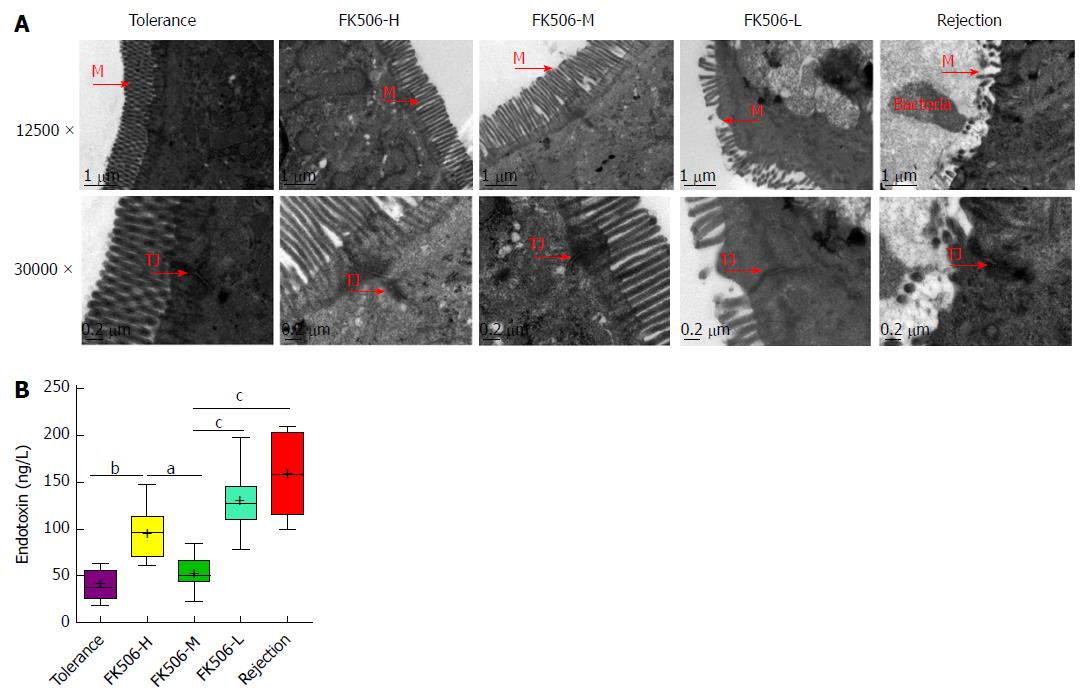
Figure 2 An optimal dosage of FK506 maintained the gut barrier and resulted in low endotoxin levels after liver transplantation.
A: Representative intestinal mucosal ultrastructure shown by transmission electron microscopy for the different treatment groups (12500 ×, 30000 ×); B: Levels of plasma endotoxins in the different groups. M: Microvilli; TJ: Tight junction. aP < 0.05; bP < 0.01; cP < 0.001.
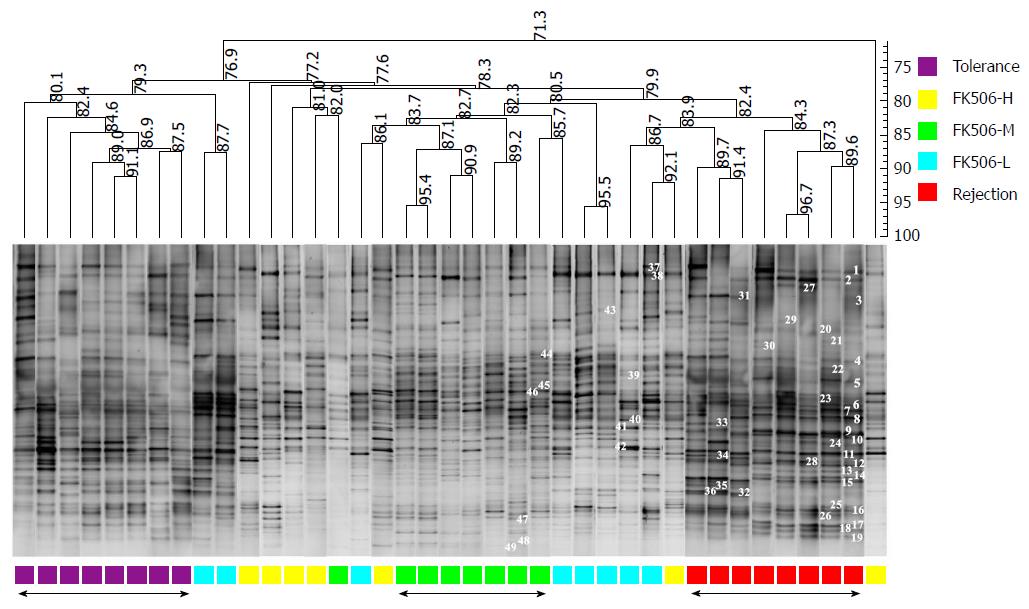
Figure 3 Optimal dosage of FK506 induced a stable gut microbiota as determined using denaturing gradient gel electrophoresis.
Based on the DGGE method, the composition and distribution of ileocecal bacterial communities from samples was obtained in rats following LT. The Dice similarity coefficient (band-based) and unweighted pair-group method with arithmetic means (UPGMA) as a cluster method were utilized to analyze the similarity of each band in the different groups. Metric scale denotes the degree of similarity. Each band represents a bacterial clone. Band numbers indicate the position of bands excised for sequence analyses. DGGE: Denaturing gradient gel electrophoresis.
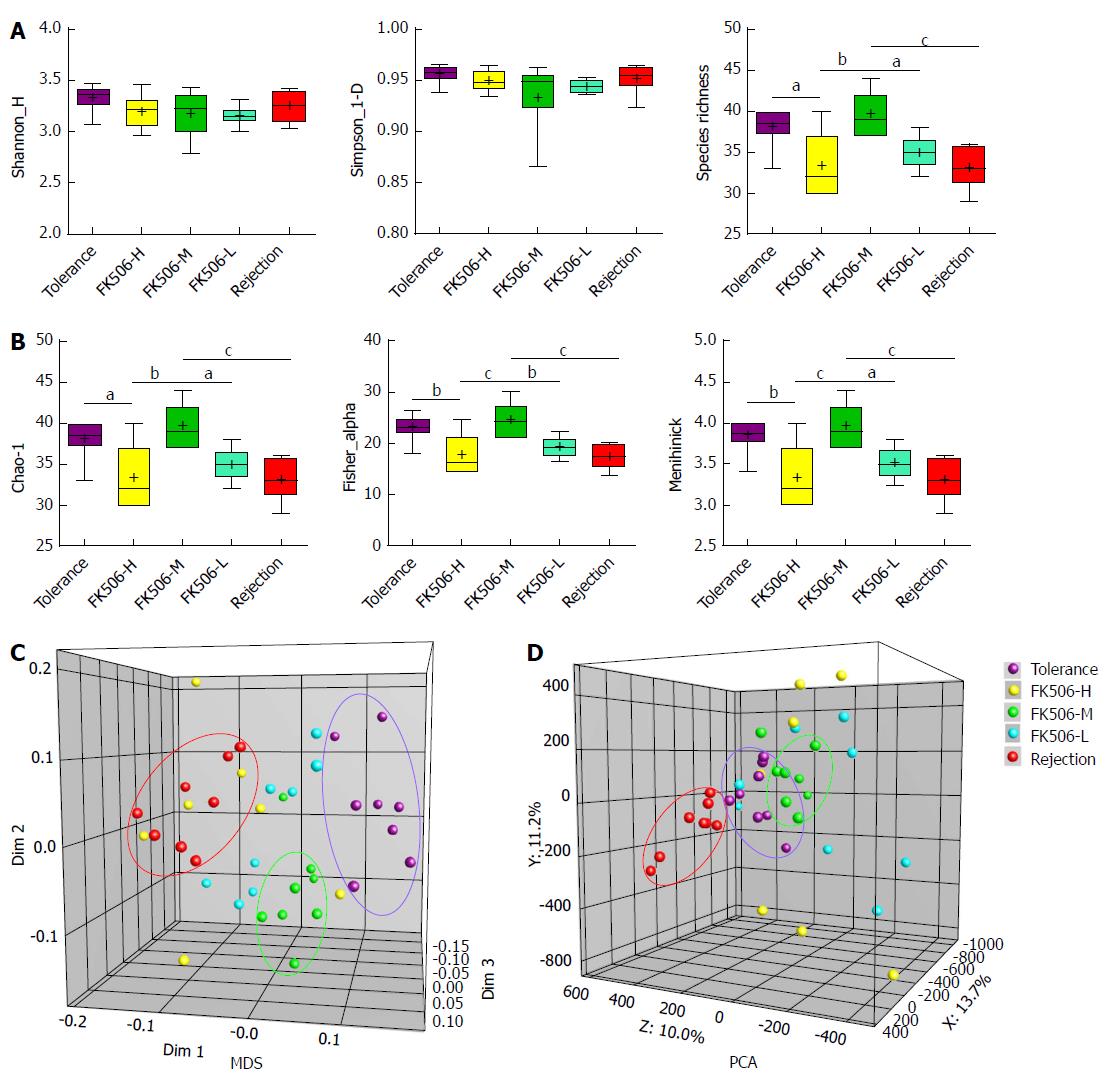
Figure 4 Diversity analysis and cluster analysis of denaturing gradient gel electrophoresis profiles based on Dice’s coefficient and the unweighted pair-group method with arithmetic means method.
A: Based on amount of gray area of each band of each lane in the denaturing gradient gel electrophoresis (DGGE) profiles quantified using the Gel-Pro analyzer, the gut microbial diversity and species richness were assessed with the Shannon index and Simpson index in the different groups; B: The abundance and distribution of the rare species were estimated using the Chao-1 index, Fisher alpha index, and Menhinick index in the different groups; C: Multidimensional scaling (MDS) analysis of each sample of the DGGE profiles. The plot is an optimized three-dimensional representation of the similarity matrix obtained from BioNumerics software. The Euclidean distance between the two points reflects similarity; D: Principal components analysis (PCA) of fecal microbiota based on DGGE fingerprinting. The plot is orientated to maximize the variation among lanes along the first three principal components (with contributions of 13.7, 11.2 and 10.0, respectively) obtained from BioNumerics software. aP < 0.05; bP < 0.01; cP < 0.001.
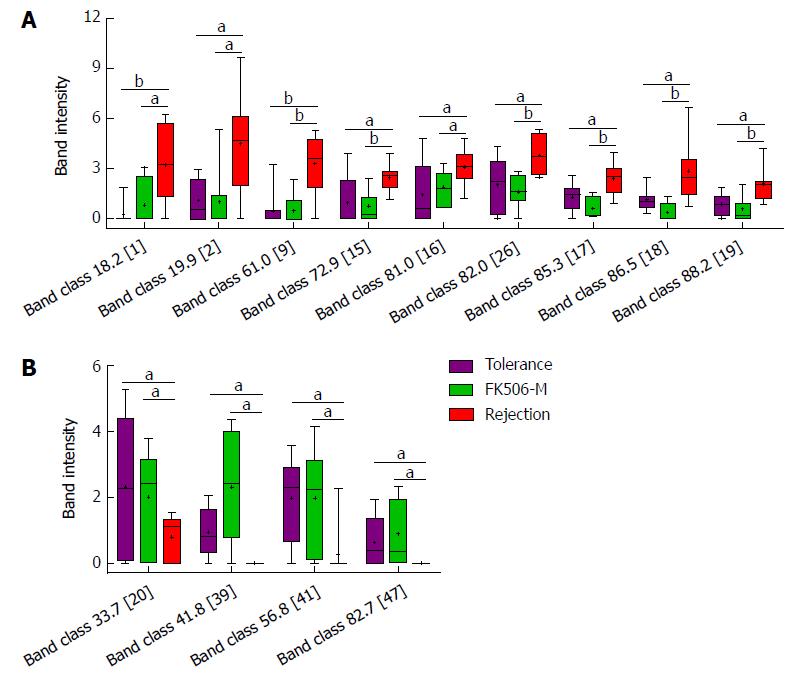
Figure 5 Identification of crucial bands of gut microbial changes induced by middle dosage tacrolimus treatment.
A: Compared to the rejection group, the intensities of nine band classes including 18.2 (band 1), 19.9 (band 2), 61.0 (band 9), 72.9 (band 15), 81.0 (band 16), 82.0 (band 26), 85.3 (band 17), 86.5 (band 18), and 88.2 (band 19), were significantly decreased in the FK506-M-treated and tolerance groups; B: Compared with the rejection group, four band classes, including 33.7 (band 20), 41.8 (band 39), 56.8 (band 41), and 82.7 (band 47), showed increased intensities in the FK506-M-treated and tolerance groups. aP < 0.05, bP < 0.01.
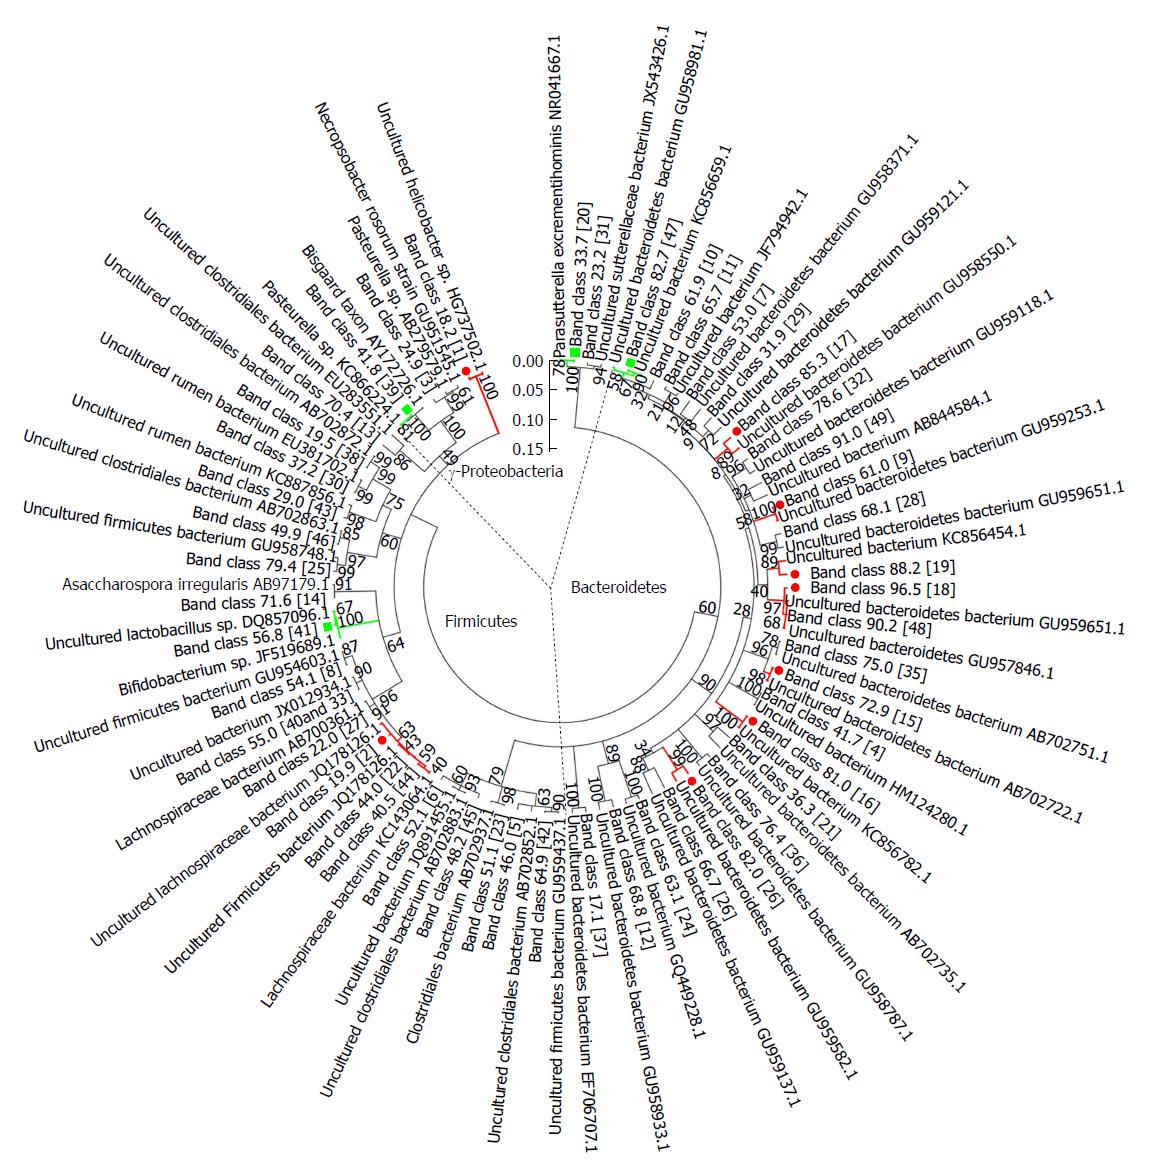
Figure 6 Phylogenetic tree analysis of sequences in the denaturing gradient gel electrophoresis profiles.
Phylogenetic tree analysis of sequences from denaturing gradient gel electrophoresis (DGGE) profiles using the neighbor-joining method was conducted using MEGA 5 software. Almost all matched bacteria of the 48 DGGE band classes were assigned to three phyla: Bacteroidetes (50.0%), Firmicutes (39.6%), and Gammaproteobacteria (10.4%). The fragment sequences were defined according to their positions in gels using the band-matching tool with BioNumerics software version 6.01 (Applied Maths). The numbers in the brackets were consistent with the numbers shown in DGGE profiling. Nine band classes (labeled with a red dot) were decreased and four band classes (labeled with the green square) were higher in the FK506-M group than the rejection group. The plot was obtained using MEGA5 software (http://en.wikipedia.org/wiki/MEGA,_Molecular_Evolutionary_Genetics_Analysis).
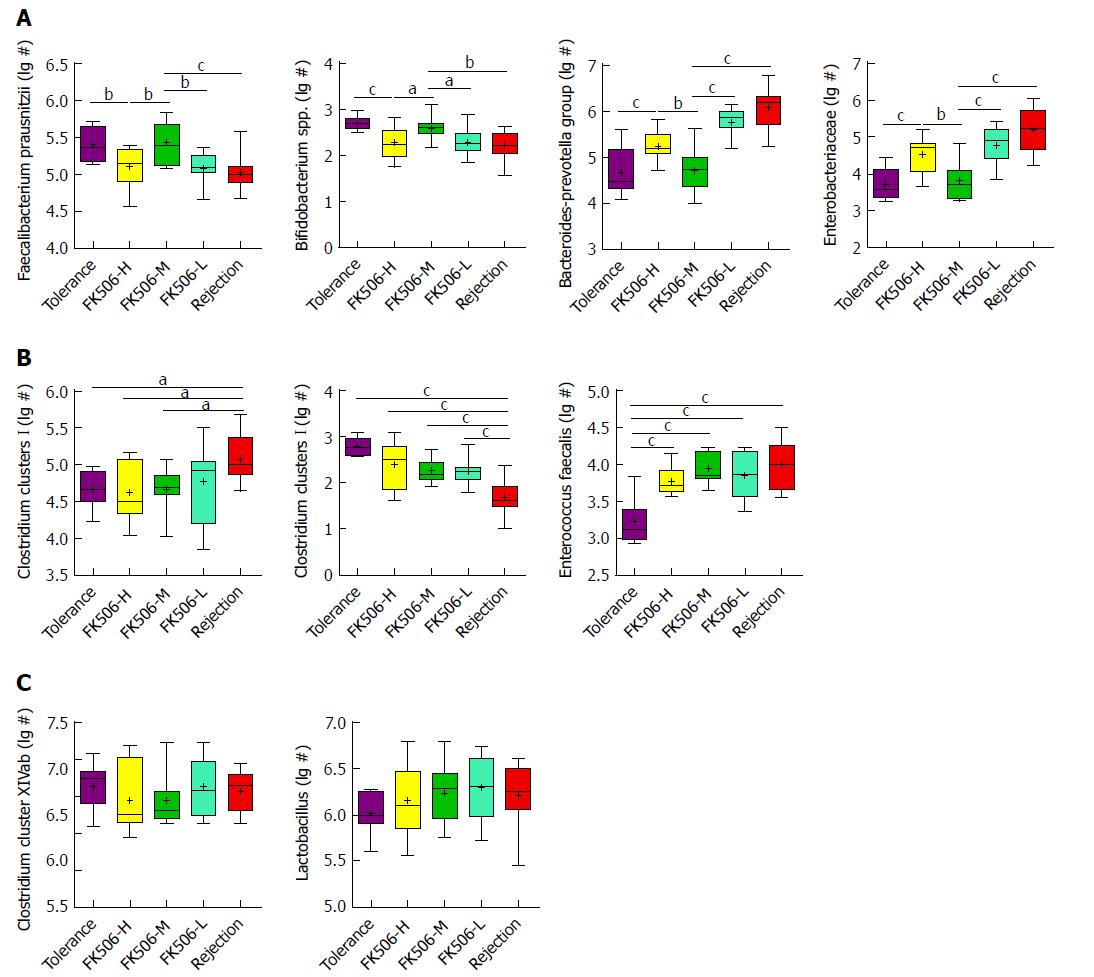
Figure 7 Quantitative verification of predominant bacterial community in fecal microbiota using RT-qPCR.
Gut dominant bacterial populations were analyzed with RT-qPCR for the different groups. The dominant bacteria mainly included Faecalibacterium prausnitzii, Bifidobacterium spp., Bacteroides-Prevotella group, Enterobacteriaceae, Clostridium clusters I, Clostridium clusters XI, Enterococcus faecalis, Clostridium cluster XIVab, Lactobacillus. Statistical analysis was performed with one-way ANOVA. aP < 0.05, bP < 0.01, cP < 0.001. 1Log10 copies/g: log10 No. of 16S rDNA gene copies per gram feces (wet weight).
- Citation: Jiang JW, Ren ZG, Lu HF, Zhang H, Li A, Cui GY, Jia JJ, Xie HY, Chen XH, He Y, Jiang L, Li LJ. Optimal immunosuppressor induces stable gut microbiota after liver transplantation. World J Gastroenterol 2018; 24(34): 3871-3883
- URL: https://www.wjgnet.com/1007-9327/full/v24/i34/3871.htm
- DOI: https://dx.doi.org/10.3748/wjg.v24.i34.3871


