Copyright
©The Author(s) 2018.
World J Gastroenterol. Jan 21, 2018; 24(3): 371-378
Published online Jan 21, 2018. doi: 10.3748/wjg.v24.i3.371
Published online Jan 21, 2018. doi: 10.3748/wjg.v24.i3.371
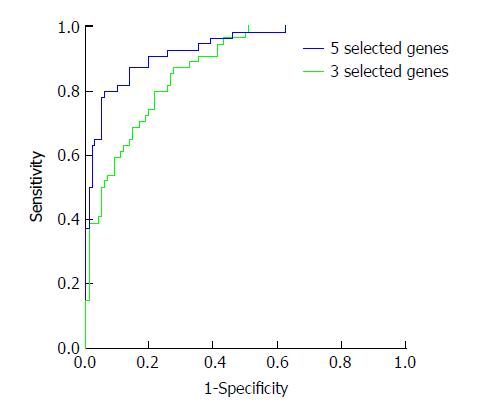
Figure 1 Receiver operating characteristic analysis of probability after logistic regression analysis.
In the total nine genes, five (ANXA1, FOS, SPAG9, CXCR4, and PFN1) entered the diagnostic formula. In the four genes, three (ANXA1, SPAG9, and PFN1) entered the formula. The probability was used for ROC analysis. The AUC of the five selected genes was 0.933 and that of the three selected genes was 0.878, indicating that the five selected genes had better diagnostic value, and the sensitivity and specificity were 94% and 80%, respectively.
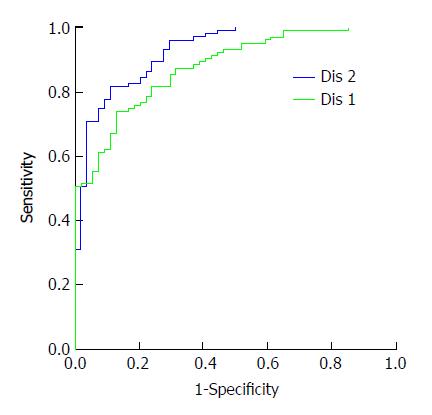
Figure 2 Receiver operating characteristic analysis of probability after discriminant analysis.
In the total nine genes, GPC3, ANXA1, FOS, SPAG9, CXCR4, and PFN1 genes entered the diagnosis formula. In the four genes, ANXA1, SPAG9, and PFN1 genes entered the formula. The probability was used for HCC detection. The AUC of the six selected genes was 0.926 and that of the three selected genes was 0.877. When the cutoff of the five selected genes was 0.628, the sensitivity and specificity were 82% and 89%, respectively.
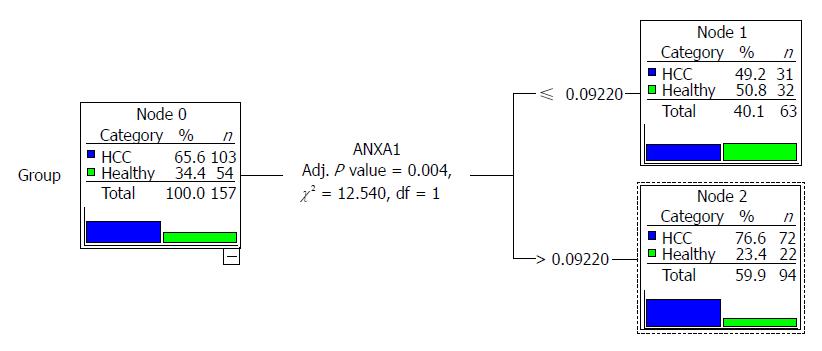
Figure 3 Classification tree of the total nine genes and the four genes.
The tree of the total nine genes was the same to that of the four genes. Only ANXA1 gene entered the tree, and according to the node, it was divided into two parts.
- Citation: Xie H, Xue YQ, Liu P, Zhang PJ, Tian ST, Yang Z, Guo Z, Wang HM. Multi-parameter gene expression profiling of peripheral blood for early detection of hepatocellular carcinoma. World J Gastroenterol 2018; 24(3): 371-378
- URL: https://www.wjgnet.com/1007-9327/full/v24/i3/371.htm
- DOI: https://dx.doi.org/10.3748/wjg.v24.i3.371


