Copyright
©The Author(s) 2018.
World J Gastroenterol. Aug 7, 2018; 24(29): 3260-3272
Published online Aug 7, 2018. doi: 10.3748/wjg.v24.i29.3260
Published online Aug 7, 2018. doi: 10.3748/wjg.v24.i29.3260
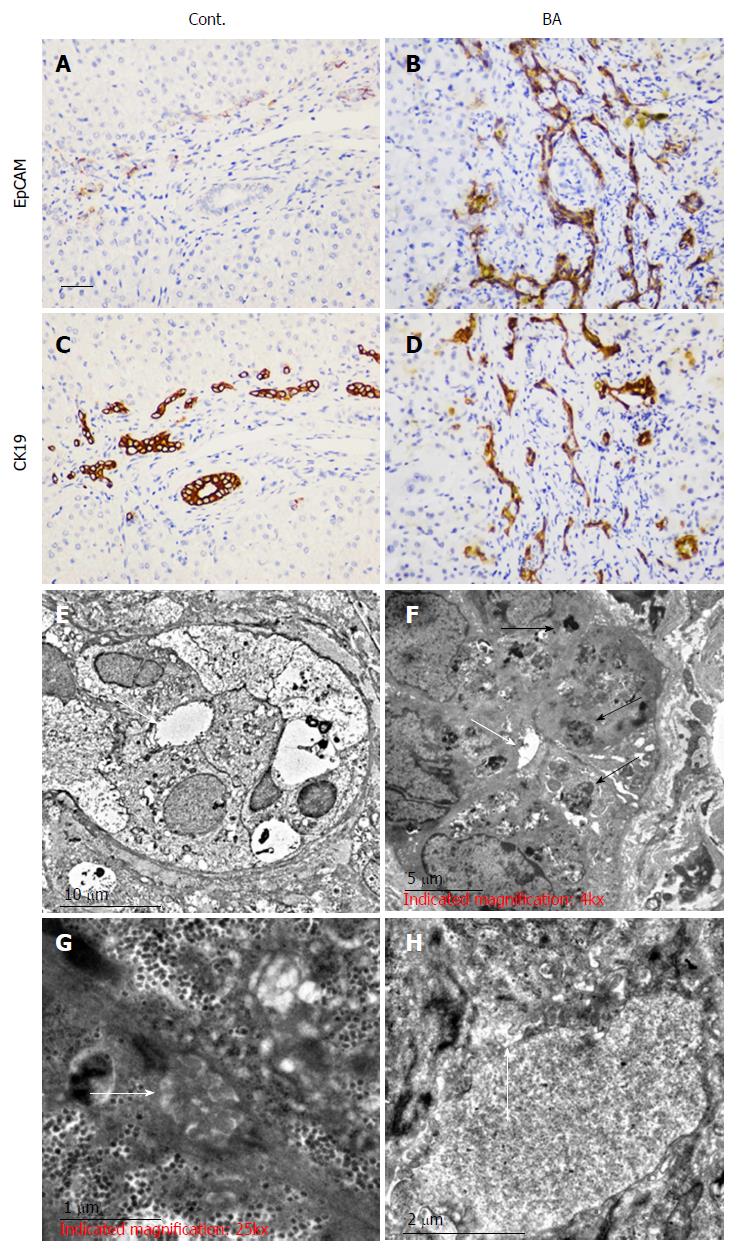
Figure 1 Expression levels of EpCAM and CK19 in neonatal liver biopsies and electron microscopy analysis of hepatic ultrastructure.
To test the biliary epithelial marker expression levels, immunohistochemical staining was performed on disease control samples (Cont., choledochal cyst, A and C) and biliary atresia patient samples (BA, B and D). For the colocalization study of EpCAM and CK19, adjacent tissue sections were used. The scale bar is shown as 50 μm. For the EM analysis, liver tissues from the Cont. (E and F) and BA patients (G and H) were sectioned at 50-70 nm and stained with uranyl acetate and lead citrate. Photographs of the bile capillary (E and G) and microvilli (F and H) were captured and presented. The scale bar is also shown in the photographs. n = 5 each for the CC and BA groups.
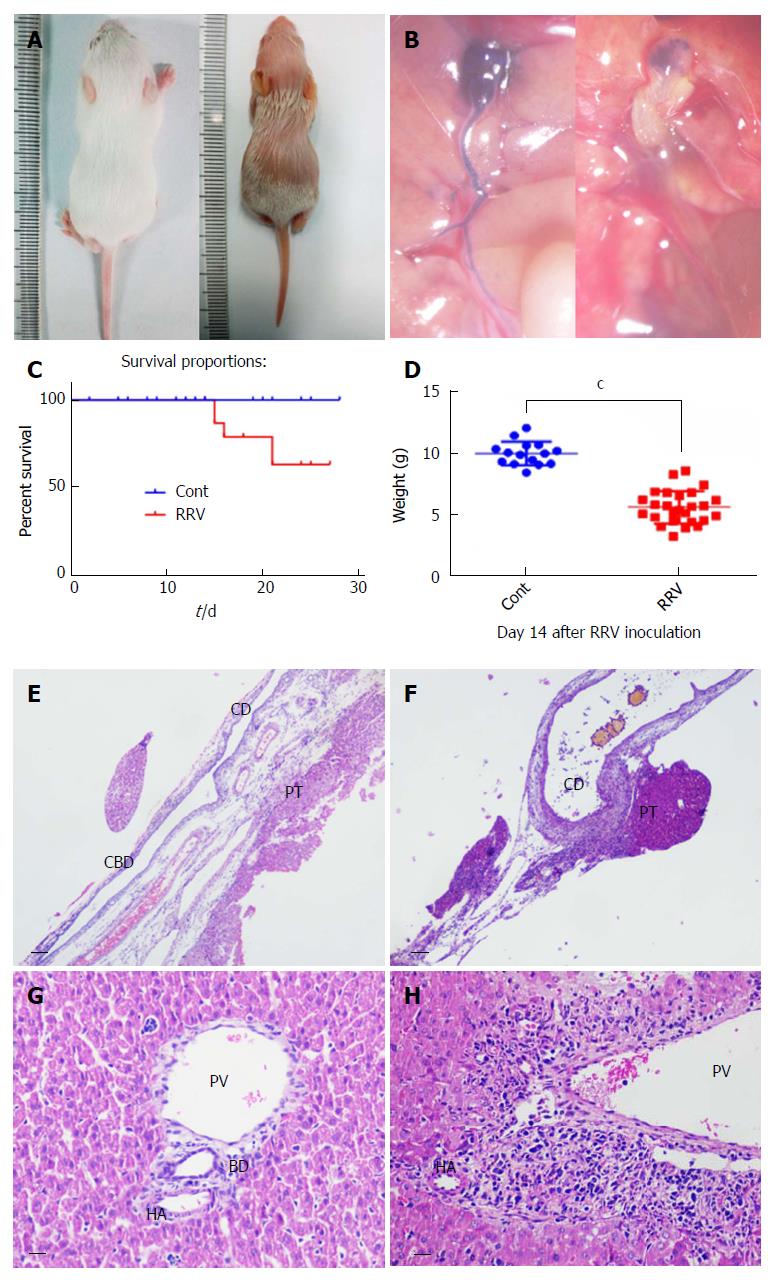
Figure 2 Biliary atresia in neonatal mice with a low dose of rhesus rotavirus inoculation.
To study the expression levels of the components of the Notch signaling pathway in the biliary atresia (BA) animal model, a lower dose of 20 μL of rhesus rotavirus (RRV) with a titer of 4 × 10⁴ PFU/mL was used. The morphology and extrahepatic block were photographed (A and B). The survival rate was measured at 21 d after viral inoculation (C). BA syndrome was observed between days 5 and 6. The body weights of the mice were measured at day 14 and compared with that of the control group (injected with culture supernatant but no virus) (D) (P < 0.001, n = 15 in the Cont. group, and n = 26 in the RRV group). After dissection, the portal triad (E and F) and liver tissue at day 14 (G and H) were sectioned, and histological analysis was performed. The scale bar is shown as 0.2 mm in the portal triad sections and as 50 μm in the liver tissue sections. CD: Cystic duct; CBD: Common bile duct; PT: Portal triad; PV: Portal vein; HA: Hepatic artery; BD: Bile duct.
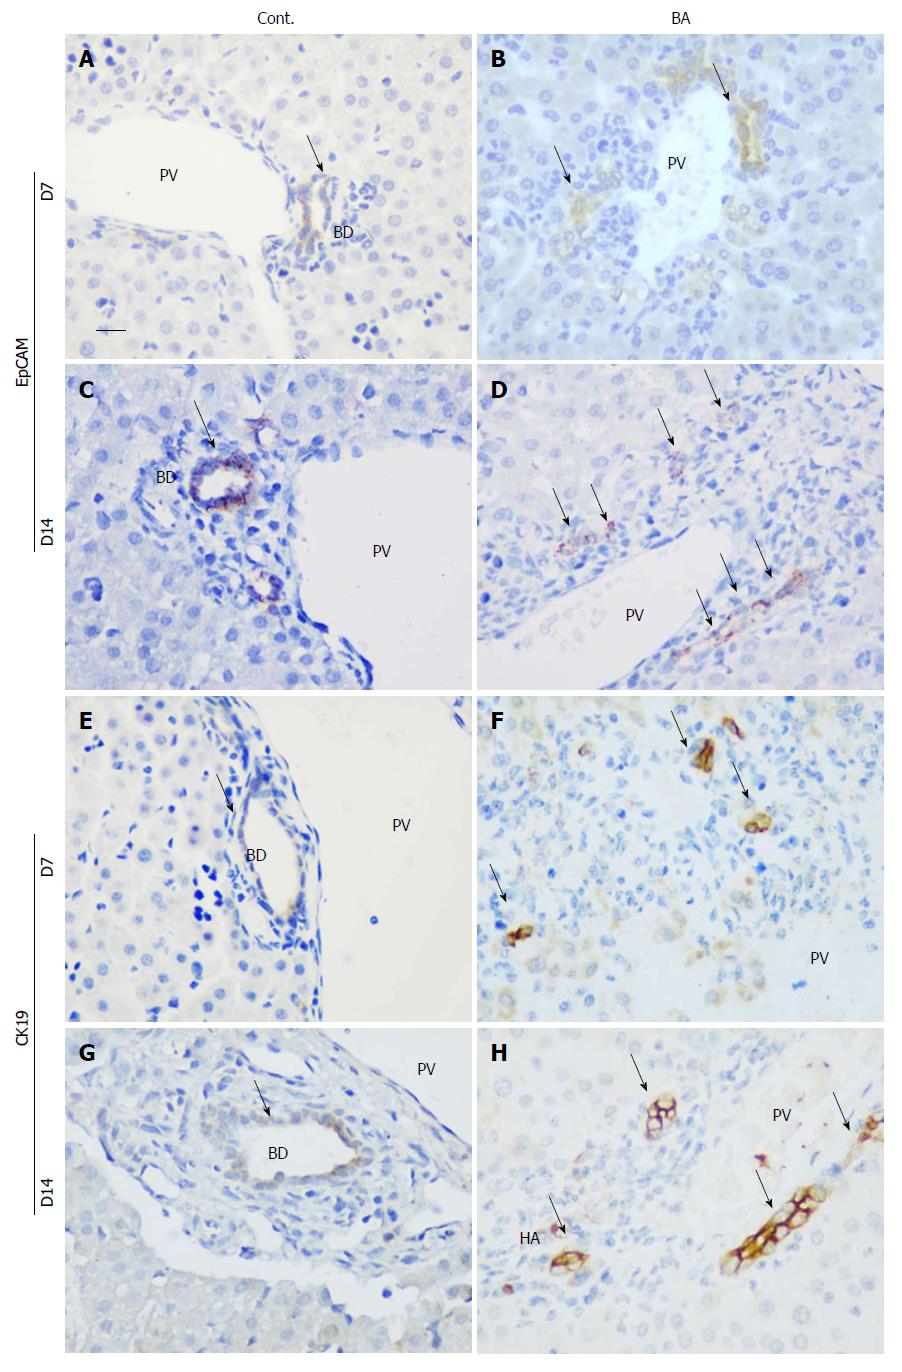
Figure 3 Expression levels of EpCAM and CK19 in the liver and ultrastructure of biliary epithelial cells.
The expression levels of EpCAM and CK19 were analyzed using immunohistochemical staining with antibodies. The tissue sections were collected at day 7 (A, B, E and F) and day 14 (C, D, G and H). After they were dewaxed, the sections were stained with EpCAM and CK19 antibodies, and a comparison of the mice in the control group (Cont.) and those in the rhesus rotavirus inoculation group was performed. The scale bar shown is 100 μm. The black arrow indicates the positive signal. BA: Biliary atresia; CD: Cystic duct; CBD: Common bile duct; PT: Portal triad; PV: Portal vein; HA: Hepatic artery; BD: Bile duct.
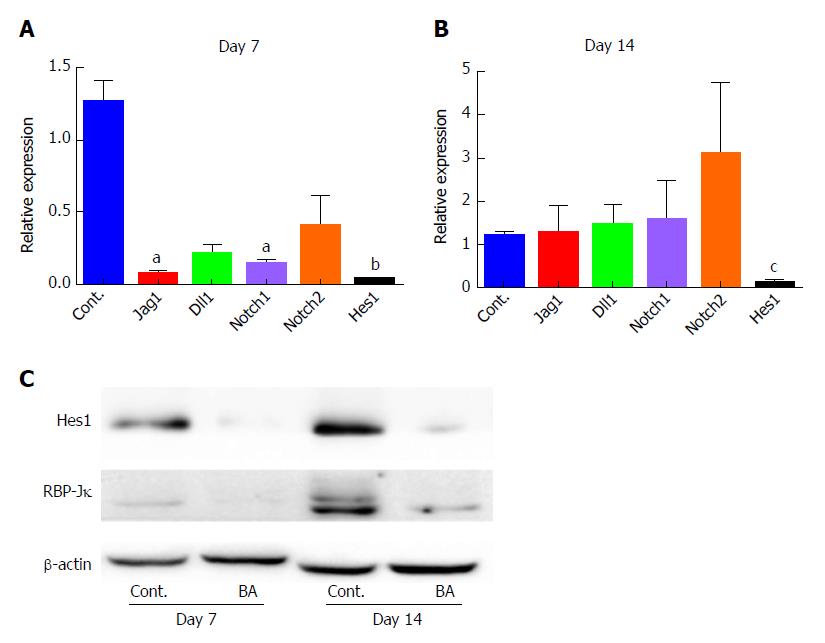
Figure 4 Expression levels of Notch signaling components in the liver of rhesus rotavirus-inoculated mice.
The mRNA levels of Notch signaling components, including Jag1, Dll1, Notch1, Notch2 and Hes1, were detected using quantitative real-time PCR with appropriate primers at day 7 and day 14 after RRV inoculation. A: The relative expression levels compared with the normal control are shown for day 7 (aP < 0.05; bP < 0.01; n = 6 in the control group and n = 10 in the RRV group); B: day 14 (cP < 0.001); C: The levels of the Hes1 protein and the expression of the transcriptional coregulator RBP-Jκ were detected by Western blot (n = 2 or 3 in each group; the proteins were mixed and loaded).
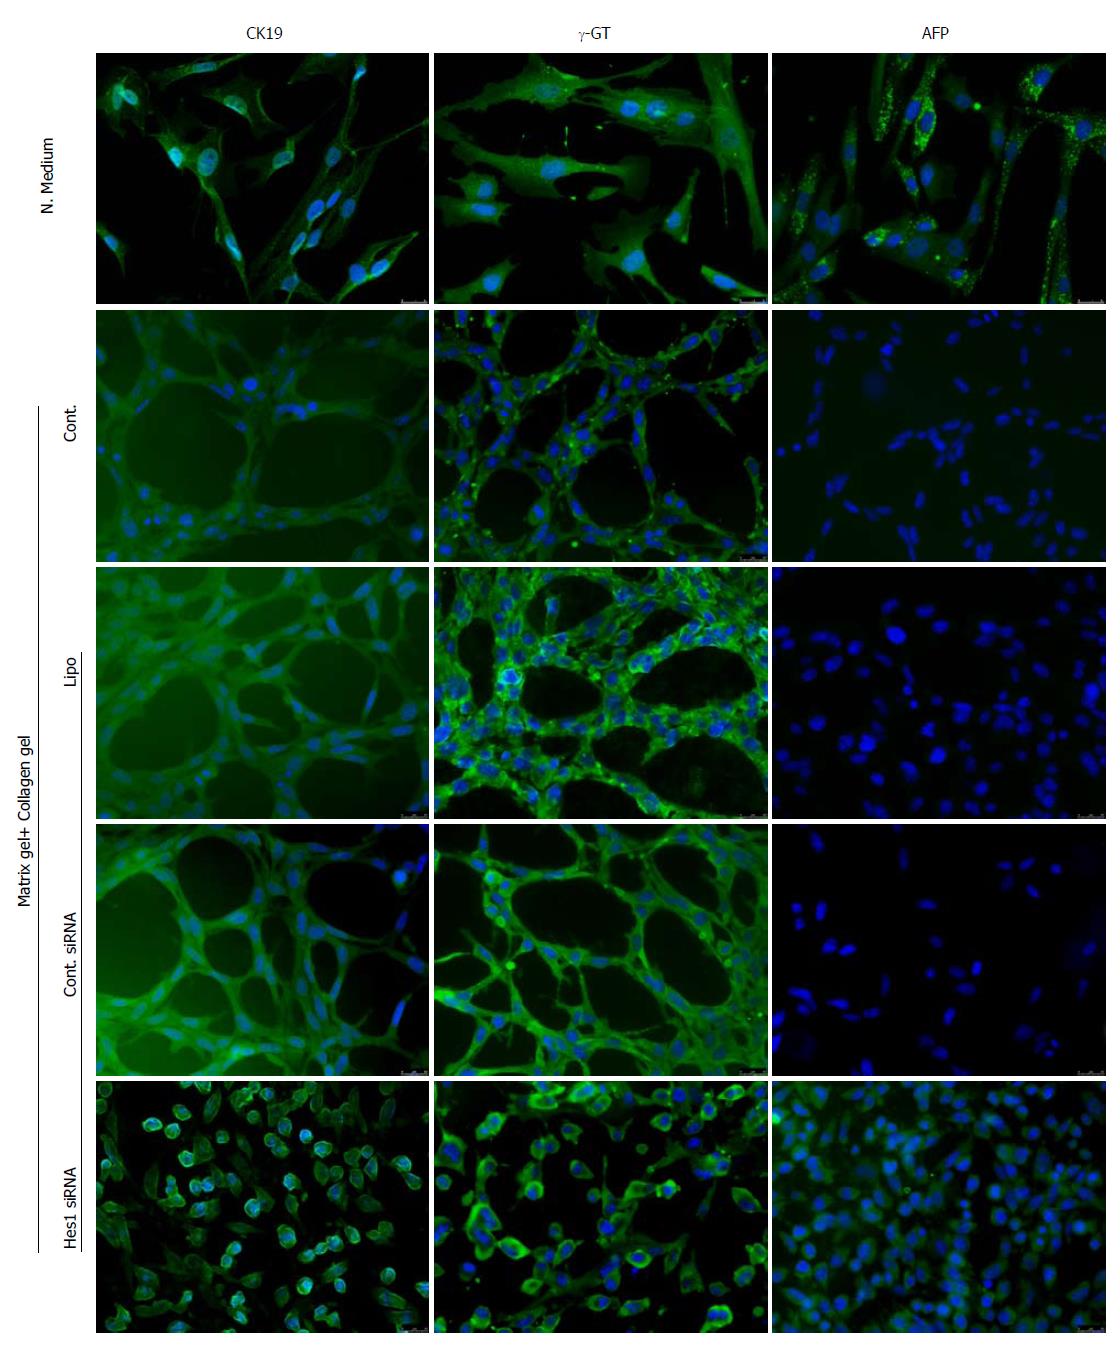
Figure 5 Hes1 siRNA in 3D biliary epithelial cell culture.
Biliary epithelial cells (BECs) were cultured in either normal growth medium (N. medium) or in matrix + collagen mixed gel (detailed components are given in the Materials and Methods section). The cells were cultured without a transfection reagent (Cont.), with Lipofectamine (Lipo) only, with irrelevant control siRNA (Cont. siRNA) or with Hes1 siRNA for seven days, then fixed and stained with anti-CK19, γ-GT and AFP antibodies, and finally counter-stained with Alexa Fluor®488. Photographs of the cells were taken with a Leica DMi8 inverted fluorescence microscope, and the groups were then compared. The experiment was duplicated, and one set of representative results is shown here.
- Citation: Zhang RZ, Zeng XH, Lin ZF, Ming-Fu, Tong YL, Lui VC, Tam PK, Lamb JR, Xia HM, Chen Y. Downregulation of Hes1 expression in experimental biliary atresia and its effects on bile duct structure. World J Gastroenterol 2018; 24(29): 3260-3272
- URL: https://www.wjgnet.com/1007-9327/full/v24/i29/3260.htm
- DOI: https://dx.doi.org/10.3748/wjg.v24.i29.3260


