Copyright
©The Author(s) 2018.
World J Gastroenterol. Aug 7, 2018; 24(29): 3239-3249
Published online Aug 7, 2018. doi: 10.3748/wjg.v24.i29.3239
Published online Aug 7, 2018. doi: 10.3748/wjg.v24.i29.3239
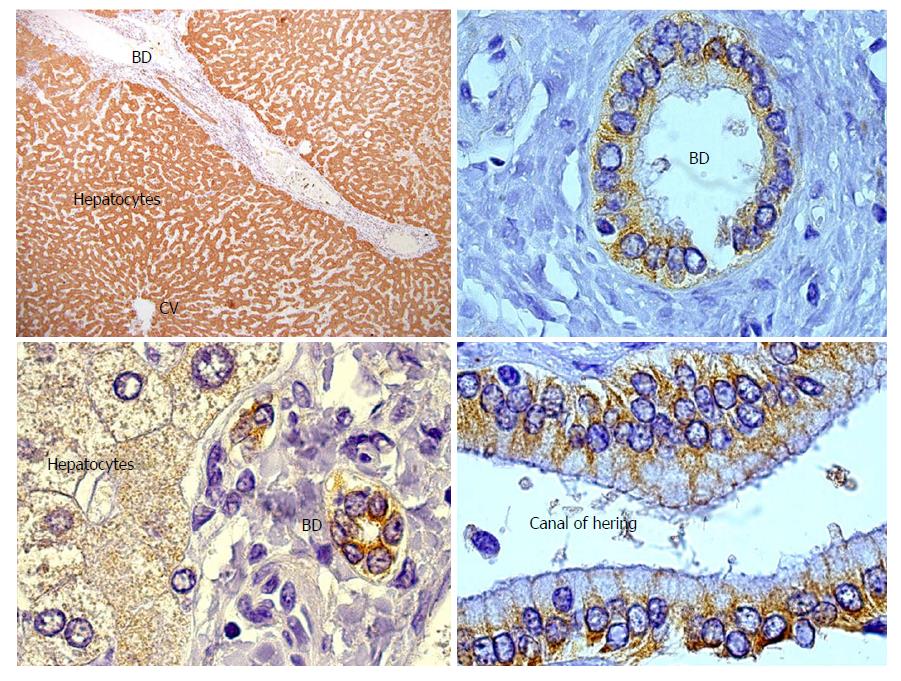
Figure 1 GSTT1 expression in human liver.
On the left part of the figure the hepatic parenchyma shows homogeneous staining of the cytoplasm of hepatocytes as well as epithelial cells of the bile ducts in the portal area. On the right part, a detail of the cytoplasmic staining of cholangiocytes and the Canal of Hering cells, considered a niche of hepatic progenitor cells. CV: Central vein; BD: Bile duct.
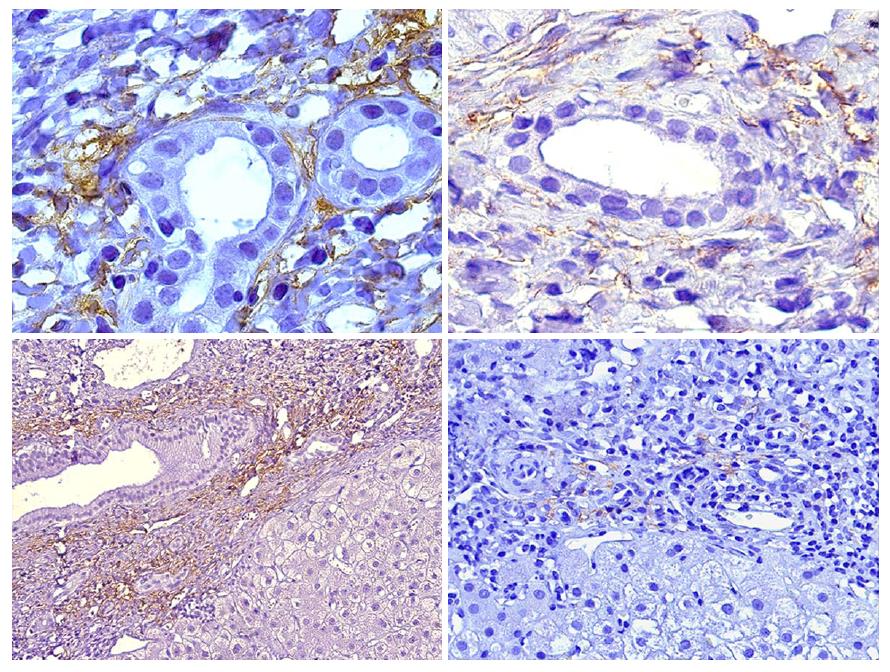
Figure 2 Portal areas in diagnostic biopsies of patients with plasma cell-rich rejection are shown.
Staining of C4d deposits is observed in portal capillaries indicating antibody-mediated rejection.
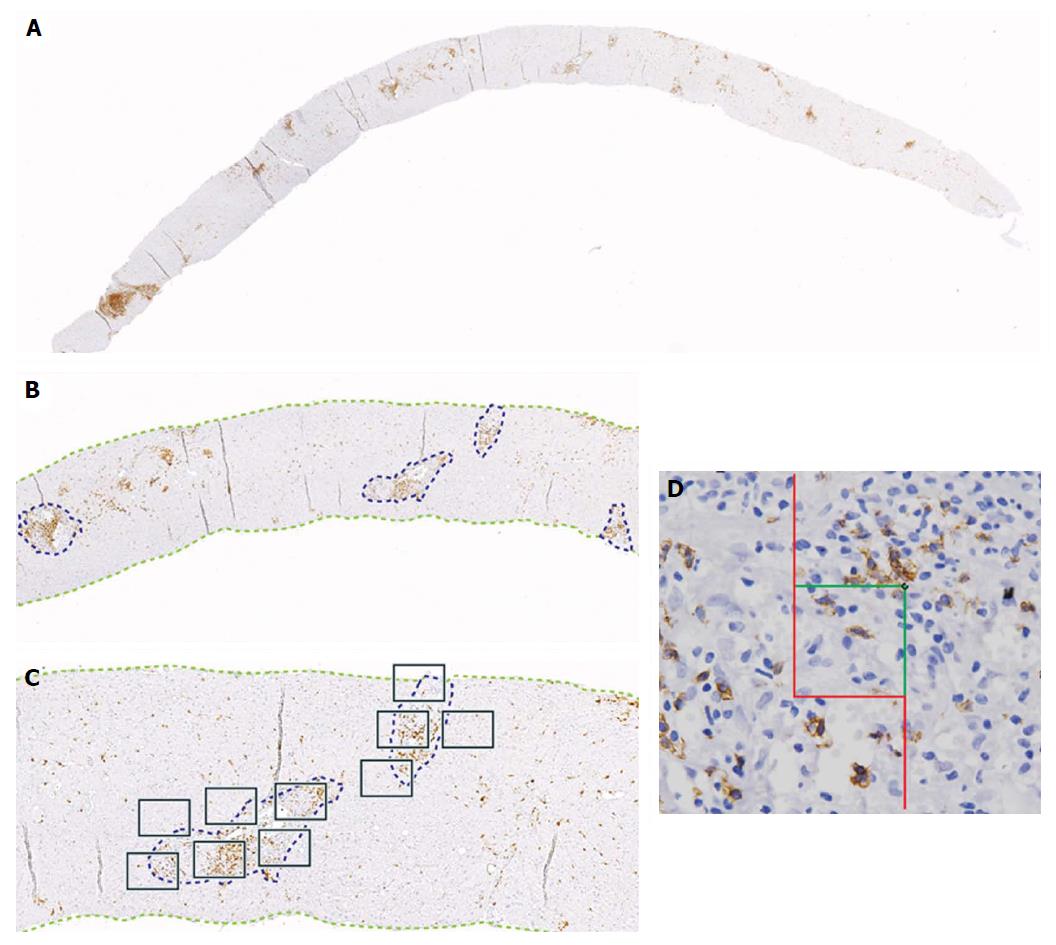
Figure 3 Representative images showing quantification procedure using NewCAST™ Visiopharm® software.
A: Super image capture of a slide; B: Computer-assisted drawing of the tissue (green) and manually drawing of the regions of interest (ROI) or portal areas (blue); C: Example of the unbiased sampling; D: A detail of cell quantification inside the counting frame.
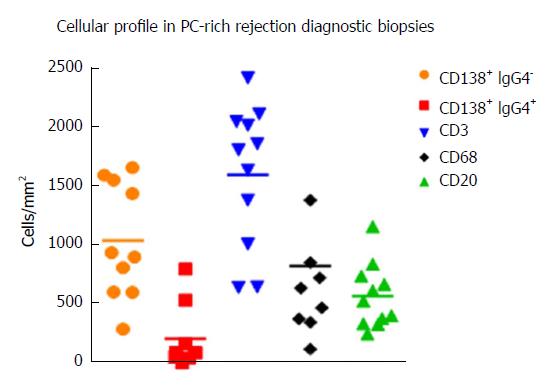
Figure 4 Total cell count/ area of tissuein diagnostic biopsies with the following markers: CD138+ plasma cells, IgG4+ plasma cells, CD3+ T lymphocytes, CD68+ macrophages, CD20+ B lymphocytes.
Mean values are shown.
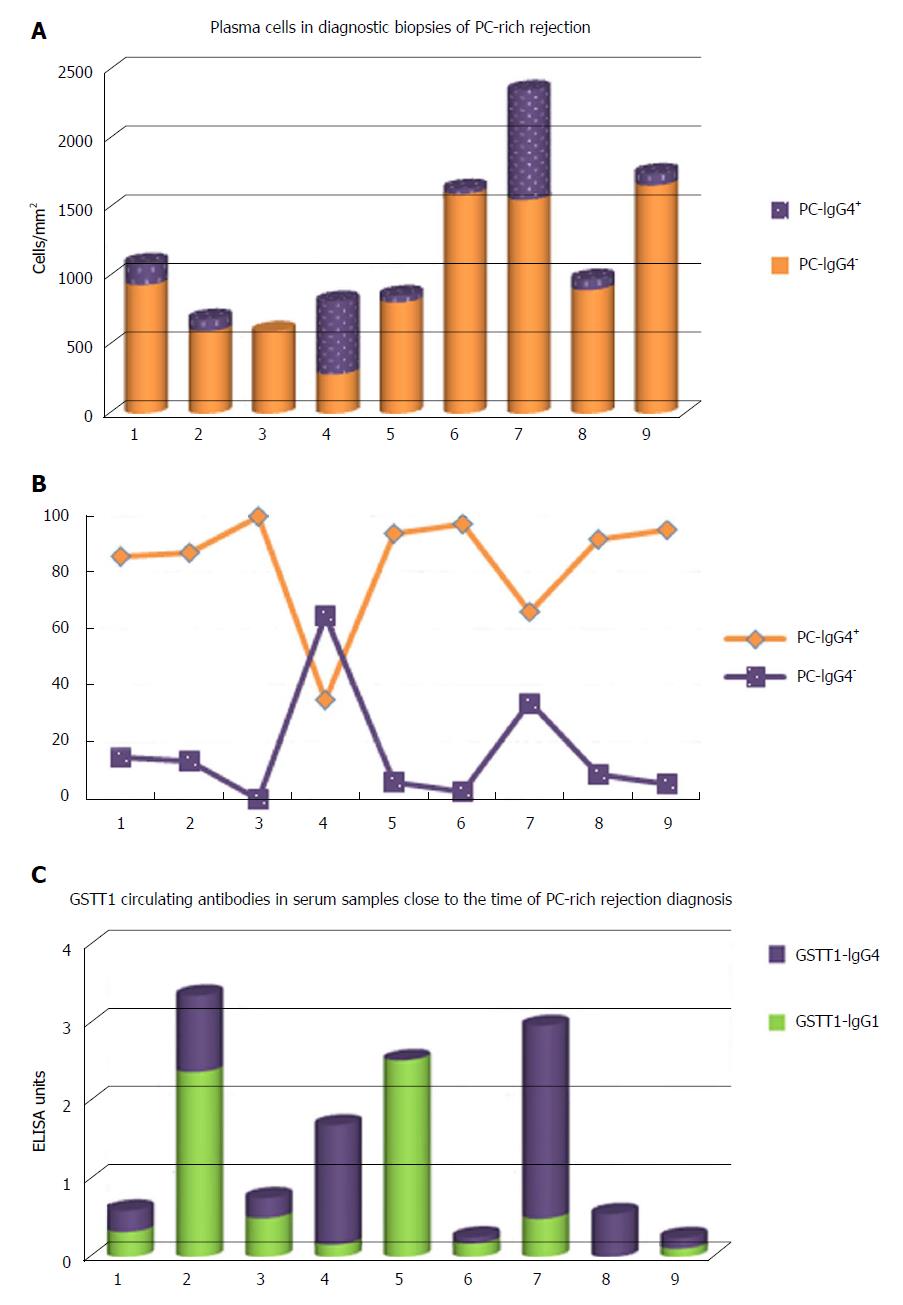
Figure 5 CD138+ plasma cells were quantified in the diagnostic biopsies of the 7 patients (A).
The results are shown as number of cells per mm2/tissue. IgG4+ plasma cells were also counted and subtracted from the total number of CD138+ cells. B: The same results are represented as percentages. C: Level of anti-GSTT1 antibodies in serum samples close to the diagnostic biopsy of 7 patients with dnAIH; note that only IgG1 and IgG4 were present whereas IgG2 and IgG3 were absent. It is important to highlight that these are donor-specific antibodies.
- Citation: Aguilera I, Aguado-Dominguez E, Sousa JM, Nuñez-Roldan A. Rethinking de novo immune hepatitis, an old concept for liver allograft rejection: Relevance of glutathione S-transferase T1 mismatch. World J Gastroenterol 2018; 24(29): 3239-3249
- URL: https://www.wjgnet.com/1007-9327/full/v24/i29/3239.htm
- DOI: https://dx.doi.org/10.3748/wjg.v24.i29.3239


