Copyright
©The Author(s) 2018.
World J Gastroenterol. Apr 7, 2018; 24(13): 1464-1477
Published online Apr 7, 2018. doi: 10.3748/wjg.v24.i13.1464
Published online Apr 7, 2018. doi: 10.3748/wjg.v24.i13.1464
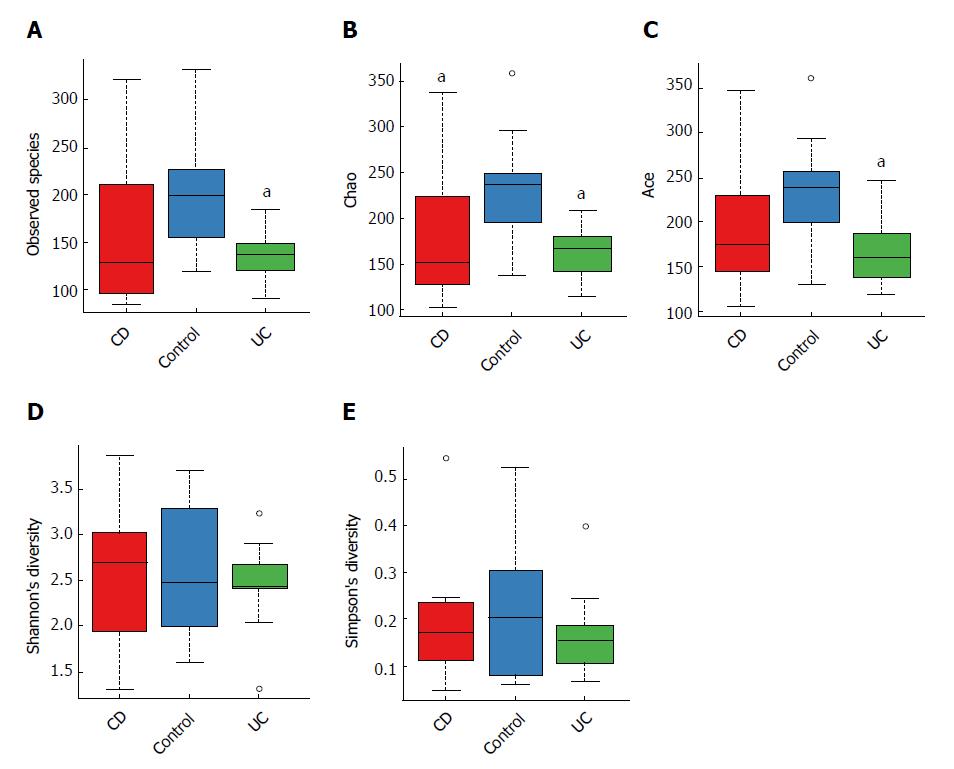
Figure 1 Alpha diversity indices boxplot, including community richness (observed species, chao, ace) and diversity (Shannon, Simpson) varied among each group.
A: Observed species; B: Chao; C: Ace; D: Shannon; E: Simpson. aP < 0.05 vs control. CD: Crohn’s disease; UC: Ulcerative colitis.
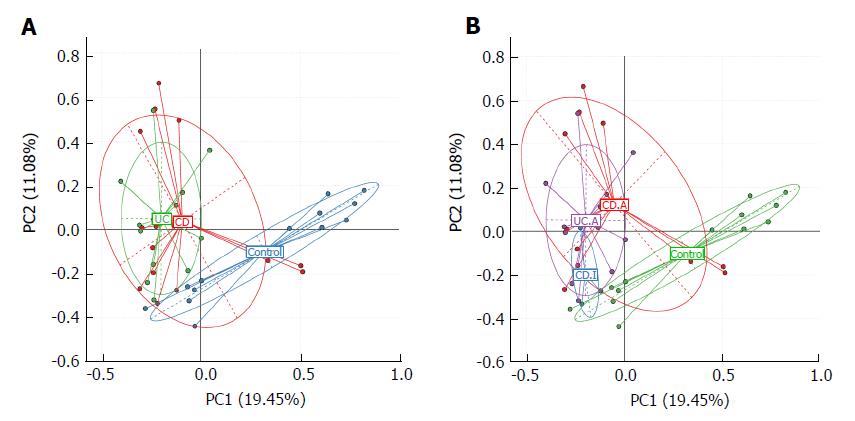
Figure 2 Principal component analysis based on the overall structure of the fecal microbiota in the entire study population.
Each data point represents an individual sample. A: Disease phenotype group; B: Stages of disease group. CD: Crohn’s disease; CD.A: Active CD; CD.I: Inactive CD; UC: Ulcerative colitis; UC.A: Active UC.
Figure 3 Taxonomic composition distribution in samples of phylum level.
A: Individually; B: Integrally. CD: Crohn’s disease; CD.A: Active CD; CD.I: Inactive CD; UC: Ulcerative colitis; UC.A: Active UC.
Figure 4 A: The taxonomic composition distribution in samples of genus level; B: Genera shown represent the 10 most abundant genera of CD, UC and control.
aP < 0.05 vs control, cP < 0.05 vs CD. CD: Crohn’s disease; UC: Ulcerative colitis.
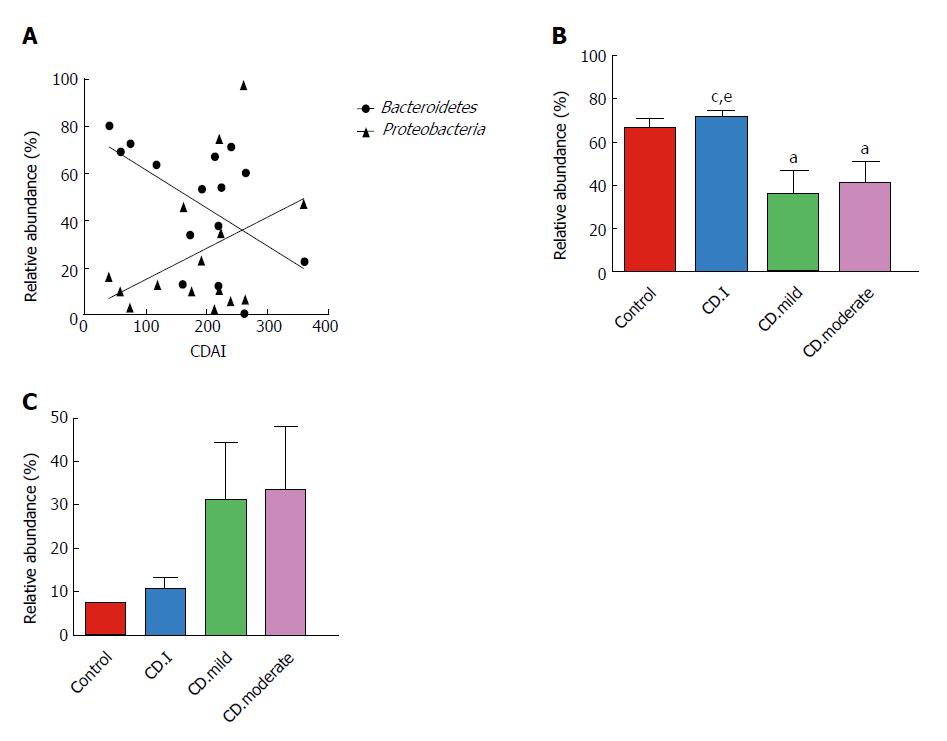
Figure 5 Correlation of the relative abundance of Bacteroidetes and Proteobacteria with Crohn’s disease activity index scores (A).
Bacteroidetes (r = -0.538, P = 0.039); Proteobacteria (r = 0.250, P = 0.369); B: Microbial composition of Bacteroidetes in patients with inactive/mild/moderate CD and in control; C: Microbial composition of Proteobacteria in patients with inactive/mild/moderate CD and in controls. aP < 0.05 vs control; cP < 0.05 vs CD.mild; eP < 0.05 vs CD.moderate. CDAI: CD activity index; CD.I: Inactive CD; CD.mild: Mild CD; CD.moderate: Moderate CD.
- Citation: Ma HQ, Yu TT, Zhao XJ, Zhang Y, Zhang HJ. Fecal microbial dysbiosis in Chinese patients with inflammatory bowel disease. World J Gastroenterol 2018; 24(13): 1464-1477
- URL: https://www.wjgnet.com/1007-9327/full/v24/i13/1464.htm
- DOI: https://dx.doi.org/10.3748/wjg.v24.i13.1464


