Copyright
©The Author(s) 2018.
World J Gastroenterol. Apr 7, 2018; 24(13): 1429-1439
Published online Apr 7, 2018. doi: 10.3748/wjg.v24.i13.1429
Published online Apr 7, 2018. doi: 10.3748/wjg.v24.i13.1429
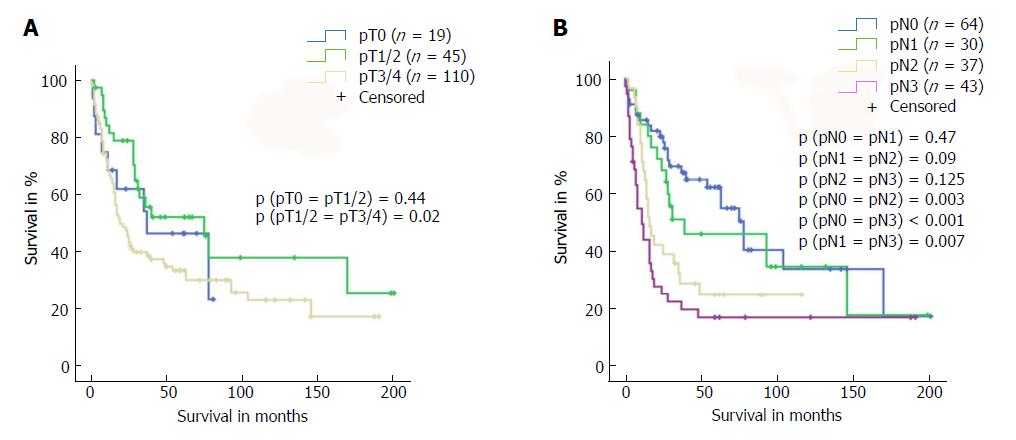
Figure 1 Overall survival.
The graphs present an overview of the long-term survival of the entire study cohort based on tumour (A) and nodal (B) stages.
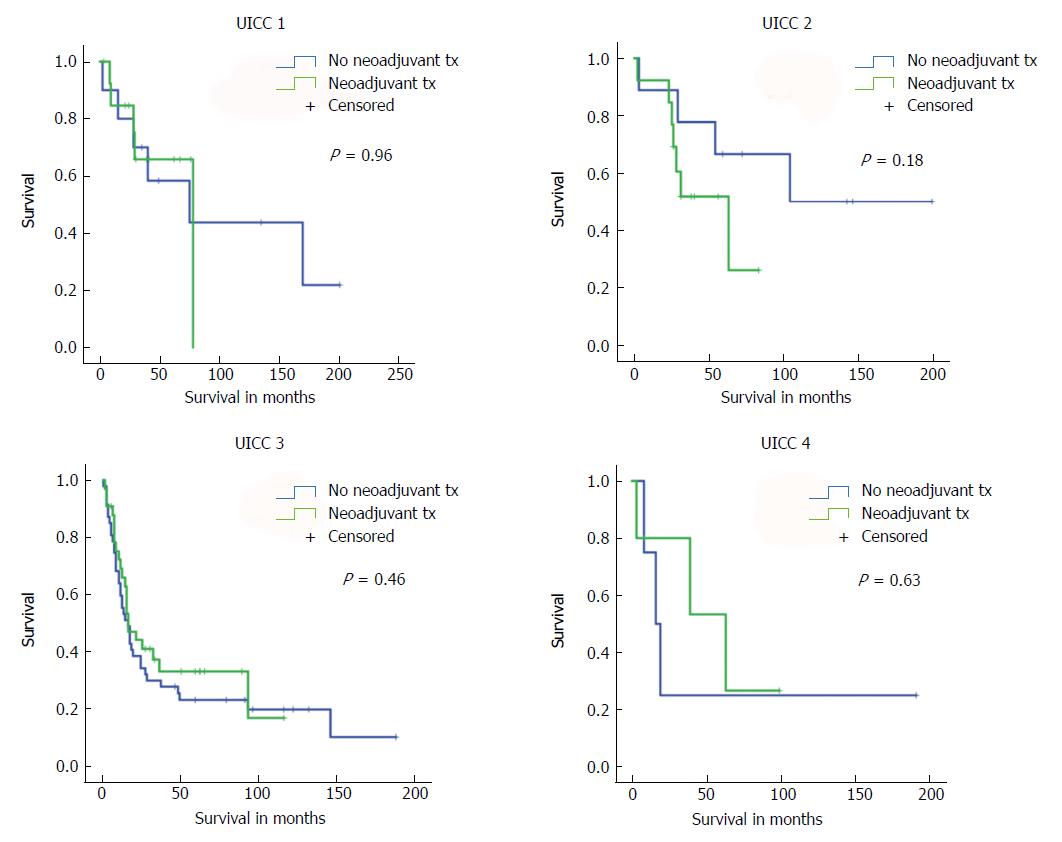
Figure 2 Impact of American Joint Committee on Cancer/Union for International Cancer Control stage on survival of patients with or without neoadjuvant pretreatment.
The graphs show the long-term survival of patients with or without neoadjuvant pretreatment and with the same postoperative UICC stage. Tx: treatment; UICC: Union for International Cancer Control.
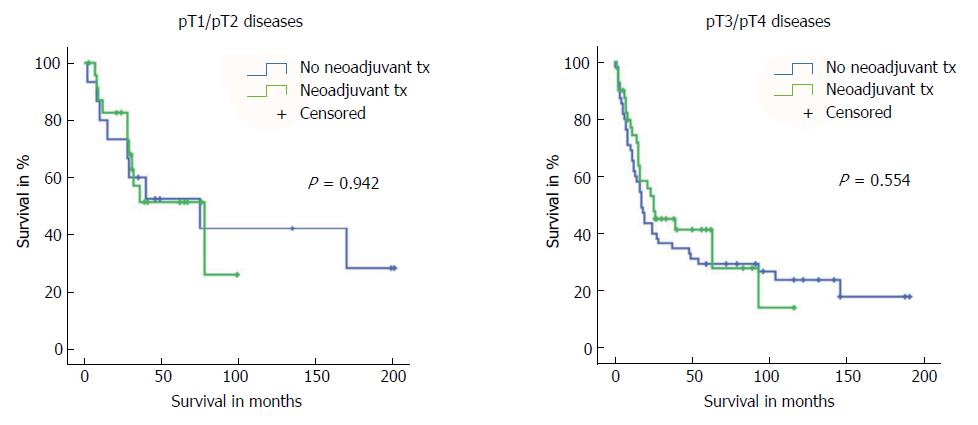
Figure 3 Impact of tumour stage on survival of patients with or without neoadjuvant pretreatment.
The graphs present the long-term survival of patients with or without neoadjuvant pretreatment and with similar postoperative tumour stages (early stage cancers: pT1/2; advanced stage cancers: pT3/4). Tx: Treatment.
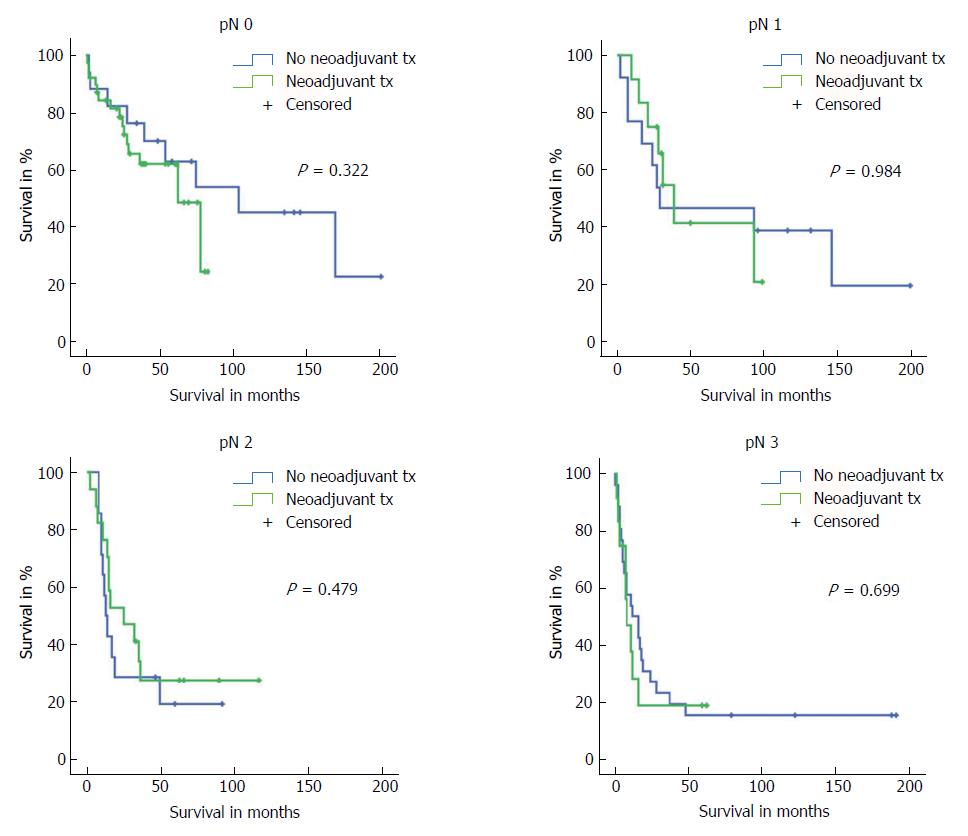
Figure 4 Impact of nodal stage on survival of patients with or without neoadjuvant pretreatment.
The graphs show the long-term survival of patients with or without neoadjuvant pretreatment and with the same postoperative nodal stages (pN0/pN1/pN2/pN3). Tx: Treatment.
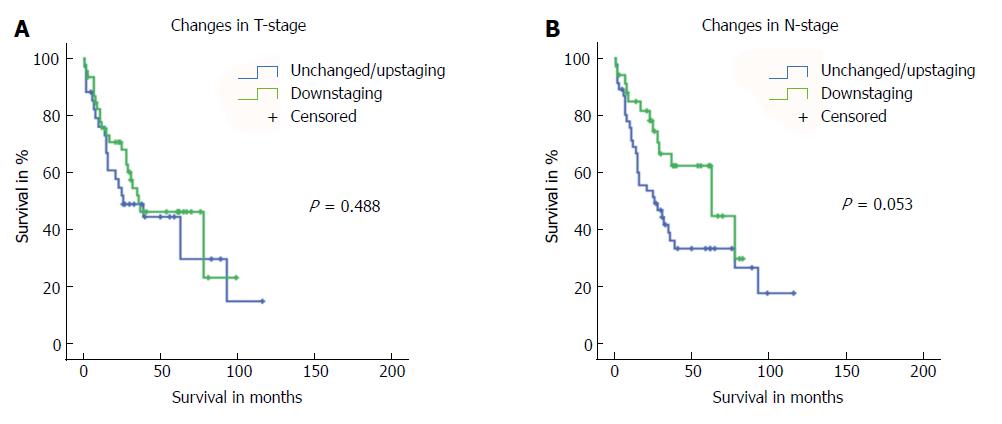
Figure 5 Impact of T and N down-staging on outcome after neoadjuvant treatment.
A: The long-term survival of patients with either T “down-staging” or “unchanged/up-staging” after neoadjuvant treatment; B: The long-term survival of patients with either N “down-staging” or “unchanged/up-staging” after neoadjuvant treatment. N: Nodal; T: Tumour; Tx: Treatment.
- Citation: Thomaschewski M, Hummel R, Petrova E, Knief J, Wellner UF, Keck T, Bausch D. Impact of postoperative TNM stages after neoadjuvant therapy on prognosis of adenocarcinoma of the gastro-oesophageal junction tumours. World J Gastroenterol 2018; 24(13): 1429-1439
- URL: https://www.wjgnet.com/1007-9327/full/v24/i13/1429.htm
- DOI: https://dx.doi.org/10.3748/wjg.v24.i13.1429


